HAL Id: halshs-02549044
https://halshs.archives-ouvertes.fr/halshs-02549044
Preprint submitted on 21 Apr 2020
HAL is a multi-disciplinary open access
archive for the deposit and dissemination of sci-entific research documents, whether they are pub-lished or not. The documents may come from teaching and research institutions in France or abroad, or from public or private research centers.
L’archive ouverte pluridisciplinaire HAL, est destinée au dépôt et à la diffusion de documents scientifiques de niveau recherche, publiés ou non, émanant des établissements d’enseignement et de recherche français ou étrangers, des laboratoires publics ou privés.
Does the Yield Curve Signal Recessions? New Evidence
from an International Panel Data Analysis
Jean-Baptiste Hasse, Quentin Lajaunie
To cite this version:
Jean-Baptiste Hasse, Quentin Lajaunie. Does the Yield Curve Signal Recessions? New Evidence from an International Panel Data Analysis. 2020. �halshs-02549044�
Working Papers / Documents de travail
WP 2020 - Nr 13
Does the Yield Curve Signal Recessions?
New Evidence from an International Panel Data Analysis
Jean-Baptiste Hasse
Quentin Lajaunie
Does the Yield Curve Signal Recessions? New Evidence from an
International Panel Data Analysis.
?Jean-Baptiste Hassea, Quentin Lajaunieb
aAix-Marseille Univ., CNRS, EHESS, Centrale Marseille, AMSE, Marseille, France
bParis Dauphine University, PSL Research University, France
Abstract
In this paper, we reexamine the predictive power of the yield spread across countries and over time. Using a dynamic panel/dichotomous model framework and a unique dataset covering 13 OECD countries over a period of 45 years, we empirically show that the yield spread signals recessions. This result is robust to different econometric specifications, control-ling for recession risk factors and time sampcontrol-ling. Using a new cluster analysis methodology, we present empirical evidence of a partial homogeneity of the predictive power of the yield spread. Our results provide a valuable framework for monitoring economic cycles.
Keywords: Yield Spread; Recession; Panel Binary Model; Cluster Analysis. JEL Classification: C23; C25; E37; E43; E52; E58.
?The authors thank Bertrand Candelon, Yin-Wong Cheung, Elena Ivona Dumitrescu, Laurent Ferrara
and Yannick Le Pen for helpful comments. This research was performed as part of a research program titled “Risk Management, Investment Strategies and Financial Stability” under the aegis of the Europlace Institute of Finance, a joint initiative with insti7. The usual disclaimer applies.
Email addresses: jb-hasse@hotmail.fr (Jean-Baptiste Hasse), quentin.lajaunie@dauphine.fr
1. Introduction
In this paper, we reexamine the predictive power of the yield spread in a unique dataset covering 13 OECD countries over a period of 45 years. Using a dichotomous panel model, we estimate the relationship between yield spreads and future recessions, controlling for mone-tary policy stance and seven other recession risk factors selected from the recent literature. Our results, robust to different econometric specifications and time sampling, confirm that yield spreads signal recessions. In a further analysis, we investigate the homogeneity of the panel-based estimates via a new cluster analysis procedure. A few clusters of countries emerge, and ten countries out of thirteen are concentrated in two clusters only. Such cluster-ing analysis indicates a partial homogeneity of the predictive power of the yield spread across countries. Furthermore, the predictive power of the yield curve appears to be unrelated to central bank policy rates, while cluster distribution could be linked to monetary policy frameworks (inflation targeting or alternative policy frameworks). Both empirical results are of major interest to policymakers who need to anticipate future economic conditions. Indeed, the relationship between the term spread and future recessions is a well-known stylized fact in economics; the yield curve has been monitored to detect recession signs for several decades (Wheelock and Wohar, 2009). However, two issues have recently been raised following the global financial crisis, namely, the homogeneity and the stability of the predictive power of the yield spread across countries and over time. On the one hand, the predictive power of the term spread appears to have declined since the early 1990s: monetary policy changes, the long-term interest rate conundrum and the zero lower bound have been identified as potential roots of this new regime (Chauvet and Potter, 2005). On the other hand, little is known about the predictive power of the yield spread outside the US. Indeed, most of the literature focuses on the US, while only a few authors extend empirical studies to several countries (Bernard and Gerlach, 1998; Ahrens, 2002; Moneta, 2005; Chinn and Kucko, 2015).
led to questions regarding the economic roots of the relationship between interest rates’ spread and business cycles. The term spread’s evolution has long been linked to business cycles and thus has been used as a valuable tool for monitoring such cycles. The cyclical behavior of the yield spread was first documented by Kessel (1965), who investigated the common variation of the term structure of interest rates and business cycles. Specifically, he showed that the yield spread tended to decline immediately before a recession. Similarly, Fama (1986) noted that the shape of the yield curve changed relative to expansion or reces-sion periods. The author argued that this relationship could be consistent with the liquidity preference hypothesis and could be explained in an intertemporal CAPM framework. Con-sidering the Fisher’s expectation hypothesis for the term structure of interest rates,1 Harvey (1988) provided analytical evidence that the yield spread was related to future consumption growth. Using the consumption CAPM (CCAPM) framework, the author empirically tested if expected Treasury bill returns contained information about expected consumption growth. The results indicated that the yield spread had more explanatory power than lagged con-sumption growth and lagged stock returns. This result supported the idea that investors’ expectations of future expansion or recession could impact the shape of the yield curve. In-deed, CCAPM implies that a cyclical consumption growth should induce a cyclical movement in expected returns. Hence, in this framework the predictive power of the yield spread could originate from agents’ anticipation of future recessions. More recently, Estrella (2005) built an analytical rational expectations model to investigate the theoretical roots of the usefulness of the yield curve as a predictor of output growth. The analytical results indicated that the yield curve in predictive relationships was a function of parameters of the monetary policy rule. Thus, the predictive power of the yield curve could not be said to be structural. Specif-ically, the predictor depended on the form of the monetary policy reaction function, which in turn might depend on explicit policy objectives.
Apart from the above theoretical studies, the vast majority of the literature focuses on assessing the empirical relationship between the term spread and the probability of future recessions. Seminal studies of Estrella and Hardouvelis (1991) and Kauppi and Saikkonen (2008) have enhanced the use of dichotomous models (probit and logit models) in a univari-ate framework. This empirical literature is mainly focused on the US, even if a few papers use data for other countries. Consequently, univariate and bivariate analyses are the most frequently used frameworks. Our contribution is a reexamination of the predictive power of the yield curve in an international panel data analysis. Specifically, this paper addresses two econometric challenges: (i) moving from a univariate/bivariate binary model analysis to a dynamic binary balanced panel framework, and (ii) proposing an innovative clustering method adapted to our new framework. Finally, our contribution to the literature is three-fold: (i) introducing a unique database including a set of eight country-level recession risk factors, and covering 13 industrialized countries over 45 years at a monthly frequency, (ii) confirming the predictive power of the yield curve in an international panel data framework, and (iii) investigating the potential homogeneity of this predictive power across countries.
The rest of this paper is organized as follows. In Section 2, we present a review of the literature on the predictive power of the yield curve across countries and over time. In Section 3, we introduce a modeling framework to move from the univariate binary model analysis of Kauppi and Saikkonen (2008) to a dynamic panel/dichotomous model framework. Moreover, this framework is accompanied by a proposed methodological extension to the recent literature on clustering analysis (e.g., Zhang, Wang and Zhu, 2019). In Section 4, we discuss the empirical results of our international panel data and clustering analysis. Finally, we summarize the usefulness of our new framework for policymakers and economic forecasters and highlight policy implications with respect to the role of monetary policy in the predictive power of the yield spread.
2. Literature
2.1. Using the yield curve to forecast recessions
In the 1990s, early empirical studies investigated the relationship between the yield curve and future recessions using binary response models in a univariate framework. Among those studies, the seminal paper of Estrella and Hardouvelis (1991) introduced the use of probit models to forecast recessions. Focusing on the US, the authors showed that the yield spread had a greater predictive power than did the index of leading indicators and survey forecasts. Subsequently, Bernard and Gerlach (1998) and Estrella and Mishkin (1998) extended their findings by analyzing the yield curves in several countries. Similarly, Moneta (2005) focused on European countries to compare the predictive power of several yield spreads of different maturities. The results indicated that the “10 y minus 3 m” yield spread appeared to be the most useful indicator for predicting recession in the medium and long term (two quarters and eight quarters, respectively). In this strand of research, a consensus has emerged that binary response models based on the shape of the yield curve are useful tools for predicting recessions in the US. Specifically, probit models (Dotsey, 1998; Estrella, Rodrigues and Schich, 2003; Wright, 2006; Rosenberg and Maurer, 2008) and logit models (Sensier et al., 2004; Moneta, 2005) have all been used in the static and univariate setting.2 The introduction of a dynamic approach by Kauppi and Saikkonen (2008) confirmed the usefulness of the yield spread in forecasting recessions (see also Duarte, Venetis and Paya, 2005; Nyberg, 2010; Ng, 2012, and other studies). The empirical results of the researchers’ econometric specification pro-vided additional evidence of usefulness of the yield spread for forecasting recessions in the US.
While a proper econometric specification is important, the choice of control variables is also crucial. Exploring this, Wright (2006) shows that using both the level of central banks’ rates and term spreads can result in better predictive performance than can using term
spreads alone. Indeed, this variable can be used to disentangle the origins of yield spread variations that could be related to variations of short- and/or long-term yields.3 Further-more, the author argues that term premiums should not be neglected, as they could have an impact on the shape of the yield curve; however, Rosenberg and Maurer (2008) provide evidence to the contrary. Specifically, the latter authors empirically show that taking term premiums into account does not lead to better recession forecasts. According to them, the expectation component of the yield spread indeed signals recession, but the term premium is uninformative. Other macroeconomic variables have predictive power and can improve recession forecasting accuracy. First, Nyberg (2010) provides some empirical evidence of the usefulness of stock market returns and the foreign term spread. These additional vari-ables can capture the monetary policy stance but cannot be indicators of other potential risk factors for recessions. A subsequent study by Ng (2012) extends previous analyses by incorporating a more complete set of recession risk factors (financial market expectations of a gloomy economic outlook, credit or liquidity risks in the general economy, the risks of negative wealth effects resulting from the bursting of asset price bubbles, and signs of dete-riorating macroeconomic fundamentals).4 In a more recent study, Park, Simar and Zelenyuk (2018) replicate the results of Kauppi and Saikkonen (2008) obtained with a parametric linear dynamic probit model. Extending the data up to 2017, the researchers validate the results using both parametric and nonparametric validation approaches. To improve probit models’ fitting in the US, other variables have also been suggested, such as sentiment (Christiansen,
3Specifically, the author argues that considering the yield spread only leads to the conclusion that an
increasing (respectively, decreasing) short-term yield has an effect on recession probability similar to that of a decreasing (respectively, increasing) long-term yield.
4The authors use macroeconomic and financial indicators to proxy the four risk factors: the yield spread,
the TED spread (the interest rate differential between 3-month LIBOR and 3-month T-bills), the equity price index, the housing price index, and a macro-leading index.
Eriksen and Moller, 2014), credit (Ponka, 2017), liquidity (Ng, 2012), money supply variables (Hwang, 2019), volatility index (VIX) (Adrian, Estrella and Shin, 2010) and economic policy uncertainty (Karnizova and Li, 2014).
2.2. Predictive power of the yield curve across countries and over time
The economists’ consensus based on a large body of empirical evidence is that binary response models perform well in forecasting future probabilities of recessions. However, the future predictive power of the yield curve remains fragile, as it is not structural but related to monetary policy (Estrella, 2005). Specifically, the predictive power of the yield spread is a function of parameters of the monetary policy rule. Such parameters are based on policy objectives (money supply targeting, inflation targeting or price level targeting) that could change over time and across monetary areas. Thus, the relevance of generalizing the use of yield spreads in forecasting recessions relies on both stability and homogeneity of their relationship.
On the one hand, the literature has been enriched with several empirical papers inves-tigating the effects of structural breaks in monetary policy. Including a Markov-switching coefficient variation in the probit model, Dueker (1997) and Ahrens (2002) both reject the linearity hypothesis. Both authors observe significant regimes, and, in particular, the results of Ahrens (2002) indicate that the two estimated regimes are associated with expansions and recessionary periods, respectively. However, the results of Estrella, Rodrigues and Schich (2003) and Wright (2006) indicate that binary models of expansion-recession provide more stable estimates than does a continuous model of GDP growth. In a dynamic probit model framework, Chauvet and Potter (2002; 2005) and Bellego and Ferrara (2009) show that time-varying probit models improve in-sample fitting. However, following the modeling framework of Kauppi and Saikkonen (2008), Kauppi (2008), Ng (2012) and more recently Hwang (2019) provide the opposite evidence (see Rudebusch and Williams, 2009 for a discussion of the
puzzle of the enduring predictive power of the yield spread).
On the other hand, while the early literature focused on the US, more recent empirical studies have investigated the predictive power of the yield curve in an international frame-work. The objective is to assess the homogeneity of the relationship between the yield spread and probability of recessions across countries. For instance, Bernard and Gerlach (1998) and Ahrens (2002) perform the first international analyses. Their respective data samples cover eight countries among Belgium, Canada, France, Germany, Italy, Japan, the Netherlands, the UK and the US. The authors’ cross-country analyses highlight that the yield curve pre-dicts future recessions in all countries. However, the authors point out that its information content differs from one country to another. For instance, the predictive power of the yield curve is greater in Canada, Germany and the US than in Japan, Italy or the Netherlands. To a lesser extent, Estralla, Rodrigues and Schich (2003) and Sensier et al. (2004) focus on the US and several European countries and observe that the overall patterns in countries in the chosen set are similar. Duarte, Venetis and Paya (2005) and Moneta (2005) focus on the Euro area and obtain results that confirm the usefulness of the yield spread in predicting the likelihood of a future recession in the Euro area (see also Estrella and Mishkin (1997)). Moneta’s results also emphasize that the German and French yield spreads are the most significant signals of recession in the Euro area and that country-level data provides better forecasting performance than does aggregated data. Chinn and Kucko (2015) have recently built the largest database covering nine countries (Canada, France, Germany, Italy, Japan, the Netherlands, Sweden, the UK and the US) over the period of 1970-2013. The results of the researchers’ review of the predictive power of the yield curve indicate that probit models are a relatively good fit for the United States, Germany and Canada over the entire dataset, while the remaining models largely failed to anticipate the recessions of the 2000s. The mod-els for Japan and Italy did not predict recessions well. While the literature is dominated by univariate time series analyses, a few papers deviate from this approach. For instance,
Wright (2006) and King, Levin, and Perli (2007) use a bivariate time series approach to show that adding federal funds rates and credit spreads, respectively, as macroeconomic variables improves probit models’ estimations in the US. Interestingly, the attempt of Ozturk and Pereira (2013) to reexamine the predictive power of the yield curve using a panel approach is, as far as we know, the first empirical study trying to compare the empirical results of probit models in an international framework. However, the researchers’ results are weakened by several drawbacks pertaining to econometric and data issues.5
3. Using a yield spread to predict recessions 3.1. Model
A dichotomous model enables us to regress a binary dependent variable on continuous independent variables. In this paper, we aim to estimate the probability at time t − 1 that the economy will fall into recession at time t. The state of the economy is represented by a discrete variable yttaking the value of 1 if the economy is in recession at time t, and equal to
0 otherwise. This dependent variable is estimated from various explanatory variables. The latter represent the state in which the economy will be at time t and make it possible to calculate the value πt of an index. A binary financial analysis can be written as
yt= 1 if πt > 0 0 if πt ≤ 0 (1)
Estrella and Hardouvelis (1991), Estrella and Miskin (1996, 1997, 1998) and Bernard and
5Unfortunately, the empirical study of Ozturk and Pereira (2013) is based on unbalanced panel data; the
researchers use a static binary model only, and their results are subject to statistical biases. Their modeling approach could have been dramatically improved using econometric specifications introduced in Kauppi and Saikkonen (2008) (i.e., using a dynamic dichotomous model with a lagged binary variable, a lagged index variable or both). Additionally, their estimations could have been adjusted for cross-sectional dependence using the correction of Driscoll and Kraay (1998).
Gerlach (1998) were the first to estimate the probability that a recession occurs at time t with a simple probit model, using the spread between the three-month and ten-year yields and macroeconomic variables to improve the quality of the regression. The model takes the following form:
P rt−1(yt= 1) = F (πt) = F (xt−1β) for t = 1, 2, ..., T, (2)
where T represents the number of time series observations. Dependent variable yt is a
[t − 1] vector, xt−1 is a [(t − 1) × k] matrix that represents explanatory variables, k is the
number of explanatory variables, β is a [k] vector that contains the set of estimated coeffi-cients, and F(.) is a transformation function.6
Chauvet and Potter (2005) proposed an improvement in estimating this relationship, adding a latent continuous stochastic process and a coefficient associated with the error term. This explanatory variable has two important purposes. First, as a new source of information, it can improve the quality of the estimation. However, it also allows a time-varying parameter by taking into account the dependence on the latent variable. Kauppi and Saikkonen (2008) added a lagged dependent variable. Indeed, if a country is in recession at time t, because of persistence of the crisis, the probability of the country staying in recession during the following period must be impacted accordingly. Then, a dynamic dichotomous model takes the following form:
P rt−1(yt= 1) = F (πt) = F (xt−1β + yt−1α + πt−1δ)), for t = 1, 2, ..., T, (3)
The parameters are the same as those defined in equation (2). The innovation of Chauvet and Potter (2005) and Kauppi and Saikkonen (2008) consists of the addition of two variables
– the lagged index variable πt−1 and the lagged dependent variable yt−1 – with their
associ-ated coefficients δ and α.
Bernard and Gerlach (1998) studied the possibility of using the yield curve to predict future economic activity in 8 countries. More recently, Chinn and Kucko (2015) reexamined this evidence using a dataset covering 9 countries. The above papers estimated this relation-ship for each country separately from the others. Instead, a panel approach is preferred that would estimate the impact of an explanatory variable on a set of countries. Moreover, a panel regression allows increasing the number of observations available to improve the estimation capacity. Candelon, Dumitrescu and Hurlin (2014) proposed extending the model of Kauppi and Saikkonen (2008) to panel data. This model is written as follows:
P rt−1(yi,t = 1) = F (πi,t) = F (β
0
xi,t−1+ αyi,t−1+ δπi,t−1) + ηi),
for t = 1, 2, ..., T, and i = 1, 2, ..., N, (4)
where N is the number of countries in the panel, and ηi is a country fixed effect for the
control of unobserved heterogeneity and potential bias.
The first innovation of this paper consists of an extension of approaches of Bernard and Gerlach (1998) and Chinn and Kucko (2015) with a dynamic logit panel model.7 As far as we know, a balanced panel framework has never been used to study the relationship between yield spreads and recessions.8 Here, we propose extending such studies by evaluating a set
7The logistic c.d.f. is preferred to a Gaussian c.d.f, as it is more appropriate for the study of extreme
events such as crises.
of 13 countries over the period of 1975-2019, following the methodology proposed recently by Candelon, Dumitrescu and Hurlin (2014). Furthermore, we follow Kauppi and Saikkonen (2008), and we estimate four dichotomous models. The first model is a static logit model with two restrictions: α = δ = 0 (Model 1). In this case, only the exogenous macroeconomic variables affect the future occurrence of a crisis. The second and third models are dynamic and include either a lagged value of the binary variable yt−1 with a restriction on δ = 0
(Model 2) or a lagged index πt−1 with a restriction on α = 0 (Model 3). Finally, the last
dynamic model combines the two preceding cases and includes both a lagged binary variable
yt−1 and a lagged index πt−1(Model 4). The model that minimizes the Bayesian information
criterion (BIC) is chosen as the best model.
Candelon, Dumitrescu and Hurlin (2014) show that the four different alternatives of the model presented in equation 4 can be estimated under the same exact maximum likelihood (EML) framework. The log-likelihood function has the following general form:
LogL(θ, ηi) = N X i=1 LogLi(θ, ηi) (5) = N X i=1 T X t=1
[yi,tlog(F (πi,t(θ, ηi))) + (1 − yit)log(1 − F (πi,t(θ, ηi)))], (6)
However, the panel approach may have some constraints. The assumption of heterogene-ity of fixed effects and homogeneheterogene-ity of coefficients can be too restrictive. Berg, Candelon and Urbain (2008) explained that pooling all available countries into one panel model might not be the best approach. In the last few years, heterogeneous panels have been the main focus of attention in the literature. Many studies test slope homogeneity and poolability in the panel data. Within this framework, Blomquist and Westerlund (2013) have extended the
test of Pesaran and Yamagata (2008). However, their test does not deal with the practically relevant case of cross-sectional dependence and does not allow a dependence between the set of predictors and unobservable errors. Ando and Bai (2015) proposed an alternative solution using the results of Bai (2009), Su and Chen (2013) and Ando and Bai (2014) by incorpo-rating interactive fixed effects.
Thus, to improve upon the existing methods, the second innovation of this paper consists of the identification of subgroups with homogeneous slopes. Our purpose is to deal with the potential problem of heterogeneity. Inspired by the approach proposed by Zhang, Wang and Zhu (2019), we have developed a two-stage approach involving a dichotomous dynamic model. In their paper, Zhang, Wang and Zhu (2019) proposed a method for panel data where fixed effects were estimated upstream. Such fixed effect, once estimated, is subtracted from the explanatory variable (Lin and Ng, 2012). Afterwards, the parameters of the regression are estimated by minimizing over all possible partitions of N units into G groups. In our case, since the dependent variable is a binary variable that only takes values of 1 or 0, we cannot simply subtract the fixed effect. Hence, to estimate our clustering logit model, we first estimate the intercept for each country. Subsequently, we estimate the group-specific parameters βg for g = 1, ..., G while constraining the previously estimated fixed effects.
Let B = {βg : 1, ..., G} be the set comprising all group-specific slopes and γ = {gi, i =
1, ..., N } be the set of group memberships for N units. Thus, γ ∈ FG denotes a particular
partition of N units, where FG is the set of all partitions of {1, ..., N } into G groups. Let Ψ
be a compact subset of R and Θ be a compact subset of Rp. The fixed effect estimator ηi is
denoted by ∼ηi and is estimated for each unit by the maximum likelihood method as follows:
LogL( ∼ βi,∼ηi) = T X t=1
[yi,tlog(F (πi,t(βi, ηi))) + (1 − yi,t)log(1 − F (πi,t(βi, ηi)))], (7)
Next, following Zhang, Wang and Zhu (2019), we estimate the group memberships and the group-specific parameters by LogL( ∼ βg) = N X i=1 T X t=1
[yi,tlog(F (πi,t(βg,
∼
ηi))) + (1 − yit)log(1 − F (πi,t(βg,
∼
ηi)))], (8)
where β ⊆ Θ and γ ∈ FG.
In the second step (equation 8), we select βg that minimizes Pearson residuals9 over all
possible partitions of N units into G groups and the group-specific parameters from a compact subset of Rp. The estimation procedure is summarized in Appendix 1. This allows us to
cluster our sample of countries into homogeneous country groups. Moreover, the existence of groups of several countries allows us to test the partial homogeneity of our sample.
3.2. Data
Our objective is to reexamine the empirical relationship between the slope of the yield curve and future recessions. Our contribution is twofold: we aim to investigate (i) this relationship across countries and over time, and (ii) the cross-country homogeneity of the results. To do so, a dynamic panel data is clearly the most appropriate framework, as we aim to combine both cross-sectional and time series dimensions. Specifically, this approach is relevant because we aim to control the impact of monetary policy on the predictive power of the yield curve as well as other recession risk factors. Furthermore, we choose a balanced panel framework. The motivation of this choice is that our specific contribution is to in-vestigate the homogeneity of this relationship across countries. Indeed, the identification of subgroups of countries with heterogeneous predictive power of the yield spread is based on a regression-based clustering method that requires balanced panel data.
9Pearson residuals are particularly suitable for dichotomous models; see Cordeiro and Simas (2009) and
To match these data requirements, we introduce an extended and updated database that is, as far as we know, the largest balanced panel dataset for the yield spread - recession relationship. First, starting from the dataset of Chinn and Kucko (2015), we add four coun-tries and update the entirety of data until March 2019. Specifically, our dataset includes 13 OECD countries: Australia, Belgium, Canada, France, Germany, Italy, Japan, the Nether-lands, New Zealand, Sweden, Switzerland, the UK and the US. The resulting dataset covers almost 45 years of historical data for each country at the monthly frequency. As to the yield curve, we choose to focus on the “10-year minus 3-month” interest rate spread because in the literature it is considered to be the most statistically significant predictor of recessions (Ny-berg, 2010). However, our dataset differs from those discussed in the literature, as we do not focus on NBER and ECRI recession dummies for the US and other countries, respectively, but instead use OECD recession dummies.10 This choice is motivated by the objective to cover as many countries as possible and the need to have similar measures for every country (see the methodology of Bry and Boschan (1971)). Following Wright (2006), we also include central bank policy rates as a control variable. Indeed, this variable enables us not only to control for monetary policy but also to disentangle the origins of yield spread variations that could be related to variations of short- and/or long-term yields. As to macroeconomic control (“macro-control”) variables, we first include a set of recession risk factors as in Ng (2012), who introduces stock and housing markets’ prices, credit and liquidity spreads and a macro-leading index. Instead of using a macro-leading indicator, we select a set of distinct macroeconomic variables. Specifically, we include proxies of (i) stock market returns as in Nyberg (2010), (ii) oil price returns as in Kilian and Vigfusson (2017), (iii) housing
mar-10As a robustness check, we have performed the same estimations using the ECRI database. The results
obtained using OECD and ECRI recession dummies are similar. We note that the ECRI database has a lower coverage than does the OECD database (in our case, the respective numbers of countries are 8 and 13). The results based on ECRI recession dummies are reported in Appendix 2.
ket returns as in Ng (2012), (iv) market sentiment as in Christiansen, Eriksen and Molleret (2014), (v) credit spread as in Ponka (2017), (vi) liquidity spread as in Ng (2012), (vii) eco-nomic policy uncertainty as in Karnizova and Li (2014) and (viii) volatility index (VIX) as in Adrian, Estrella and Shin (2010).
In summary, our final database covers 13 OECD countries from 1975 to 2019 at the monthly frequency (i.e., having a total of 6,890 observations). It includes country-level re-cession dummies, 10-y - 3-m yield spreads, central banks’ rates and a set of rere-cession risk factors selected from the recent literature. Tables 1 and 2 summarize the data and report the variables’ respective names, descriptions, codes, frequency, sources and references.
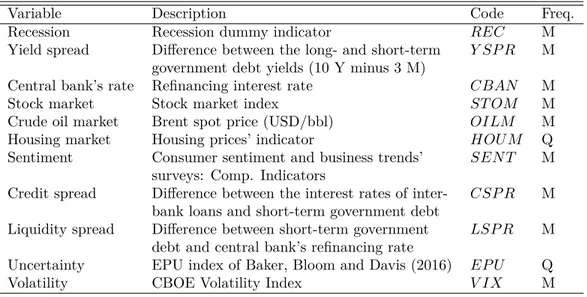
Table 1: Description of Panel Data: 1975-2019
Variable Description Code Freq. Recession Recession dummy indicator REC M Yield spread Difference between the long- and short-term Y SP R M
government debt yields (10 Y minus 3 M)
Central bank’s rate Refinancing interest rate CBAN M Stock market Stock market index ST OM M Crude oil market Brent spot price (USD/bbl) OILM M Housing market Housing prices’ indicator HOU M Q Sentiment Consumer sentiment and business trends’ SEN T M
surveys: Comp. Indicators
Credit spread Difference between the interest rates of inter- CSP R M bank loans and short-term government debt
Liquidity spread Difference between short-term government LSP R M debt and central bank’s refinancing rate
Uncertainty EPU index of Baker, Bloom and Davis (2016) EP U Q Volatility CBOE Volatility Index V IX M
Notes: This table provides each country-level variable’s name, description, code and frequency (“M” = monthly and “Q” = quarterly). The panel
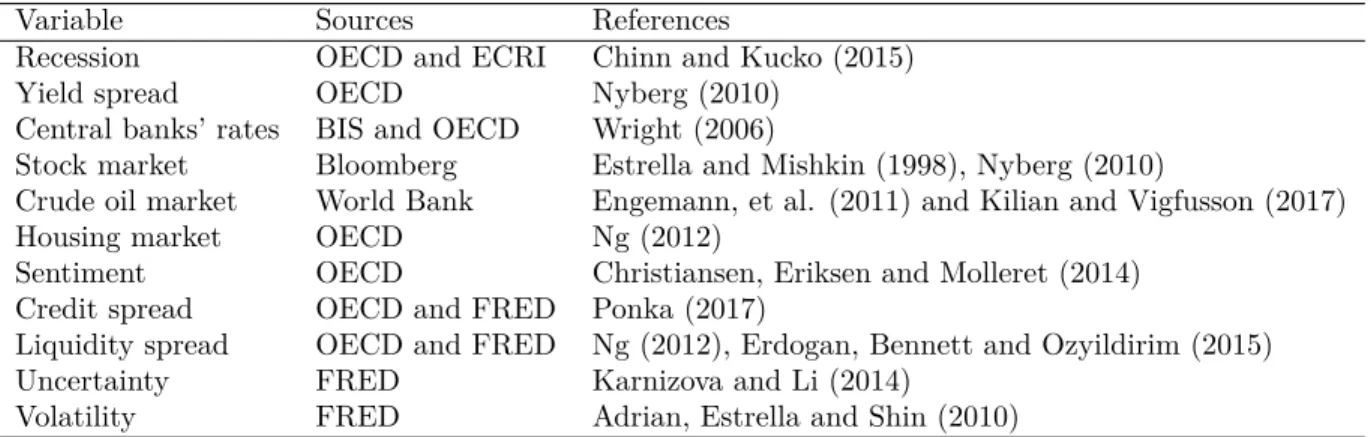
Table 2: Sources of Panel Data
Variable Sources References
Recession OECD and ECRI Chinn and Kucko (2015) Yield spread OECD Nyberg (2010)
Central banks’ rates BIS and OECD Wright (2006)
Stock market Bloomberg Estrella and Mishkin (1998), Nyberg (2010)
Crude oil market World Bank Engemann, et al. (2011) and Kilian and Vigfusson (2017) Housing market OECD Ng (2012)
Sentiment OECD Christiansen, Eriksen and Molleret (2014) Credit spread OECD and FRED Ponka (2017)
Liquidity spread OECD and FRED Ng (2012), Erdogan, Bennett and Ozyildirim (2015) Uncertainty FRED Karnizova and Li (2014)
Volatility FRED Adrian, Estrella and Shin (2010)
Notes: This table shows each country-level variable’s name, source(s) and reference(s).
3.3. Empirical analysis
In this section, we aim to reexamine the predictive power of the term spread in two steps. First, we investigate the relationship between the yield spread and future recessions in an international balanced panel dataset. Afterwards, using the previously obtained results, we test the homogeneity of this relationship across countries via a cluster analysis. Consistently with previous studies, we use a binary model framework, preferring a logit model to a probit model as in Sensier et al. (2004), Moneta (2005) and more recently in Hwang (2019).11 On this basis, we introduce some changes of the econometric specification. First, we have to adapt the binary model mostly used in a univariate fashion in the literature to a balanced panel framework using country fixed effects. Next, in regression estimation, we use the cor-rection of Driscoll and Kraay (1998) for cross-sectional dependence.12 Using this augmented
11Probit and logit are both dichotomous models that exhibit very similar features. Considering the low
ratio of ones to zeros that the recession dummy exhibits, logit models are preferable to probit models. See Ben Naceur, Candelon and Lajaunie (2019).
12Based on a univariate analysis, previous empirical studies use the correction of Newey and West (1987,
logit model, we run several regressions to estimate various binary models’ specifications: a static logit model (Model 1), a dynamic logit model including the lagged recession dummy
yt−1 (Model 2), a dynamic logit model including the lagged index πt−1 (Model 3), and a
dy-namic logit model including both the lagged recession dummy and the lagged index (Model 4). The results are reported in Table 3.
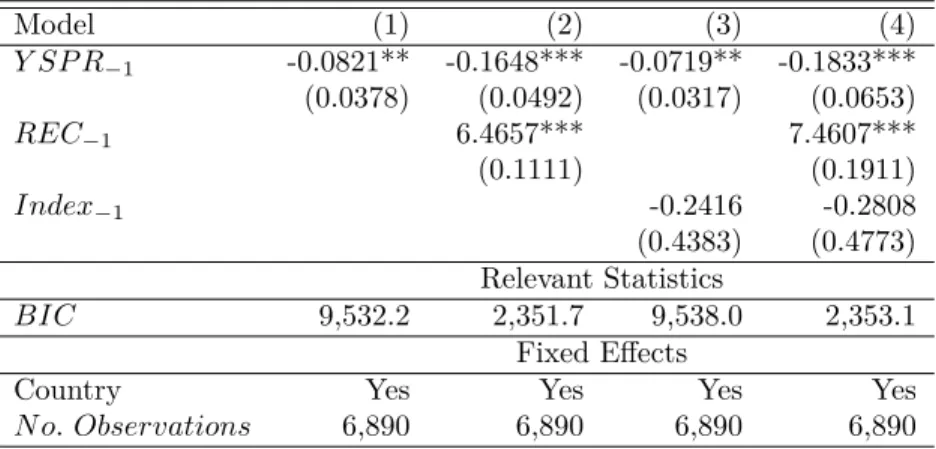
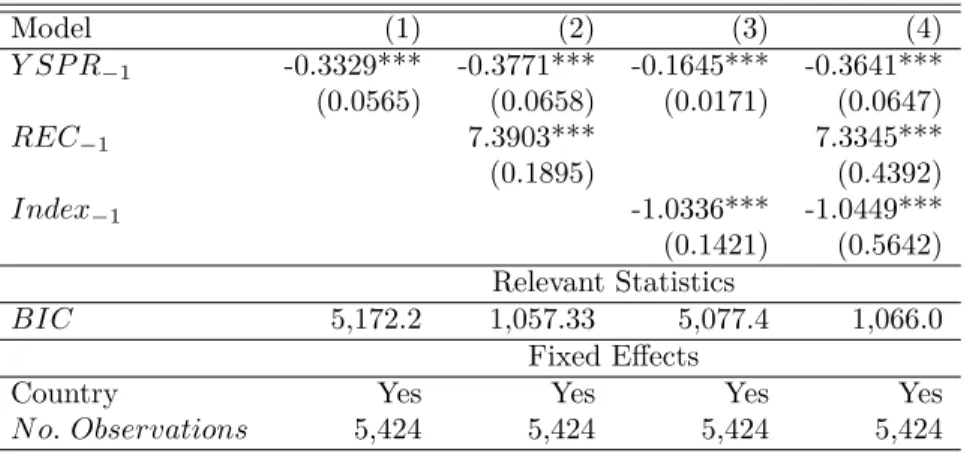
Table 3: Estimation results of panel logit models – Monthly frequency – 1975-2019
Model (1) (2) (3) (4) Y SP R−1 -0.0821** -0.1648*** -0.0719** -0.1833*** (0.0378) (0.0492) (0.0317) (0.0653) REC−1 6.4657*** 7.4607*** (0.1111) (0.1911) Index−1 -0.2416 -0.2808 (0.4383) (0.4773) Relevant Statistics BIC 9,532.2 2,351.7 9,538.0 2,353.1 Fixed Effects
Country Yes Yes Yes Yes
N o. Observations 6,890 6,890 6,890 6,890
Notes: This table reports the estimates obtained from static and dynamic logit models (1)-(4) for a panel of 13 countries covering the period
from February 1975 to March 2019 at the monthly frequency with one lag. The dependent variable is the recession dummy. Results are computed using R 3.6.0 (R Core Team, 2020) and the ews (v0.1.0 ; Hasse and Lajaunie, 2020) package. The full reproducible code is available on CRAN. We report Bayesian (BIC) information criteria for each specification. Standard errors are reported in parentheses below the estimates. Labels ∗ ∗ ∗, ∗∗ and ∗ indicate significance at 99%, 95% and 90% levels, respectively.
The results in Table 3 indicate that the lagged yield spread and the lagged binary coef-ficients are both highly significant. Their coefcoef-ficients are negative and positive, respectively, i.e., the yield spread is inversely related to the probability of future recessions, and the prob-ability of being in recession at time t − 1 is strongly related to the probprob-ability of being in recession at time t. In a period covering 45 years of monthly observations across 13 OECD countries, the predictive power of yield spread appears to be strong and significant. This predictive power is unaltered by the presence of a lagged binary variable or/and a lagged index. According to the BIC criteria,13 we select model (2) that includes an intercept, the
lagged yield spread and the lagged binary variables. The next steps of this empirical study focus on this econometric specification.
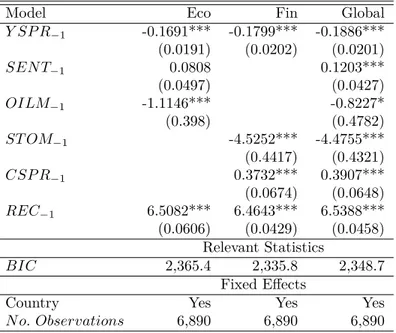
The recent literature on the predictive power of the yield spread extensively explores the role of the macroeconomic environment. Following Nyberg (2010), Ng (2012), Christiansen, Eriksenand and Moller (2014), Karnizova and Li (2014), Engemann, Kliesen and Owyang (2011), Adrian, Estrella and Shin (2010), Kilian and Vigfusson (2017) and Ponka (2017), we extend the previously selected model (Model 2), adding several macro-control variables. These recession risk factors are added to Model 2 in different ways, depending on whether they are economic or financial variables. The results are reported in Table 4, where the two first columns indicate the regression results obtained with economic and financial control variables, respectively. Indeed, Ng and Wright (2013) document that recessions originate from monetary policy shocks or potentially in the financial markets. The last column reports the results of a regression of the augmented binary model with all macro-control variables.
The results in Table 4 indicate that the coefficient of the lagged yield spread remains negative and significant. Consistently with the recent literature, the predictive power of the yield spread is robust to the introduction of macro-control variables. Specifically, coefficients of crude oil and stock market returns are negative and significant as in Engemann, Kliesen and Owyang (2011) and Ng (2012), respectively. The results also confirm the empirical re-sults of Christiansen, Eriksen and Moller (2014) and Ponka (2017), as both coefficients of sentiment and credit spread are positive and significant.
measure guiding the choice of the model and the optimal lag orders for explanatory variables (Estrella and Miskhin, 1998; Kauppi and Saikkonen, 2008). Following Candelon, Dumitrescu and Hurlin (2012, 2014), we select the best econometric specification from BIC criteria.
Table 4: Estimation of a panel with macro-control variables – Monthly frequency – 1975-2019
Model Eco Fin Global
Y SP R−1 -0.1691*** -0.1799*** -0.1886*** (0.0191) (0.0202) (0.0201) SEN T−1 0.0808 0.1203*** (0.0497) (0.0427) OILM−1 -1.1146*** -0.8227* (0.398) (0.4782) ST OM−1 -4.5252*** -4.4755*** (0.4417) (0.4321) CSP R−1 0.3732*** 0.3907*** (0.0674) (0.0648) REC−1 6.5082*** 6.4643*** 6.5388*** (0.0606) (0.0429) (0.0458) Relevant Statistics BIC 2,365.4 2,335.8 2,348.7 Fixed Effects
Country Yes Yes Yes
N o. Observations 6,890 6,890 6,890
Notes: This table reports the estimates obtained from a dynamic logit model with a lagged binary variable for a panel of 13 countries over the
period of 1975 − 2019 with one lag, and monthly frequency. The dependent variable is the recession dummy. We report Bayesian (BIC) information criteria for each specification. Using generalized linear model (GLM), the correction of Driscoll and Kraay (1998) is applied so that standard errors are robust to heteroscedasticity and autocorrelation. Results are computed using R 3.6.0 (R Core Team, 2020). Standard errors are reported in parentheses below the estimates. Labels ∗ ∗ ∗, ∗∗ and ∗ indicate significance at 99%, 95% and 90% levels, respectively.
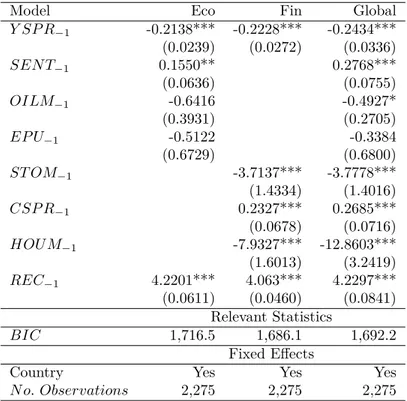
As a robustness check, we replicate this first empirical study in two steps. First, we use data at the quarterly frequency to test the predictive power of the yield spread in a longer run. Incidentally, using lower-frequency data enables us to enrich the model with two macro-control variables that are unavailable at the monthly frequency: housing market prices and economic policy uncertainty (see Table 5). Afterwards, we restrict the initial data sample to a temporal subsample from 1999, using lags of 1 and 3 (see Tables 6 and 7, respectively). Indeed, the recent literature reports structural breaks during the 1990s; additionally, the European Monetary Union adopted Euro in 1999. The results are reported in Tables 5, 6 and 7, respectively.
Table 5: Estimation of a panel with macro-control variables – Quarterly frequency – 1975-2019
Model Eco Fin Global
Y SP R−1 -0.2138*** -0.2228*** -0.2434*** (0.0239) (0.0272) (0.0336) SEN T−1 0.1550** 0.2768*** (0.0636) (0.0755) OILM−1 -0.6416 -0.4927* (0.3931) (0.2705) EP U−1 -0.5122 -0.3384 (0.6729) (0.6800) ST OM−1 -3.7137*** -3.7778*** (1.4334) (1.4016) CSP R−1 0.2327*** 0.2685*** (0.0678) (0.0716) HOU M−1 -7.9327*** -12.8603*** (1.6013) (3.2419) REC−1 4.2201*** 4.063*** 4.2297*** (0.0611) (0.0460) (0.0841) Relevant Statistics BIC 1,716.5 1,686.1 1,692.2 Fixed Effects
Country Yes Yes Yes
N o. Observations 2,275 2,275 2,275
Notes: This table reports the estimates obtained from a dynamic logit model with a lagged binary variable for a panel of 13 countries at the
quarterly frequency over the period of 1975 − 2019 with one lag. The dependent variable is the recession dummy. We report Bayesian (BIC) information criteria for each specification. Using generalized linear model (GLM), the correction of Driscoll and Kraay (1998) is applied so that standard errors are robust to heteroscedasticity and autocorrelation. Results are computed using R 3.6.0 (R Core Team, 2020). Standard errors are reported in parentheses below the estimates. Labels ∗ ∗ ∗, ∗∗ and ∗ indicate significance at 99%, 95% and 90% levels, respectively.
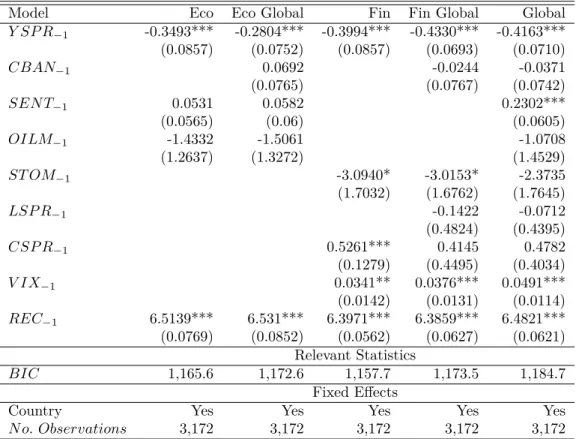
Table 6: Estimation of a panel with macro-control variables – Monthly frequency – 1999-2019
Model Eco Eco Global Fin Fin Global Global
Y SP R−1 -0.3493*** -0.2804*** -0.3994*** -0.4330*** -0.4163*** (0.0857) (0.0752) (0.0857) (0.0693) (0.0710) CBAN−1 0.0692 -0.0244 -0.0371 (0.0765) (0.0767) (0.0742) SEN T−1 0.0531 0.0582 0.2302*** (0.0565) (0.06) (0.0605) OILM−1 -1.4332 -1.5061 -1.0708 (1.2637) (1.3272) (1.4529) ST OM−1 -3.0940* -3.0153* -2.3735 (1.7032) (1.6762) (1.7645) LSP R−1 -0.1422 -0.0712 (0.4824) (0.4395) CSP R−1 0.5261*** 0.4145 0.4782 (0.1279) (0.4495) (0.4034) V IX−1 0.0341** 0.0376*** 0.0491*** (0.0142) (0.0131) (0.0114) REC−1 6.5139*** 6.531*** 6.3971*** 6.3859*** 6.4821*** (0.0769) (0.0852) (0.0562) (0.0627) (0.0621) Relevant Statistics BIC 1,165.6 1,172.6 1,157.7 1,173.5 1,184.7 Fixed Effects
Country Yes Yes Yes Yes Yes
N o. Observations 3,172 3,172 3,172 3,172 3,172
Notes: This table reports the estimates obtained from a dynamic logit model with a lagged binary variable for a panel of 13 countries over the
period of 1999 − 2019 with one lag, and monthly frequency. The dependent variable is the recession dummy. We report Bayesian (BIC) information criteria for each specification. Using generalized linear model (GLM), the correction of Driscoll and Kraay (1998) is applied so that standard errors are robust to heteroscedasticity and autocorrelation. Results are computed using R 3.6.0 (R Core Team, 2020). Standard errors are reported in parentheses below the estimates. Labels ∗ ∗ ∗, ∗∗ and ∗ indicate significance at 99%, 95% and 90% levels, respectively.
Table 7: Estimation of a panel with macro-control variables – Quarterly frequency – 1999-2019
Model Eco Eco Global Fin Fin Global Global
Y SP R−1 -0.2844*** -0.1876*** -0.2905*** -0.2249*** -0.1806*** (0.0856) (0.0683) (0.0756) (0.0546) (0.0536) CBAN−1 0.1014 0.0159 -0.01206 (0.0796) (0.0747) (0.0612) SEN T−1 0.2012*** 0.2121*** 0.5172*** (0.0604) (0.0656) (0.0556) OILM−1 -2.0676*** -2.1877*** -0.4707 (0.4961) (0.5484) (1.3111) EP U−1 -2.2981** -1.1563 -1.0933** (1.0894) (1.3624) (0.5359) ST OM−1 -8.8147*** -9.0266*** -8.1991*** (0.8977) (0.9178) (0.8160) LSP R−1 0.8268*** 1.0324*** (0.2668) (0.2290) CSP R−1 0.4089** 1.0534*** 1.2680*** (0.1844) (0.3204) (0.2725) HOU M−1 -13.3674*** -13.6075*** -23.3889*** (3.2317) (3.5788) (2.7381) V IX−1 -0.0054 -0.0157 0.0067 (0.0128) (0.0140) (0.0126) REC−1 4.2541*** 4.2642*** 4.1242*** 4.1681*** 4.4197*** (0.0752) (0.0769) (0.0704) (0.0764) (0.0843) Relevant Statistics BIC 844.8 850.3 810.4 821.2 818.7 Fixed Effects
Country Yes Yes Yes Yes Yes
N o. Observations 1,040 1,040 1,040 1,040 1,040
Notes: This table reports the estimates obtained from a dynamic logit model with a lagged binary variable for a panel of 13 countries at the
quarterly frequency over a period of 1999 − 2019 with one lag.The dependent variable is the recession dummy. We report Bayesian (BIC) information criteria for each specification. Using generalized linear model (GLM), the correction of Driscoll and Kraay (1998) is applied so that standard errors are robust to heteroscedasticity and autocorrelation. Results are computed using R 3.6.0 (R Core Team, 2020). Standard errors are reported in parentheses below the estimates. Labels ∗ ∗ ∗, ∗∗ and ∗ indicate significance at 99%, 95% and 90% levels, respectively.
Compared to the previous results for the predictive power of the yield spread and the role of macro-control variables, the results in Tables 5, 6 and 7 are qualitatively similar. As in Table 4, we observe that the lagged yield spread’s coefficient remains negative and significant in each case. The predictive power of the term spread is altered neither if the lag is changed from 1 to 3 months nor by the introduction of two more macro-control variables (i.e., eco-nomic policy uncertainty (EPU), housing market prices and stock market volatility (VIX)). Moreover, the results for these recession risk factors reported in Table 5 are consistent with the literature. On the one hand, the lagged housing market prices’ coefficient is negative and highly significant as in Ng (2012). Indeed, in the past 45 years, housing prices often declined before the start of most recessions, as did equity prices. On the other hand, the lagged EPU coefficient is not significant. This result is similar to those of Karnizova and Li (2014), who empirically show that EPU is only significant beyond 5 quarters. Hence, economic policy uncertainty does not seem to have a significant role in recessions in the short run (from 1 to 3 months). By the way, the VIX is not significant as in Adrian, Estrella and Shin (2010). The results in Table 6 that reports regressions on a temporal subsample are similar to those described previously. Focusing on the period from 1999 to 2019, the results indicate that the predictive power of the yield spread is robust to time-sampling. The coefficient of the lagged yield spread is still highly significant and negative; however, we note that it is slightly smaller than it is for the entire sample at the quarterly frequency. This result supports the widespread idea that the predictive power of the yield curve has deteriorated during the 1990s. According to Chinn and Kucko (2015), this phenomenon stems from (i) changing links between interest rates and output, (ii) a failure of long-term interest rates to rise along with the short-term policy rate, and (iii) the zero lower bound (ZLB) implying that central banks try to lower long-term interest rates instead of lowering short-term rates. To deal with this issue, we add another macro-control variable: the lagged central banks’ rates as in Wright (2006). The pur-pose is to regress the yield spread, controlling for (i) the monetary policy stance and (ii) the
level of short- and long-term yields at the same time.14 In addition to central banks’ rates, we also add the lagged liquidity spread as in Ng (2012). The results indicate that neither central bank rates nor liquidity risks are significant. The monetary policy stance, proxied by central bank rates, appears to have no short-term impact on the predictive power of the term spread.
In summary, the predictive power of the term spread has been reexamined using a panel dataset of 13 OECD countries over a period of more than 45 years. The results indicate that the yield spread is a valuable predictor of future recession in the short run. Specifi-cally, the predictive power of the term spread is robust to several econometric specifications, time sampling and, last but not the least, a set of eight macro-control variables chosen in accordance with recent studies. Our approach is different from the literature due to using balanced panel data. Using these empirical results that are consistent with those of previ-ous studies, we now aim to investigate the homogeneity of the predictive power of the yield curve. To do so, we adapt the methodology of Zhang, Wang and Zhu (2019) to compute optimal clusters of entities in a balanced panel dataset. The purpose of this cluster anal-ysis is to indirectly assess homogeneity of the predictive power of the yield spread across countries. If the optimal number of clusters is equal to the number of countries, then this cluster analysis would indicate that our results for the predictive power of the yield spread are highly heterogeneous across countries. If, on the contrary, the optimal number of clusters is equal to one, then we could presume that our results are highly homogeneous. Using the optimal number and composition of clusters, we further analyze the predictive power of the yield spread in each cluster. The results are reported in Table 8 and illustrated in Appendix 3.
14Referring to Wright (2006), Chinn and Kucko (2015) choose to use the 3-month yield instead of central
banks’ rate. Using this short-term yield enables the authors to easily control the level of yields to distinguish a rise in short-term yields and a drop in long-term yields, and vice versa.
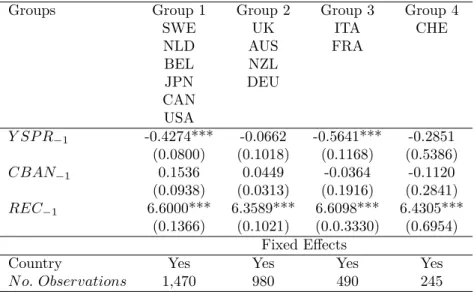
Table 8: Estimation of the clustering panel – Monthly frequency – 1999-2019
Groups Group 1 Group 2 Group 3 Group 4 SWE UK ITA CHE NLD AUS FRA BEL NZL JPN DEU CAN USA Y SP R−1 -0.4274*** -0.0662 -0.5641*** -0.2851 (0.0800) (0.1018) (0.1168) (0.5386) CBAN−1 0.1536 0.0449 -0.0364 -0.1120 (0.0938) (0.0313) (0.1916) (0.2841) REC−1 6.6000*** 6.3589*** 6.6098*** 6.4305*** (0.1366) (0.1021) (0.0.3330) (0.6954) Fixed Effects
Country Yes Yes Yes Yes
N o. Observations 1,470 980 490 245
Notes: This table reports the estimates obtained from a dynamic logit model with a lagged binary variable for a panel of 13 countries at the
monthly frequency over the period of 1999 − 2019 with one lag. The dependent variable is the recession dummy. Using generalized linear model (GLM), the correction of Driscoll and Kraay (1998) is applied so that standard errors are robust to heteroscedasticity and autocorrelation. Results are computed using R 3.6.0 (R Core Team, 2020). Standard errors are reported in parentheses below the estimates. Labels ∗ ∗ ∗, ∗∗ and ∗ indicate significance at 99%, 95% and 90% levels, respectively.
At the global level, the results in Table 8 indicate that the predictive power of the yield spread across our sample of 13 OECD countries is partially homogeneous. Indeed, the cluster analysis reveals that the optimal combination consists of four clusters only. Moreover, among clusters of this optimal combination, 2 clusters include 10 countries out of 13. Next, at the cluster level, some differences are observed about the relationship between the term spread and future recessions. The lagged yield spread coefficient is significant for 2 clusters only (Group 1: Belgium, Canada, Japan, the Netherlands, Sweden and USA; Group 3: France and Italy). Furthermore, the coefficient is smaller for Group 3 than for Group 1, while cen-tral banks’ rates are not significant in any cluster. As other variables are significant in each cluster, the optimal set of clusters appears to be computed from yield spread coefficients only. In summary, these results highlight that more than the half of countries have experi-enced recessions related to a yield spread decrease, and that, at first sight, monetary policy seems to have no role in the short run. Incidentally, countries belonging to the European Monetary Union since 1999 are not grouped in a single cluster. However, we shall approach
the conclusions with caution, as central banks’ policy rates are only one proxy of monetary policy stance. Investigating further shows that the latter results highlight a distinct feature of monetary policy across clusters. Indeed, the cluster distribution may be related to the monetary policy target and to the use of unconventional monetary policy tools. For instance, Groups 1 and 3 include proportionally few countries that have adopted inflation targeting over the period from 1999 to 2019. In contrast, Group 2 includes a majority of countries that have officially adopted inflation targeting before 1999. Last, we note that countries engaged in some form of quantitative easing (QE) and that have reached the Zero Lower Bound (ZLB) tend to be in the same clusters. These similarities are reported in Table 9.
Table 9: Clusters, monetary policy and the yield curve
Country Cluster Pred. power Monetary policy target Date QE Dates Belgium A Yes hybrid Yes 2015 Canada A Yes inflation targeting 1991 No
Japan A Yes inflation targeting 2013 Yes 2001 Netherlands A Yes hybrid Yes 2015 Sweden A Yes inflation targeting 1993 Yes 2015 United States A Yes inflation targeting 2012 Yes 2008 Australia B No inflation targeting 1993 No
Germany B No hybrid Yes 2015
New Zealand B No inflation targeting 1990 No
United Kingdom B No inflation targeting 1992 Yes 2009
France C Yes hybrid Yes 2015
Italy C Yes hybrid Yes 2015
Switzerland D No hybrid Yes 2012
Notes: This table reports the clusters’ countries and the associated results for the predictive power of the yield curve, the monetary policy target
and date of the last change as well as the Quantitative Easing (QE) and the first launch date. Data on monetary policy targets are from the IMF Annual Report on Exchange Arrangements and Exchange Restrictions (2018).
Based on this empirical analysis, we confirm that monitoring the yield curve should be useful for forecasting recessions in most industrialized countries. At the global level, the predictive power of the yield spread is confirmed in a panel dataset covering a period of over 45 years of monthly observations and including 13 OECD countries. Controlling for a set of 8 recession risk factors selected from the empirical literature, the predictive power of the yield spread is also robust to several econometric specifications and time-sampling in the short run
(from 1 month to 1 quarter ahead). Investigating the potential homogeneity of the predictive power of the yield spread across countries, we perform a cluster analysis on the results from panel logit regressions. The results indicate that the relationship between the yield spread and the probability of future recession is partially homogeneous. Specifically, we provide empirical evidence that, controlling for central banks’ rates, the yield spread is a useful tool for more than a half of countries. Last, at the global level, central banks’ policy rates have no impact on the predictive power of the yield curve, while the results at the cluster level seem to indicate that the predictive power could be related to monetary policy target. These mixed results about the impact of conventional monetary policy on the predictive power of the yield curve are not completely consistent with the analytical and empirical results of Estrella (2005) and Wright (2006), respectively. However, our results are in line with Chinn and Kucko (2015): we find that the short-term rate parameter is statistically insignificant and the predictive power of the yield spread seems to be impacted by the ZLB. Hence, these results call into question the structural interpretation of the relationship between the term spread and future recession.
4. Conclusions
In this paper, we reexamine the predictive power of the yield curve across countries and over time. Our purpose is to confirm the predictive power of the yield spread and to in-vestigate its homogeneity across countries. To this end, we adapt the univariate modeling approach of Kauppi and Saikkonen (2008) to a balanced panel framework. We also adapt the clustering methodology of Zhang, Wang and Zhu (2019) for quantile regression to di-chotomous models. Afterwards, we build a unique database to estimate the predictive power of the term spread, controlling for central banks’ official rates (Wright, 2006), stock market returns (Nyberg, 2010), housing markets’ returns and liquidity spread (Ng, 2012), stock mar-ket volatility (VIX) (Adrian, Estrella and Shin, 2010), sentiment (Christiansen, Eriksen and
Molleret, 2014), economic policy uncertainty (Karnizova and Li, 2014), crude oil market re-turns (Engemann, Kliesen and Owyang, 2011; Kilian and Vigfusson, 2017) and credit spread (Ponka, 2017). Our results confirm the predictive power of the yield spread in most countries and indicate its partial homogeneity across countries. Our empirical findings, except those for the central bank policy rates, are consistent with the recent literature. Contrary to the analytical and empirical results of Estrella (2005) and Wright (2006), respectively, our find-ings indicate that central bank policy rates have no impact on the predictive power of the yield curve. However, the mixed results of the cluster analysis indicate that the predictive power of the term spread could be related to monetary policy frameworks (inflation targeting or alternative policy frameworks), as argued by Estrella (2005) or unconventional monetary policy tools, as argued by Chinn and Kucko (2015). Our results are robust to several econo-metric specifications, time-sampling and macro-control variables.
In summary, our contribution to the literature is threefold. First, we extend the database of Chinn and Kucko (2015), proposing a unique database including a set of eight country-level recession risk factors, and covering 13 industrialized countries over 45 years at the monthly frequency. Second, we confirm the predictive power of the yield spread in a new balanced panel framework and provide empirical evidence of its partial homogeneity via an innovative cluster analysis. Third, we show that monitoring of the yield curve evolution should be extended to countries other than the US. The impact of conventional monetary policy on the predictive power of the yield spread appears to be weaker than expected. These empirical findings support a wider use of the yield curve for monitoring business cycles.
References
Adrian, Tobias, Arturo Estrella, and Hyun Song Shin. "Monetary cycles, financial cycles and the business cycle." FRB of New York Staff Report 421 (2010).
Ahrens, Ralf. "Predicting recessions with interest rate spreads: a multicountry regime-switching analysis." Journal of International Money and Finance 21.4 (2002): 519-537.
Ando, Tomohiro, and Jushan Bai. "Asset pricing with a general multifactor structure."
Jour-nal of Financial Econometrics 13.3 (2015): 556-604.
Ando, Tomohiro, and Jushan Bai. "A simple new test for slope homogeneity in panel data models with interactive effects." Economics Letters 136 (2015): 112-117.
Bai, Jushan. "Panel data models with interactive fixed effects." Econometrica 77.4 (2009): 1229-1279.
Bellégo, Christophe, and Laurent Ferrara. "Forecasting Euro-Area Recessions Using Time-Varying Binary Response Models for Financial Markets." Banque de France Working Paper (2009).
Blomquist, Johan, and Joakim Westerlund. "Testing slope homogeneity in large panels with serial correlation." Economics Letters 121.3 (2013): 374-378.
Ben Naceur, Sami , Bertrand Candelon, and Quentin Lajaunie. "Taming financial develop-ment to reduce crises." Emerging Markets Review 40 (2019): 100618.
use of panel models to predict financial crises." Economics Letters 101.1 (2008): 80-83.
Bernard, Henri, and Stefan Gerlach. "Does the term structure predict recessions? The inter-national evidence." Interinter-national Journal of Finance & Economics 3.3 (1998): 195-215.
Bry, Gerhard, and Charlotte Boschan. "Programmed selection of cyclical turning points." Cyclical analysis of time series: Selected procedures and computer programs. NBER (1971): 7-63.
Candelon, Bertrand, Elena-Ivona Dumitrescu, and Christophe Hurlin. "Currency crisis early warning systems: Why they should be dynamic." International Journal of Forecasting 30.4 (2014): 1016-1029.
Candelon, Bertrand, Elena-Ivona Dumitrescu, and Christophe Hurlin. "How to evaluate an early-warning system: Toward a unified statistical framework for assessing financial crises forecasting methods." IMF Economic Review 60.1 (2012): 75-113.
Chauvet, Marcelle, and Simon Potter. "Predicting a recession: evidence from the yield curve in the presence of structural breaks." Economics Letters 77.2 (2002): 245-253.
Chauvet, Marcelle, and Simon Potter. "Forecasting recessions using the yield curve." Journal
of Forecasting 24.2 (2005): 77-103.
Chinn, Menzie, and Kavan Kucko. "The predictive power of the yield curve across countries and time." International Finance 18.2 (2015): 129-156.
recessions: The role of sentiment." Journal of Banking & Finance 49 (2014): 459-468.
Cordeiro, Gauss M., and Alexandre B. Simas. "The distribution of Pearson residuals in gen-eralized linear models." Computational statistics & data analysis 53.9 (2009): 3397-3411.
Dimand, Robert W., and Rebeca Gomez Betancourt. "Retrospectives: Irving Fisher’s Ap-preciation and Interest (1896) and the Fisher Relation." Journal of Economic Perspectives 26.4 (2012): 185-96.
Dotsey, Michael. "The predictive content of the interest rate term spread for future economic growth." FRB Richmond Economic Quarterly 84.3 (1998): 31-51.
Driscoll, John C., and Aart C. Kraay. "Consistent covariance matrix estimation with spa-tially dependent panel data." Review of Economics and Statistics 80.4 (1998): 549-560.
Duarte, Agustín, Ioannis A. Venetis, and Ivan Paya. "Predicting real growth and the probabil-ity of recession in the Euro area using the yield spread." International Journal of Forecasting 21.2 (2005): 261-277.
Dueker, Michael J. "Markov switching in GARCH processes and mean-reverting stock-market volatility." Journal of Business & Economic Statistics 15.1 (1997): 26-34.
Engemann, Kristie M., Kevin L. Kliesen, and Michael T. Owyang. "Do oil shocks drive busi-ness cycles? Some US and international evidence." Macroeconomic Dynamics 15.3 (2011): 498-517.
curve and stock market liquidity deviation measures." Review of Finance 19.1 (2015): 407-422.
Estrella, Arturo, and Gikas A. Hardouvelis. "The term structure as a predictor of real eco-nomic activity." The Journal of Finance 46.2 (1991): 555-576.
Estrella, Arturo, and Frederic S. Mishkin. "The yield curve as a predictor of US recessions." Current issues in economics and finance 2.7 (1996).
Estrella, Arturo, and Frederic S. Mishkin. "The predictive power of the term structure of interest rates in Europe and the United States: Implications for the European Central Bank."
European Economic Review 41.7 (1997): 1375-1401.
Estrella, Arturo, and Frederic S. Mishkin. "Predicting US recessions: Financial variables as leading indicators." Review of Economics and Statistics 80.1 (1998): 45-61.
Estrella, Arturo, Anthony P. Rodrigues, and Sebastian Schich. "How stable is the predictive power of the yield curve? Evidence from Germany and the United States." Review of
Eco-nomics and Statistics 85.3 (2003): 629-644.
Estrella, Arturo. "Why does the yield curve predict output and inflation?." The Economic
Journal 115.505 (2005): 722-744.
Engemann, Kristie M., Kevin L. Kliesen, and Michael T. Owyang. "Do oil shocks drive busi-ness cycles? Some US and international evidence." Macroeconomic Dynamics 15.S3 (2011): 498-517.
Fama, Eugene F. "Term premiums and default premiums in money markets." Journal of
Fi-nancial Economics 17.1 (1986): 175-196.
Harvey, Campbell R. "The real term structure and consumption growth." Journal of
Finan-cial Economics 22.2 (1988): 305-333.
Hasse, Jean-Baptiste, and Quentin Lajaunie. "EWS: Early Warning System". R package version 0.1.0. (2020) https://cran.r-project.org/web/packages/EWS/
Hwang, Youngjin. "Forecasting recessions with time-varying models." Journal of
Macroeco-nomics 62 (2019): 103153.
Karnizova, Lilia, and Jiaxiong Chris Li. "Economic policy uncertainty, financial markets and probability of US recessions." Economics Letters 125.2 (2014): 261-265.
Kauppi, Heikki, and Pentti Saikkonen. "Predicting US recessions with dynamic binary re-sponse models." The Review of Economics and Statistics 90.4 (2008): 777-791.
Kessel, R. A. "The Cyclical Behavior of the Term Structure of Interest Rates," National
Bu-reau of Economic Research, Occasional Paper No. 91, 1965.
King, Thomas B., Andrew T. Levin, and Roberto Perli. "Financial market perceptions of recession risk." FEDS Working Paper (2007).
Lin, Chang-Ching, and Serena Ng. "Estimation of panel data models with parameter hetero-geneity when group membership is unknown." Journal of Econometric Methods 1.1 (2012): 42-55.
Kilian, Lutz, and Robert J. Vigfusson. "The role of oil price shocks in causing US recessions."
Journal of Money, Credit and Banking 49.8 (2017): 1747-1776.
Menard, Scott. Applied logistic regression analysis. Vol. 106. Sage, 2002.
Moneta, Fabio. "Does the yield spread predict recessions in the Euro area?." International
Finance 8.2 (2005): 263-301.
Newey, Whitney K., and Kenneth D. West. "Hypothesis testing with efficient method of moments estimation." International Economic Review (1987): 777-787.
Newey, Whitney K., and Kenneth D. West. "Automatic lag selection in covariance matrix estimation." The Review of Economic Studies 61.4 (1994): 631-653.
Ng, Eric CY. "Forecasting US recessions with various risk factors and dynamic probit mod-els." Journal of Macroeconomics 34.1 (2012): 112-125.
Ng, Serena, and Jonathan H. Wright. "Facts and challenges from the great recession for fore-casting and macroeconomic modeling." Journal of Economic Literature 51.4 (2013): 1120-54.
Nyberg, Henri. "Dynamic probit models and financial variables in recession forecasting."
Journal of Forecasting 29.1-2 (2010): 215-230.
Ozturk, Huseyin, and Luis Felipe VN Pereira. "Yield curve as a predictor of recessions: Ev-idence from panel data." Emerging Markets Finance and Trade 49.5 (2013): 194-212.
Park, Byeong U., Léopold Simar, and Valentin Zelenyuk. "Forecasting of recessions via dy-namic probit for time series: replication and extension of Kauppi and Saikkonen (2008)."
Empirical Economics (2018): 1-14.
Pesaran, M. Hashem, and Takashi Yamagata. "Testing slope homogeneity in large panels."
Journal of Econometrics 142.1 (2008): 50-93.
Ponka, Harri. "The role of credit in predicting US recessions." Journal of Forecasting 36.5 (2017): 469-482.
R Core Team. "R: A language and environment for statistical computing." R Foundation for Statistical Computing, Vienna, Austria. (2020) https://www.R-project.org/.
Rosenberg, Joshua V., and Samuel Maurer. "Signal or noise? Implications of the term pre-mium for recession forecasting." Federal Reserve Bank of New York-Economic Policy Review 14.1 (2008).
Rudebusch, Glenn D., and John C. Williams. "Forecasting recessions: the puzzle of the enduring power of the yield curve." Journal of Business & Economic Statistics 27.4 (2009): 492-503.
Sensier, Marianne, et al. "Domestic and international influences on business cycle regimes in Europe." International Journal of Forecasting 20.2 (2004): 343-357.
Su, Liangjun, and Qihui Chen. "Testing homogeneity in panel data models with interactive fixed effects." Econometric Theory 29.6 (2013): 1079-1135.
Wheelock, David C., and Mark E. Wohar. "Can the term spread predict output growth and recessions? A survey of the literature." Federal Reserve Bank of St. Louis Review 91.5 Part 1 (2009): 419-440.
Wright, Jonathan H. "The yield curve and predicting recessions." Staff working papers in the Finance and Economics Discussion Series - Federal Reserve Board (2006).
Zhang, Yingying, Huixia Judy Wang, and Zhongyi Zhu. "Quantile-regression-based cluster-ing for panel data." Journal of Econometrics 213.1 (2019): 54-67.