HAL Id: hal-02439699
https://hal.archives-ouvertes.fr/hal-02439699
Submitted on 14 Jan 2020
HAL is a multi-disciplinary open access
archive for the deposit and dissemination of
sci-entific research documents, whether they are
pub-lished or not. The documents may come from
teaching and research institutions in France or
abroad, or from public or private research centers.
L’archive ouverte pluridisciplinaire HAL, est
destinée au dépôt et à la diffusion de documents
scientifiques de niveau recherche, publiés ou non,
émanant des établissements d’enseignement et de
recherche français ou étrangers, des laboratoires
publics ou privés.
Distributed under a Creative Commons Attribution| 4.0 International License
Operational tools to help stakeholders to protect and
alert municipalities facing uncertainties and changes in
karst flash floods.
V. Borrell Estupina, F. Raynaud, N. Bourgeois, L. Kong-A-Siou, L. Collet, E.
Haziza, E. Servat
To cite this version:
V. Borrell Estupina, F. Raynaud, N. Bourgeois, L. Kong-A-Siou, L. Collet, et al.. Operational tools
to help stakeholders to protect and alert municipalities facing uncertainties and changes in karst flash
floods.. Proceedings of the International Association of Hydrological Sciences, Copernicus
Publica-tions, 2015, 370, pp.201-208. �10.5194/piahs-370-201-2015�. �hal-02439699�
Proc. IAHS, 370, 201–208, 2015 proc-iahs.net/370/201/2015/ doi:10.5194/piahs-370-201-2015
© Author(s) 2015. CC Attribution 3.0 License.
Open Access
in
Flood
Risk
and
P
erception
in
Catchments
and
Cities
(HS01
–
IUGG2015)
Operational tools to help stakeholders to protect and
alert municipalities facing uncertainties and changes
in karst flash floods
V. Borrell Estupina1, F. Raynaud1, N. Bourgeois2, L. Kong-A-Siou2, L. Collet1, E. Haziza2, and E. Servat3
1University of Montpellier – HydroSciences Montpellier UMR5569, 2 Place Eugène Bataillon, 34095
Montpellier CEDEX 5, France
2MAYANE, 173 chemin de Fescau, 34980 Montferrier sur Lez, France 3IRD – IM2E, 2 Place Eugène Bataillon, 34095 Montpellier CEDEX 5, France
Correspondence to: V. Borrell Estupina (valerie.borrell@um2.fr)
Received: 2 April 2015 – Accepted: 2 April 2015 – Published: 11 June 2015
Abstract. Flash floods are often responsible for many deaths and involve many material damages. Regard-ing Mediterranean karst aquifers, the complexity of connections, between surface and groundwater, as well as weather non-stationarity patterns, increase difficulties in understanding the basins behaviour and thus warning and protecting people. Furthermore, given the recent changes in land use and extreme rainfall events, knowledge of the past floods is no longer sufficient to manage flood risks. Therefore the worst realistic flood that could occur should be considered.
Physical and processes-based hydrological models are considered among the best ways to forecast floods un-der diverse conditions. However, they rarely match with the stakeholun-ders’ needs. In fact, the forecasting services, the municipalities, and the civil security have difficulties in running and interpreting data-consuming models in real-time, above all if data are uncertain or non-existent. To face these social and technical difficulties and help stakeholders, this study develops two operational tools derived from these models. These tools aim at plan-ning real-time decisions given little, changing, and uncertain information available, which are: (i) a hydrological graphical tool (abacus) to estimate flood peak discharge from the karst past state and the forecasted but uncer-tain intense rainfall; (ii) a GIS-based method (MARE) to estimate the potential flooded pathways and areas, accounting for runoff and karst contributions and considering land use changes. Then, outputs of these tools are confronted to past and recent floods and municipalities observations, and the impacts of uncertainties and changes on planning decisions are discussed. The use of these tools on the recent 2014 events demonstrated their reliability and interest for stakeholders.
This study was realized on French Mediterranean basins, in close collaboration with the Flood Forecasting Services (SPC Med-Ouest, SCHAPI, municipalities).
1 Karst flash floods: badly known, changing and deadly
Extreme rainfall on Mediterranean catchments can lead to flash floods. As these floods are violent and fast, they are difficult to prevent and thus may lead to serious human and material losses.
The French municipalities exposed to these conditions de-veloped regional planning management tools, such as the
PCS (Township Safeguard Plan). Such tools help planning the actions needed to be adopted by the municipal stake-holders of risk management in order to reduce issues ex-posure and to protect people during flash floods. Used in emergency conditions, PCS has to be easy to interpret and exhaustive in its coverage (considering all the possible sit-uations of crisis). However, PCS is limited by the poor hy-drological information it contains. Each flood is a particu-lar one, as runoff is impacted by short-term (previous
rain-202 V. Borrell Estupina et al.: Municipalities facing uncertainties and changes in karst flash floods
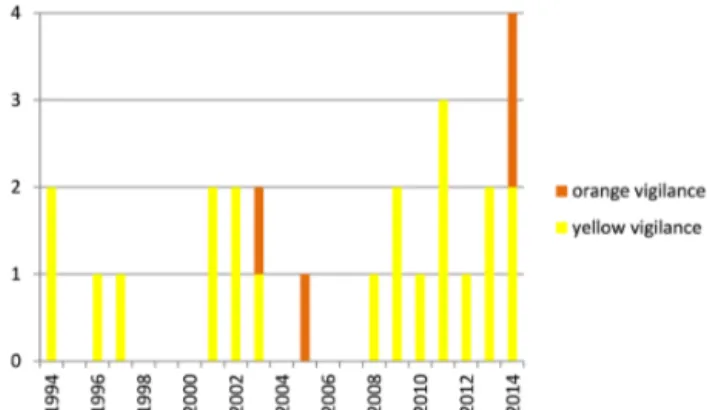
Figure 1.Number of flood events on the Lez catchment between 1994 and 2014. Only the floods responsible for a yellow vigilance level at minimum are registered. No red vigilance level was ob-served during the period.
falls, soil saturation, and rainfall patterns (Obled et al., 1994; Tramblay et al., 2010; Coustau et al., 2012)) or long-term (climate change (Tramblay et al., 2013; Harader, 2015, land use changes)) changes. When these flash floods occur on a Mediterranean karst aquifer, the complex and unknown in-teractions between surface and ground waters (Bailly-Comte et al., 2012) and weather non-stationarity patterns can in-crease the impact of these changes (for example on the Lez karst catchment). Harader et al. (2012), Coustau et al. (2012), Coustau et al. (2013) demonstrated that the surface basin peak discharge was very sensitive to rainfall patterns and pre-vious water content in the reservoir composed by karst and soil. Nowadays, the impacts of this changing information are not included in PCS. This suggests that the development of integrative and adaptive methods to define exhaustive plan-ning management is a key issue for flash flood forecasting and crisis management.
Another difficulty related to karst reservoirs is that we do not know if the apparent increase in frequency of such events is a consequence of climate changes or a bias due to obser-vation short periods. Moreover, the observed extreme peak discharges could be the consequence of climatic or anthro-pogenic changes and the lack of observations could limit our understanding of karst aquifers dynamics (e.g. thresh-olds behaviour never observed before). For example Fig. 1 shows the number of floods on the Lez River catchment ac-cording to their level of vigilance (yellow level: be atten-tive; orange level: be very watchful; red level: an absolute vigilance is imperative) on a 20 year period. In 2014, the four observed flash floods that occurred in a very short time on the same watershed immediately made the general opin-ion believe that climate change was the reason of this high frequency flood events (L’Express 10 October 2014; notre-planete.info 1 December 2014; l’internaute December 2014 for media examples). However, the observed period of time is not long enough to run statistical models. Moreover, re-cent studies cannot assert that climate change is responsible
for these more frequent or more intense events occurring in Southern France (Kisely et al., 2012; Harader, 2015). What-ever the reason for these different changes, knowledge of past floods is no longer sufficient to manage flood risks. In addition, it could be supposed that the worst realistic floods that could occur (in response to recent changes in land use, scenarios of different locations of extreme rainfall events, or karst and soil saturation linked to higher frequency floods) also need to be considered.
Physical and processes-based hydrological models are considered among the best ways to forecast floods under di-verse conditions.
However they usually do not match with the stakeholders’ needs (for the forecasting services, the municipalities and the civil security who need parsimonious and robust tools to sup-ply rapid analyses of the basins hydrological state, and to face numerous data, huge rainfalls uncertainties and poorly gauged basins).
Bailly-Comte et al. (2012) developed a semi-distributed and processes-based hydrological model for floods and flash floods on a karst basin (the Coulazou River, a tributary of the Lez-Mosson River) that can run in re-analysis mode only (and not in real time mode because of its need of afterward calibration). Coustau et al. (2012) proposed a conceptual semi-distributed model to simulate the surface flash floods of the Lez River basin (defined for a minimum value of peak discharge). This model allows real-time simulations and was tested in real-time conditions by Flood Forecasting Services (SPC, SCHAPI).
Nonetheless, to ensure protection of population, SPC needs to manage vigilance before forecasting. Useful tools for this stage need to run with homogeneous rough or-ders of the variables of interest (rough order of cumulative rainfall over a large area during half a day). Physically or processes-based hydrological models are not eligible for this stage. Simple numerical concepts or graphical tools are more adapted (more robust and easier to interpret), but SPC suffers from lack of vigilance tools when the watched-over basins are karstic.
To face these technical difficulties, researchers, municipal-ities, forecasting services, and private companies need to find ways to work together in order to develop robust and easy-to-use tools derived from hydrological knowledge. They also need models that deal with needs and constraints of flash floods real-time and operational management, even for karst catchments (light data availability, changing and uncertain information). This study, developed with researchers, munic-ipalities and forecasters all together, developed two opera-tional tools derived from these models, to help stakeholders planning real-time decisions given little, changing, and un-certain information available:
(i) A GIS-based method (MARE) to estimate the potential flooded pathways and areas, accounting for runoff and karst contributions, considering the changes in land use; (ii) a hy-drological graphical tool (abacus) to estimate the peak
charge of the flood from the past state of the karst and the forecasted but uncertain intense rainfall.
2 The MARE methodology for PCS adaptation to changes
In order to make PCS operational, it is essential to consider the maximum potential hazards threatening the municipality area: from the external roads converging towards the city to the districts which could potentially be submerged by runoff. We suggest in this article to take into account all the potential runoff pathways to improve the operational nature of PCS.
The method developed is a GIS-based generic one. It first computes the potential runoff production areas with soils, karst saturation, and slope properties, based on an adaptation of the IRIP method (Indicateur de l’aléa inondation par Ruis-sellement Intense Pluvial developped by IRSTEA). Then it computes the potential runoff accumulation, based on the la-grangian model of runoff processes (developed in Estupina Borrell PhD (2004) for an operational forecasting rainfall-runoff model, MARINE, used nowadays by SCHAPI). The method is presented in Fig. 2. To satisfy operational con-strains (effective study duration per township, data avail-ability, limited in-situ analysis, cost) only the most sensitive hydrological parameters were included (e.g. the karst state can be fully saturated or fully empty; the little available soil knowledge is not considered).
3 The graphical operational tool for karst flash floods vigilance
3.1 The Lez karstic watershed (Southern France)
To improve our knowledge and thus optimise water resources management of the Mediterranean karstic Lez catchment, the 4-year multiple-use Management Lez project was initiated in 2009 (Borrell Estupina et al., 2014). The Lez spring is the main outlet of a 380 km2karstic system. The Lez River upstream Montpellier drains a hydrological catchment of 114 km2. The watershed is covered with soil (forests or vine-yards) or visible karstic outcrops, with a poor urban cover. The Lez spring is pumped for water supply purposes of the city with an active management. The climatic and hydrologi-cal data from 1994 to 2008 contains 21 floods (> 40 m3s−1). The observed time responses can be very short (2 to 6 h), specific discharges can reach 4 m3s−1km−2, and runoff co-efficient can be greater than 1 (Coustau et al., 2012).
3.2 From the understanding of hydrological behaviour to a flood vigilance operational tool
Analysis of past flood events showed that the total amount of rainfall is used by the hydrosystem to fill up the karst aquifer. On average, 5 mm of rainfall are responsible for a 1 m increase in spring piezometer (Fleury et al., 2015). Then,
above the spring overflow level (65 m a.m.s.l.), rainfall pro-vides surface runoff.
To estimate surface flood response, we used a hydrologi-cal model, based on a modified SCS function, roughly taking into account the role of the karstic system (Coustau et al., 2012). The mean Nash criterion on the 21 calibration events was 0.86. The water deficit of the model reservoir (i.e. the initial condition) was estimated by the level of the spring piezometer a few hours before the beginning of the rainfall. This model was the one used in SPC to forecast floods up-stream the city of Montpellier. Then, we built different rain-fall scenarios based on different accumulations, intensities, and durations. The hydrological model was fed with these rainfall scenarios, for different initial water contents of the karst aquifer. Results were used to build a graphical tool (Borrell Estupina et al., 2014) dedicated to operational karst flood vigilance. It relies on:
– a first step: the hydrogeological behaviour (Fig. 3), which describes the answer of the karst system to a rain-fall;
– a second step: the hydrological behaviour (Fig. 4), which describes the answer of the surface catchment to a rainfall when the karst and the soil are saturated.
4 Results and discussions
4.1 Runoff pathways and accumulation analyses
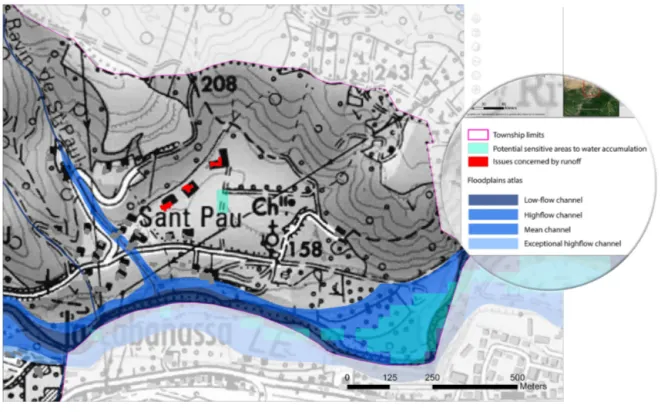
MARE method provided runoff hazard zoning (see Fig. 5). Hazard was evaluated for each pixel. Pixel dimensions were determined by the DEM resolution (here: 10 m by 10 m). On Fig. 5, the “rough output” of the MARE method points out a two pixel hazard zone (in light blue). This map was submitted to municipalities to be confronted to field observations and local authorities’ experiences. This confrontation was pos-sible thanks to the PCS approach, a mandatory approach for threatened municipalities that offered many meetings for dis-cussion and field visits in each municipality.
After this first step, the final map was obtained (see Fig. 6). On this map, the hazard zones including issues correspond to risk zones. These risk zones were identified on the oper-ational map. However, some hazard zones did not include issues and were not included on the operational map as risk zones. These hazard zones could be included in other manda-tory documents like PPRi maps (Flood risk prevention plans) that are used for future urbanization.
In addition, a particular case is illustrated on Figs. 5 and 6. Indeed it can be seen that the runoff accumulation zone identified in Fig. 5 does not correspond to issues. It is thus not properly a risk zone. However the runoff accumulation zone is on the sole road that leads to the three housing sur-rounded in red in Fig. 6. As a consequence these housings are not directly threatened by runoff but an advanced warning is needed.
204 V. Borrell Estupina et al.: Municipalities facing uncertainties and changes in karst flash floods
Figure 2.The MARE methodology. References [2]: Estupina Borrell (2004); [4]: Dehotin and Breil (2011); [6]: Macary et al. (2014); [9]: Verro et al. (2002).
Figure 3. Graphical tool of the piezometric karst level response to different rainfalls (Borrell Estupina et al., 2014). For example, in September 2005, with an initial piezometric level of 46 m a.s.l., the first 95 mm of rainfall filled the karstic system. The piezometric level increased to 65 m a.s.l., which is the threshold for overflow.
Finally the MARE method, directly or indirectly, allows identifying more risk zones. It has been used in operational conditions for municipalities located in southern France deal-ing with intense rainfall (Reynes (66), Saint-André (66) and Mireval (34)). Results were included in the mandatory doc-uments for risk management (PCS) of these municipalities. However it is a very recent method that needs more appli-cations to be refined. It could also be interesting to include other input data when they are available (e.g. soil science, LIDAR. . . ).
4.2 Test of the graphical vigilance tool on the recent flood events of 2014
4.2.1 Real-time vigilance stage:
The graphical tool has been running in SPC in an operational mode since 2014. The 2004–2013 period was used for val-idation in re-analysis and is not discussed here. Four flood events occurred in 2014 on the Lez catchment, reaching
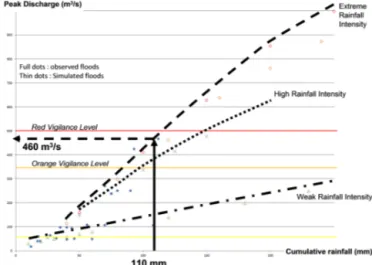
yel-Figure 4.Graphical tool of the peak discharge in response to rain-falls (intensity and amount) (Borrell Estupina et al., 2014). For ex-ample, in September 2005, the next 110 mm of rainfall during the next 3 h contributed to the surface flood. The average rainfall in-tensity of 37 mm h−1was high enough to be considered as extreme. The peak discharge estimated by the graphical tool was 460 m3s−1, to be compared to the measured 467 m3s−1.
low and orange levels of vigilance. When SPC starts its vig-ilance stage, the forecaster collects the current level of the spring piezometer and the meteorological bulletin supplied by Météo France to feed the graphical tools. During this very early stage, the spatio-temporal uncertainty affected on the forecasted cumulated rainfall is very high (for the mean cu-mulative value over half a day and for the whole Hérault de-partment, i.e. about 6000 km2, and maximum local value). However, as the catchment potential response time is 2 h, any data, even uncertain, should be used. Furthermore, the fore-caster can get some qualitative real-time information during this risk stage from other stakeholders. After the flood event, the cumulative rainfall can be known by radar observations above the karst aquifer as well as at other rain gauges.
Figure 5.Extract of the rainwater runoff risk analysis map. Reynes (66).
206 V. Borrell Estupina et al.: Municipalities facing uncertainties and changes in karst flash floods T ab le 1. Meteorological and h ydrological data for the 4 flood ev ents of 2014. mean rainf all abo v e the surf ace of suplly of the karst (mm P ANTHERE) maximum local rainf all abo v e the karst (mm P ANTHERE) cumulati v e rainf all at rain g auge (mm at Prades le Lez) cumulati v e radar rainf all (mm CALAMAR Lirou) maximum range of uncertainty link ed to the spatial heterogeneity of the observ ed rainf all initial le v el in the spring (m a.s.l.) ending le v el in the spring (m a.s.l.) observ ed peak dischar ge (m 3 s− 1 ) ev ent 1 (16 Sep 2014) 202 408 153.5 150 172 % 42.3 67 39.3 ev ent 2 (29 Sep 2014) 135 183 150 197 31 % 65.1 67.3 360 ev ent 3 (6 Oct 2014) 38 180 261 152 72 % 65.6 67.5 496 ev ent 4 (9 Oct 2014) 85 136 28 28* 386 % x x 64 data supplier SPC – MF SPC – MF MF SPC – MF calculation MED YCYSS MED YCYSS SPC
4.2.2 Observations and discussions
Real-time use of these graphical tools led the forecasters to define orange or red levels of vigilance for the 4 last floods, instead of yellow and orange levels. A quasi-systematic over-estimation of the flood risk was done.
The spatial observed heterogeneity of rainfall is defined in this paper by the differences between mean rainfall over a surface (the watershed or the karst supply surface) and lo-cal rainfall (on one point inside these surfaces). It varies be-tween 31 and 381 % according to the selected flood events (Table 1). This is linked to the nature of the Mediterranean extreme rainfalls (and to the various rainfall sensors used, at another level). The real-time forecasted rainfall is only given for a global surface. Hence, this Mediterranean characteris-tic is responsible for a strong uncertainty on the forecasted rainfall used as direct input in these graphical tools.
For the first flood of Table 1, the initial piezometric level was 42.3 m a.m.s.l. According to Fig. 3, a 115 mm rain would produce saturation of the karst. Then, according to Fig. 4, an additional rainfall event:
– under 30 mm would not generate any surface flood, – under 80 mm would generate a yellow vigilance flood, – above 80 mm would generate a yellow or orange
vigi-lance level according to the intensity (unknown during the vigilance stage).
These different values of additional rainfall events are eas-ily included within the uncertainty range of the forecasted rainfall. The forecaster needs to use past observations of meteorological events (radar imagery) to deduce (or guess!) whether the forecasted rainfall would mainly reach the karst supply surface, the watershed, or both to use its graphical tool in an appropriate way.
It appears that the gap between maximum value of the forecasted rainfall (in real time) and the observed radar rain-fall over the watershed (CALAMAR available in re-analysis) varies between 33 to 329 % for 3 out of 4 events (Table 2). Table 2 shows that the forecasted level of vigilance supplied by SPC in real time is generally over-estimated for the 4 studied events. More generally, these high uncertainties (in quantity and location) could lead to false alarm or hazards over-estimation.
The real-time decision could differ from the re-analysis decision. For example, for flood no. 3 a maximum of 60 mm rainfall was expected on a saturated karst. This could not have led to an orange level of vigilance (while it was ob-served). However the real-time evolution of the event and the experience of the forecaster made him forecast an or-ange level. This level was effectively reached because effec-tive rainfall was strongly higher than the forecasted one. All these changing parameters need the forecaster’s experience to be considered.
Table 2.Uncertainty on the forecasted rainfall and flood level of vigilance.
gap between max-imum value of the forecasted rain and radar observed rain over the watershed
forcasted level of vigilance (real time data) maximumn reached level of vigilance (re-analysis) event 1 (16 Sep 2014) 33 % 17 Sep 2014 p.m.
event 2 (29 Sep 2014) 52 % 29 Sep 2014 p.m. event 3 (6 Oct 2014) −61 % 6 Oct 2014 night event 4 (9 Oct 2014) 329 % 9 Oct 2014 p.m.
5 Conclusion: facing with changes and uncertainties in flood risk
By using synthetic and simplified tools derived from hydro-logical models and knowledge, it is possible to estimate the rough order of magnitude of the arising flood or the potential extent of the runoff pathways and accumulation.
On karstic watersheds, discharge at the outlet of the water-shed is controlled by the amount of rainfall, its intensity, and the initial water content of the karst. Recent real-time trans-mission of the karst aquifer piezometric levels considerably reduces the uncertainty on the forecasted discharge.
But in real-time, uncertainties of forecasted rainfall at the beginning of the event (or just before) are very strong and changing. And its intensity is rarely known. These uncertain-ties make the vigilance stage more difficult.
But even though uncertain, these operational tools help re-ducing the durations of intervention of the safeguards and optimizing the flood risk planning management.
The graphical tools, developed in the Lez project for flood forecasting, are currently being tested by the regional flood forecasting service (SPC). Looking at these 4 events, the forecasters evaluated positively these graphical tools, even if they suggested a quasi-systematic over estimation of the forecasted discharge, and thus, sometimes, of the level of vigilance. The hydrological answer of the watershed is too sensitive to rainfall intensity and this data is not (or rarely) available at this very early stage of the event. But an asset of these graphical tools is that they can integrate the karst reservoir initial water content without too many uncertain-ties. This added value helps the forecaster to supply a better expertise in real-time.
These graphical tools are thus useful for flood vigilance, and they were already used to estimate the impact of different pumping scenarios under changing climates on flood genesis (Borrell Estupina et al., 2014).
The suggested improvement of PCS, by taking into ac-count the potential runoff pathways and accumulation zones on different states of saturation of the karst aquifer, allows to quickly extending monitored areas. This tool has been in-cluded in the mandatory documents for risk management of some municipalities in South of France.
Further research should be carried out on the false alarm cases, or in the way to include different patterns of rainfall in the graphical tools for real-time flood forecasting.
Acknowledgements. Authors would particularly thank the fore-casters of the Service des Prévisions des Crues Méditerranée Ouest in Carcassonne for their valuable help, precious expertise and cli-matic and hydrological database supplied in this study. Authors thank the partners and financers of the Lez Multiple Use Man-agement (Montpellier Agglomeration, Regional Water Agency, the Conseil Général de l’Hérault, BRGM, HSM, G-EAU, CERFACS, TETIS, BIOTOPE), and the municipalities of Reynes (66), Saint-André (66) and Mireval (34) for their experience feedback.
References
Bailly-Comte, V., Borrell-Estupina, V., Jourde, H., and Pistre, S.: A conceptual semi distributed model of the Coulazou River as a tool for assessing surface water–karst groundwater interactions during flood in Mediterranean ephemeral rivers, Water Resour. Res., 48, W09534, doi:10.1029/2010WR010072, 2012. Borrell Estupina, V., Ladouche, B., Malaterre, P.-O., Ricci, S.,
Ca-ballero, Y., Coustau, M., Dorfliger, N., Fleury, P., Jay-Allemand, M., Maréchal, J.-C., and Thual, O.: Forecasting and mitigation of flooding in a Mediterranean karstic watershed. Hydrology in a Changing World: Environmental and Human Dimensions Pro-ceedings of FRIEND-Water 2014, Red Book IAHS Publ. 363, 288–294, 2014.
Coustau, M., Bouvier, C., Borrell-Estupina, V., and Jourde, H.: Flood modelling with a distributed event-based parsi-monious rainfall-runoff model: case of the karstic Lez river catchment, Nat. Hazards Earth Syst. Sci., 12, 1119–1133, doi:10.5194/nhess-12-1119-2012, 2012.
Coustau, M., Ricci, S., Borrell-Estupina, V., Bouvier, C., and Thual, O.: Benefits and limitations of data assimilation for discharge forecasting using an event-based rainfall-runoff model, Nat. Haz-ards Earth Syst. Sci., 13, 583–596, doi:10.5194/nhess-13-583-2013, 2013.
Dehotin, J. and Breil, P.: Rapport technique du projet IRIP: Car-tographie de l’aléa inundation par ruissellement, Cemagref-publications, rapport technique, Lyon, p. 76, 2011.
Estupina Borrell, V.: Vers une modélisation hydrologique adaptée à la prévision opérationnelle des crues éclair. Application à de
208 V. Borrell Estupina et al.: Municipalities facing uncertainties and changes in karst flash floods petits bassins versants du Sud de la France, Thèse de Doctorat,
Institut National Polytechnique de Toulouse, p. 253, 2004. Fleury, P., Borrell Estupina, V., Johannet, A., Kong, L., Siou, A.,
Pistre, S., Guinhalmenc, M., Maréchal, J. C., and Dörfliger, N.: Flood part I: Karst contribution to Lez floods, Karstologia, ac-cepted, 2015.
Harader, E.: L’impact du changement climatique sur les événements hydrologiques extrêmes des petits bassins versants méditer-ranéens: le cas des bassins versants du Lez, PhD Thesis, Uni-versity of Toulouse, SDU2E, p. 1998, 2015.
Harader, E., Borrell-Estupina, V., Ricci, S., Coustau, M., Thual, O., Piacentini, A., and Bouvier, C.: Correcting the radar rainfall forc-ing of a hydrological model with data assimilation: application to flood forecasting in the Lez catchment in Southern France, Hy-drol. Earth Syst. Sci., 16, 4247–4264, doi:10.5194/hess-16-4247-2012, 2012.
Kisely, J., Begueria, S., Beranova, R., Gaal, L., and Lopez-Moreno, J. I.: Different patterns of climate change scenarios for short-term and multi-day precipitation extremes in the Mediterranean, Global Planet. Change, 98–99, 63–72, 2012.
Macary, F., Morin, S., Prost, J.-L., and Saudubray, F.: A multi scale method to assess pesticide contamination risk in agricultural wa-tersheds, Ecol. Indicators, 36, 624–639, 2014.
Obled, Ch., Wendling, J., and Beven, K.: The sensitivity of hydro-logical models to spatial rainfall patterns: an evaluation using ob-served data, J. Hydrol., 159, 305–333, 1994.
Tramblay, Y., Bouvier, C., Martin, C., Didon-Lescot, J.-F., Todor-ovik, D., and Domergue, J.-M.: Assessment of initial soil mois-ture conditions for event-based rainfall–runoff modelling, J. Hy-drol., 387, 176–187, 2010.
Tramblay, Y., Amoussou, E., Dorigo, W., and Mahé, G.: Flood risk under future climate in data sparse regions: linking extreme value models and flood generating processes, J. Hydrol., 519, 549–558, 2013.
Verro, R., Calliera, M., Maffioli, G., Auteri, D., Sala, S. Finizio, A., and Vighi, M.: GIS-based system for surface water risk as-sessment of agricultural chemicals. 1. Methodological approach, Environ. Sci. Technol., 36, 1532–1538, 2002.