HAL Id: hal-02024176
https://hal-amu.archives-ouvertes.fr/hal-02024176
Submitted on 28 Oct 2019
HAL is a multi-disciplinary open access
archive for the deposit and dissemination of
sci-entific research documents, whether they are
pub-lished or not. The documents may come from
teaching and research institutions in France or
abroad, or from public or private research centers.
L’archive ouverte pluridisciplinaire HAL, est
destinée au dépôt et à la diffusion de documents
scientifiques de niveau recherche, publiés ou non,
émanant des établissements d’enseignement et de
recherche français ou étrangers, des laboratoires
publics ou privés.
the western tropical South Pacific hotspot of
N<sub>2</sub> fixation (OUTPACE cruise)
Sophie Bonnet, Mathieu Caffin, Hugo Berthelot, Olivier Grosso, Mar
Benavides, Sandra Helias Nunige, Cécile Guieu, Mar Stenegren, Rachel Ann
Foster
To cite this version:
Sophie Bonnet, Mathieu Caffin, Hugo Berthelot, Olivier Grosso, Mar Benavides, et al..
In-depth characterization of diazotroph activity across the western tropical South Pacific hotspot of
N<sub>2</sub> fixation (OUTPACE cruise). Biogeosciences, European Geosciences Union, 2018,
15 (13), pp.4215-4232. �10.5194/bg-15-4215-2018�. �hal-02024176�
https://doi.org/10.5194/bg-15-4215-2018 © Author(s) 2018. This work is distributed under the Creative Commons Attribution 4.0 License.
In-depth characterization of diazotroph activity across the western
tropical South Pacific hotspot of N
2
fixation (OUTPACE cruise)
Sophie Bonnet1,2, Mathieu Caffin2, Hugo Berthelot2,3, Olivier Grosso2, Mar Benavides4, Sandra Helias-Nunige2, Cécile Guieu5,6, Marcus Stenegren7, and Rachel Ann Foster71Aix Marseille Univ., Université de Toulon, CNRS, IRD, MIO UM 110, 13288, Noumea, New Caledonia 2Aix Marseille Univ., Université de Toulon, CNRS, IRD, MIO UM 110, 13288, Marseille, France 3Laboratoire des sciences de l’énvironnement marin, IUEM, Université de Brest-UMR 6539
CNRS/UBO/IRD/Ifremer, Plouzané, France
4Marine Biology Section, Department of Biology, University of Copenhagen, 3000 Helsingør, Denmark
5Sorbonne Universités, UPMC Université Paris 06, CNRS, Laboratoire d’Océanographie de Villefranche (LOV),
06230 Villefranche-sur-Mer, France
6Center for Prototype Climate Modeling, New York University Abu Dhabi, P.O. Box 129188,
Abu Dhabi, United Arab Emirates
7Department of Ecology, Environment, and Plant Sciences, Stockholm University, Stockholm, 10690, Sweden
Correspondence: Sophie Bonnet (sophie.bonnet@univ-amu.fr) Received: 29 December 2017 – Discussion started: 11 January 2018 Revised: 15 May 2018 – Accepted: 4 June 2018 – Published: 12 July 2018
Abstract. Here we report N2fixation rates from a ∼ 4000 km
transect in the western and central tropical South Pa-cific, a particularly undersampled region in the world ocean. Water samples were collected in the euphotic layer along a west to east transect from 160◦E to 160◦W
that covered contrasting trophic regimes, from oligotro-phy in the Melanesian archipelago (MA) waters to ultra-oligotrophy in the South Pacific Gyre (GY) waters. N2
fixation was detected at all 17 sampled stations with an average depth-integrated rate of 631 ± 286 µmol N m−2d−1 (range 196–1153 µmol N m−2d−1) in MA waters and of 85 ± 79 µmol N m−2d−1 (range 18–172 µmol N m−2d−1) in GY waters. Two cyanobacteria, the larger colonial filamen-tous Trichodesmium and the smaller UCYN-B, dominated the enumerated diazotroph community (> 80 %) and gene expression of the nifH gene (cDNA > 105nifHcopies L−1) in MA waters. Single-cell isotopic analyses performed by nanoscale secondary ion mass spectrometry (nanoSIMS) at selected stations revealed that Trichodesmium was always the major contributor to N2fixation in MA waters, accounting
for 47.1–83.8 % of bulk N2fixation. The most plausible
en-vironmental factors explaining such exceptionally high rates of N2fixation in MA waters are discussed in detail,
empha-sizing the role of macro- and micro-nutrient (e.g., iron) avail-ability, seawater temperature and currents.
1 Introduction
In the ocean, nitrogen (N) availability in surface waters con-trols primary production and the export of organic matter (Dugdale and Goering, 1967; Eppley and Peterson, 1979; Moore et al., 2013). The major external source of new N to the surface ocean is biological di-nitrogen (N2) fixation
(100–150 Tg N yr−1, Gruber, 2008), the reduction of atmo-spheric gas (N2) dissolved in seawater into ammonia (NH+3).
The process of N2 fixation is mediated by diazotrophic
or-ganisms that possess the nitrogenase enzyme, which is en-coded by a suite of nif genes. These organisms provide new N to the surface ocean and act as natural fertilizers, contribut-ing to sustaincontribut-ing ocean productivity and eventually carbon (C) sequestration through the N2-primed prokaryotic C pump
(Caffin et al., 2018a; Karl et al., 2003; Karl et al., 2012). This N source is continuously counteracted by N losses, mainly driven by denitrification and anammox, which convert re-duced forms of N (nitrate, NO−3, nitrite NO−2, NH+4) into N2.
Despite the critical importance of the N inventory in regulat-ing primary production and export, the spatial distribution of N gains and losses in the ocean is still poorly resolved.
A global-scale modeling study predicted that the high-est rates of N2 fixation would be located in the South
Pa-cific Ocean (Deutsch et al., 2007; Gruber, 2016). These authors also concluded that processes leading to N gains and losses are spatially coupled to oxygen-deficient zones such as in the eastern tropical South Pacific (ETSP), which harbors NO−3-poor but phosphate-rich surface wa-ters, i.e., potentially ideal niches for N2 fixation (Zehr and
Turner, 2001). However, recent field studies based on sev-eral cruises and independent approaches, including 15N2
incubation-based measurements and geochemical δ15N bud-gets, have consistently measured low N2fixation rates
(av-erage range ∼ 0–60 µmol N m−2d−1) in the surface ETSP waters (Dekaezemacker et al., 2013; Fernández et al., 2011, 2015; Knapp et al., 2016; Loescher et al., 2014). Low activ-ity in the ETSP has been largely attributed to iron (Fe) lim-itation (Bonnet et al., 2017; Dekaezemacker et al., 2013), as Fe is a major component of the nitrogenase enzyme complex required for N2fixation (Raven, 1988). However, the
west-ern tropical South Pacific (WTSP) was recently identified as having high N2 fixation activity (Bonnet et al., 2017), and
collectively these studies plead for a basin-wide spatial de-coupling between N2fixation and denitrification in the South
Pacific Ocean.
The WTSP is a vast oceanic region extending from Aus-tralia in the west to the western boundary of the South Pa-cific Gyre in the east (hereafter referred to as GY waters) (Fig. 1). It has been chronically undersampled (Luo et al., 2012) as compared to the tropical North Atlantic (Bena-vides and Voss, 2015) and North Pacific (e.g., Böttjer et al., 2017) oceans; however, recent oceanographic surveys per-formed in the western part of the WTSP, in the Solomon, Bismarck (Berthelot et al., 2017; Bonnet et al., 2009; Bon-net et al., 2015) and Arafura (Messer et al., 2015; Montoya et al., 2004) seas, report extremely high N2 fixation rates
(> 600 µmol N m−2d−1, i.e., an order of magnitude higher than in the ETSP) throughout the year. In these regions, high N2 fixation has been attributed to sea surface temperatures
>25◦C and continuous nutrient inputs of terrigenous and volcanic origin (Labatut et al., 2014; Radic et al., 2011). The central and eastern parts of the WTSP, a vast oceanic region bordering Melanesian archipelagoes (New Caledonia, Vanu-atu, Fiji) up to the Tonga trench (hereafter referred to as MA waters) have been far less investigated. One study (Shiozaki et al., 2014) reported high surface N2fixation rates close to
the Melanesian islands in relation to nutrients supplied by land runoff. However, the lack of direct N2fixation
measure-ments over the full photic layer impedes accurate N budget estimates in this region. In addition, the reasons for such an ecological success of diazotrophs in the WTSP are still un-der debate (Bonnet et al., 2017) as the horizontal and vertical distribution of environmental parameters potentially
control-ling N2 fixation, in particular measured Fe concentrations,
are still scarce in this region.
Recurrent blooms of the filamentous cyanobacterium Tri-chodesmium, one of the most abundant diazotrophs in our oceans (Luo et al., 2012), have been consistently reported in the WTSP since the James Cook (Cook, 1842) and Charles Darwin expeditions, and later confirmed by satellite observa-tions (Dupouy et al., 2011, 2000) and microscopic enumera-tions (Shiozaki et al., 2014; Tenório et al., 2018). However, molecular studies based on the nifH gene abundances have shown high densities of unicellular diazotrophic cyanobac-teria (UCYN) in the WTSP (Moisander et al., 2010). Three main groups of UCYN (A, B and C) can be distinguished based on nifH gene sequences. In the warm (> 25◦C) waters of the Solomon Sea, UCYN from group B (UCYN-B) co-occur with Trichodesmium at the surface, and together domi-nate the diazotrophic community (Bonnet et al., 2015), while UCYN-C are also occasionally abundant (Berthelot et al., 2017). Further south in the Coral and Tasman seas, UCYN-A dominates the diazotroph community (Bonnet et al., 2015; Moisander et al., 2010). Both studies reported a transi-tion zone from UCYN-B-dominated communities in warm (> 25◦C) surface waters to UCYN-A-dominated communi-ties in colder (< 25◦C) waters of the western part of the WTSP. Further east in the MA waters, Trichodesmium and UCYN-B co-occur and account for the majority of total nifH genes detected (Stenegren et al., 2018). Although molecu-lar methods greatly enhanced our understanding of the bio-geographical distribution of diazotrophs in the WTSP, DNA-based nifH counts do not equate to metabolic activity. Thus, the contribution of each dominant group to bulk N2fixation
is still lacking in the WTSP. Previous studies showed that dif-ferent diazotrophs have difdif-ferent fates in the ocean: some are directly exported, and others release and transfer part of the recently fixed N to the planktonic food web and indirectly fuel export of organic matter (Bonnet et al., 2016a, b; Karl et al., 2012). Consequently assessing the relative contribu-tion of each dominating group of diazotrophs to overall N2
fixation is critical to assess the biogeochemical impact of N2
fixation in the WTSP.
In the present study, we report new bulk and group-specific N2fixation rate measurements from a ∼ 4000 km transect in
the western and central tropical South Pacific. The goals of the study were (i) to quantify both horizontal and vertical dis-tribution of N2fixation rates in the photic layer in relation to
environmental parameters, (ii) to quantify the relative con-tribution of the dominant diazotrophs (Trichodesmium and UCYN-B) to N2 fixation based on cell-specific
measure-ments, and (iii) to assess the potential biogeochemical impact of N2fixation in this region.
Figure 1. (a) Map of the western and central Pacific and associated seas (courtesy T. Wagener and A. De Verneil). (b) Sampling locations superimposed on composite sea surface Chl a concentrations during the OUTPACE cruise (19 February–3 April, quasi-Lagrangian weighted mean Chl a). Short-duration (X) and long-duration (+) stations are indicated. The satellite data are weighted in time by each pixel’s distance from the ship’s average daily position for the entire cruise. The white line shows the vessel route (data from the hull-mounted ADCP positioning system; courtesy A. De Verneil).
2 Methods
Samples were collected during the 45-day OUTPACE (Oliotrophic to UlTra oligotrophic PACific Experiment) cruise (DOI: https://doi.org/10.17600/15000900) onboard the R/V L’Atalante in February–March 2015 (austral sum-mer). The west to east zonal transect along ∼ 19◦S started
in Noumea (New Caledonia) and ended in Papeete (French Polynesia) (Fig. 1). It covered a trophic gradient from oligotrophy (deep chlorophyll maximum (DCM) located at ∼100 m) in MA waters around New Caledonia, Vanuatu, Fiji and Tonga, to ultra-oligotrophy (DCM located at 115–150 m) in GY waters located at the western boundary of the South Pacific Gyre (Moutin et al., 2017, for details on this cruise). Data were collected at 17 stations including 14 short-duration (SD; 8 h) stations (SD1 to SD15; note that SD13 was not sampled) and 3 long-duration (LD; 7 days) stations (LDA, LDB and LDC). Vertical (0–200 m) profiles of temperature, salinity, and chlorophyll fluorescence were obtained at all 17 stations using a Seabird 911 plus CTD (conductivity, tem-perature, depth) equipped with a Wetlabs ECO-AFL/FL flu-orometer. Seawater samples were collected by 12 L Niskin bottles mounted on the CTD rosette.
2.1 Macro-nutrient and dissolved Fe concentration analyses
Samples for the quantification of nitrate (NO−3) and dissolved inorganic phosphorus (DIP) concentrations were collected at 12 depths between 0 and 200 m in acid-washed polyethy-lene bottles, poisoned with mercuric chloride (HgCl2, final concentration 20 mg L−1) and stored at 4◦C until analysis. Concentrations were determined using standard colorimetric techniques (Aminot and Kérouel, 2007) on a Bran Luebbe AA3 autoanalyzer. Detection limits for the procedures were 0.05 µmol L−1for NO−3 and DIP.
Samples for determining dissolved Fe concentrations were collected and analyzed as described in Guieu et al. (2018). Briefly, samples were collected using a Titane rosette mounted with 24 Teflon-coated 12 L GoFlos deployed with a Kevlar cable. Dissolved Fe concentrations were measured by flow injection with online preconcentration and chemilumi-nescence detection according to Bonnet and Guieu (2006). The reliability of the method was monitored by analyzing the D1 SAFe seawater standard (Johnson et al., 2007), and an internal acidified seawater standard was measured daily to monitor the stability of the analysis.
The sampling and analytical methods used to analyze the other parameters reported in the correlation table (Table 2) are described in detail in the methods sections for related
pa-Table 1.15N /14N ratio of suspended particulate nitrogen (PN) (av-erage over the photic layer) across the OUTPACE transect.
Station 15N /14N ratio – PNsusp
no. (‰) MA waters 1 2.00 2 0.78 3 0.57 A – 4 2.71 5 1.57 6 1.91 7 0.50 8 −2.45 9 −2.21 10 −2.70 11 −7.05 12 1.89 B −2.88 Average MA waters −0.41 GY waters C 7.91 14 8.72 15 7.55 Average GY waters 8.06
pers in this issue (Bock et al., 2018; Fumenia et al., 2018; Stenegren et al., 2018; Van Wambeke et al., 2018).
2.2 Bulk N2fixation rate measurements
Whole water (bulk) N2fixation rates were measured in
tripli-cate at all 17 stations using the15N2isotopic tracer technique
(adapted from Montoya et al., 1996). The15N2bubble
tech-nique was intentionally chosen due to the time limitation on making enriched15N2seawater inoculates (e.g., 6–9 depths
=6–9 inoculates) and the larger sample bottles required for making proper estimates of activity in oligotrophic environ-ments. In addition, we aimed to avoid any potential over-estimation due to trace metal and dissolved organic matter (DOM) contaminations often associated with the preparation of the 15N2-enriched seawater (Klawonn et al., 2015;
Wil-son et al., 2012) in our incubation bottles as Fe and DOM have been found to control N2fixation or nifH gene
expres-sion in this region (Benavides et al., 2017; Moisander et al., 2011). However, the15N /14N ratio of the N2pool available
for N2fixation (the term AN2used in Montoya et al., 1996)
was measured in all incubation bottles by membrane inlet mass spectrometry (MIMS) to ensure accurate rate calcula-tions (see below).
Seawater samples were collected from Niskin bottles into 10 % HCl-washed, sample-rinsed (three times) light-transparent polycarbonate (2.3 L) bottles from six depths (75, 50, 20, 10, 1, and 0.1 % surface irradiance levels) at all short-duration stations SD1 to SD15 and nine depths (75, 50, 35, 20, 10, 3, 1, 0.3, and 0.1 % surface irradiance levels) at LD A, LDB and LD C, corresponding to the sub-surface (5 m) down to 80 to 180 m, depending on the station. Bottles were sealed with caps fitted with silicon septa and amended with 2 mL of 98.9 at. %15N2(Cambridge isotopes). The purity of
the15N2Cambridge isotope stocks was previously checked
by Dabundo et al. (2014) and more recently by Benavides et al. (2015) and Bonnet et al. (2016a). They were found to be lower than 2 × 10⁻⁸mol : mol of 15N2, leading to a
po-tential N2fixation rate overestimation of < 1 %. Each bottle
was shaken 20 times to break the15N2bubble and facilitate
its dissolution, and was incubated for 24 h. At SD stations, bottles were incubated in on-deck incubators connected to surface circulating seawater at the specified irradiances us-ing blue screenus-ing as the duration of the station (8 h) was too short to deploy in situ mooring lines. At LD stations (7 days), one profile was incubated following the same methodology in on-deck incubators and another replicate profile was incu-bated in situ for comparison on a drifting mooring line lo-cated at the same depth from which the samples were col-lected. Incubations were stopped by filtering the entire incu-bation bottle onto pre-combusted (450◦C, 4 h) 25 mm diam-eter glass fiber filters (GF/F, Whatman, 0.7 µm nominal pore size). Filters were subsequently dried at 60◦C for 24 h before analysis of15N /14N ratios and particulate N (PN) determi-nations using an elemental analyzer coupled to a mass spec-trometer (EA-IRMS, Integra CN, SerCon Ltd) as described in Bonnet et al. (2011).
To ensure accurate rate calculations, the15N /14N ratio of the N2pool in the incubation bottles was measured on each
profile from triplicate surface incubation bottles from SD1 to SD14 and at all depths at SD15 and LD stations. Briefly, 12 mL was subsampled after incubation into Exetainers fixed with HgCl2 (final concentration 20 mg L−1) that were pre-served upside down in the dark at 4◦C until analyzed us-ing a MIMS accordus-ing to Kana et al. (1994). Lastly, we col-lected time zero samples at each station to determine the nat-ural N isotopic signature of ambient particulate N (PN). The minimum quantifiable rates (quantification limit, QL) calcu-lated using standard propagation of errors via the observed variability between replicate samples measured according to Gradoville et al. (2017) were 0.035 nmol N L−1d−1.
Discrete N2 fixation rate measurements were depth
inte-grated over the photic layer using trapezoidal integration pro-cedures. Briefly, the N2fixation at each pair of depths is
aver-aged, and then multiplied by the difference between the two depths to get a total N2fixation in that depth interval. These
depth interval values are then summed over the entire depth range to get the integrated N2fixation rate. The rate nearest
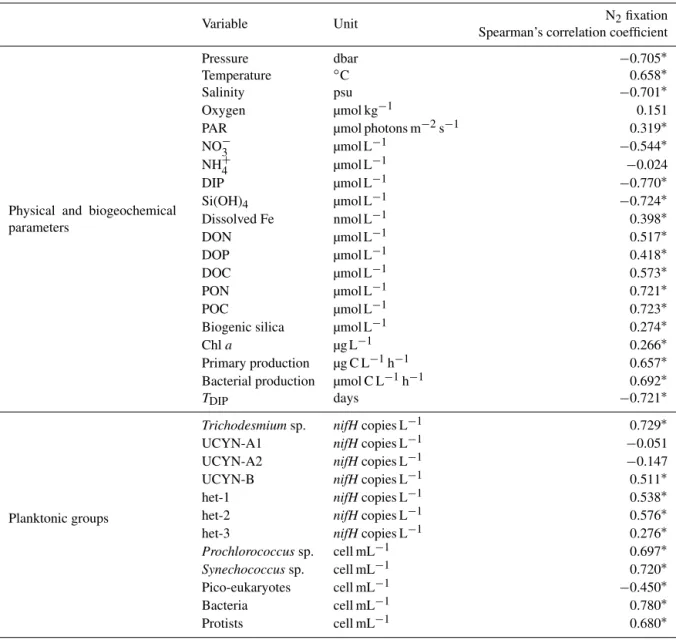
Table 2. Summary of relationships between measured N2fixation rates and various physical and biogeochemical parameters. Also shown are correlations between measured rates and the several diazotrophic or non-diazotrophic planktonic groups enumerated at the respective stations. The corresponding unit is given for each parameter, and Spearman’s rank correlation (n = 102, α = 0.05) is provided; significant correlations (p < 0.05) are indicated by an asterisk (∗).
Variable Unit N2fixation
Spearman’s correlation coefficient
Physical and biogeochemical parameters
Pressure dbar −0.705∗
Temperature ◦C 0.658∗
Salinity psu −0.701∗
Oxygen µmol kg−1 0.151
PAR µmol photons m−2s−1 0.319∗
NO−3 µmol L−1 −0.544∗ NH+4 µmol L−1 −0.024 DIP µmol L−1 −0.770∗ Si(OH)4 µmol L−1 −0.724∗ Dissolved Fe nmol L−1 0.398∗ DON µmol L−1 0.517∗ DOP µmol L−1 0.418∗ DOC µmol L−1 0.573∗ PON µmol L−1 0.721∗ POC µmol L−1 0.723∗
Biogenic silica µmol L−1 0.274∗
Chl a µg L−1 0.266∗
Primary production µg C L−1h−1 0.657∗ Bacterial production µmol C L−1h−1 0.692∗
TDIP days −0.721∗
Planktonic groups
Trichodesmiumsp. nifHcopies L−1 0.729∗
UCYN-A1 nifHcopies L−1 −0.051
UCYN-A2 nifHcopies L−1 −0.147
UCYN-B nifHcopies L−1 0.511∗
het-1 nifHcopies L−1 0.538∗
het-2 nifHcopies L−1 0.576∗
het-3 nifHcopies L−1 0.276∗
Prochlorococcussp. cell mL−1 0.697∗ Synechococcussp. cell mL−1 0.720∗ Pico-eukaryotes cell mL−1 −0.450∗
Bacteria cell mL−1 0.780∗
Protists cell mL−1 0.680∗
the surface is assumed to be constant up to 0 m (Knap et al., 1996).
2.3 Statistical analyses
Spearman’s rank correlation was used to examine the poten-tial relationships between N2 fixation rates and
hydrolog-ical, biogeochemhydrolog-ical, and biological parameters across the longitudinal transect (n = 102, α = 0.05). A non-parametric Mann–Whitney test (α = 0.05) was used to compare the MIMS data obtained following on-deck versus in situ incu-bations, and to compare nutrient and Chl a distributions be-tween the western part and the eastern part of the transect.
2.4 Group-specific N2fixation rate measurements
2.4.1 Experimental procedures
At three stations along the transect (SD2, SD6, LDB), where Trichodesmiumand UCYN-B accounted for > 90 % of the total diazotrophic community (see below and Stenegren et al., 2018), eight additional polycarbonate (2.3 L) bottles were collected from the surface (50 % light irradiance) to determine Trichodesmium and UCYN-B-specific N2fixation
rates by nanoSIMS and quantify their contribution to bulk N2fixation. Two of these bottles were amended with15N2as
described above for further nanoSIMS analyses on individual cells (the six remaining bottles were used for DNA and RNA
analyses; see below) and were incubated for 24 h with the in-cubation bottles dedicated to bulk N2fixation measurements
in on-deck incubators as described above. To recover large-size diazotrophs (Trichodesmium) after incubation, 1.5 L was filtered on 10 µm pore size 25 mm diameter polycarbonate filters. The cells were fixed with paraformaldehyde (PFA) (2 % final concentration) for 1 h at ambient temperature (∼ 25◦C) and the filters were then stored at −20◦C un-til nanoSIMS analyses. To recover small-size diazotrophs (UCYN-B), samples were collected for further cell sorting by flow cytometry prior to nanoSIMS; 1 L of the remaining15N2
labelled bottle was filtered onto 0.2 µm pore size 47 mm polycarbonate filters. Filters were quickly placed in a 5 mL cryotube filled with 0.2 µm filtered seawater with PFA (2 % final concentration) for 1 h at room temperature in the dark. The cryovials were vortexed for 10 s to detach the cells from the filter (Thompson et al., 2012) and stored at −80◦C
un-til cell sorting. Cell sorting of UCYN-B was performed on a Becton Dickinson Influx Mariner (BD Biosciences, Franklin Lakes, NJ) high-speed cell sorter of the Regional Flow Cy-tometry Platform for Microbiology (PRECYM), hosted by the Mediterranean Institute of Oceanography, as described in Bonnet et al. (2016a) and Berthelot et al. (2016). After sort-ing, the cells were dropped onto a 0.2 µm pore size polycar-bonate 13 mm diameter polycarpolycar-bonate filter connected to a low-pressure vacuum pump, and then stored at −80◦C until nanoSIMS analyses. Special care was taken to drop the cells on a surface as small as possible (∼ 5 mm in diameter) to en-sure the highest cell density possible to facilitate subsequent nanoSIMS analyses.
2.4.2 Abundance of diazotrophs by microscopy and qPCR methods
The abundance of Trichodesmium filaments and the average number of cells per filament were determined microscopi-cally: 1 to 2.2 L was filtered on 2 µm polycarbonate filters. The cells were fixed with PFA prepared with filtered sea-water (2 % final concentration) for 1 h at 4◦C and stored at −20◦C until counting using an epifluorescence microscope (Zeiss Axioplan, Jena, Germany) fitted with a green (510– 560 nm) excitation filter. The whole filter was counted and the number of cells per trichome were counted on at least 10 filaments per station.
Four other diazotrophic phylotypes were quantified us-ing quantitative PCR (qPCR) as they were not easily quan-tifiable by standard epifluorescence microscopy: UCYN-A1, UCYN-B and two heterocystous symbionts of diatom– diazotroph associations (DDAs): Richelia intracellularis as-sociated with Rhizosolenia spp. (het-1) and R. intracellu-larisassociated with Hemiaulus spp. (het-2). Triplicate 2.3 L bottles were filtered onto 25 mm diameter 0.2 µm Supor fil-ters with a 0.2 µm pore size at each station using a peri-staltic pump. The DNA extraction and TaqMAN qPCR as-says are fully described in Stenegren et al. (2018). To
quan-tify nifH gene expression, additional triplicate 2.3 L bottles were filtered as described above. The filters were placed into pre-sterilized bead-beater tubes (Biospec Products Inc., Bartlesville, OK, USA) containing a 250 µL Lysis buffer (Qi-agen RNeasy) amended with 1 % β-mercaptoethanol and 30 µL of 0.1 mm glass beads (Biospec Products Inc.). The time of filtering for RNA varied between stations (17:00– 21:00). Filters were flash frozen in liquid nitrogen and stored at −80◦C until RNA extraction. The RNA extraction and re-verse transcription (RT) were performed as previously de-scribed using a Super-Script III first-strand cDNA synthe-sis kit (Invitrogen Corp., Carlsbad, CA, USA) including the appropriate negative controls (water and No-RT) (Fos-ter et al., 2010). The nifH gene expression for het-1, het-2, Trichodesmium, UCYN-A1, and UCYN-B was as described previously (Foster et al., 2010).
2.4.3 nanoSIMS analyses, data processing and group-specific rate calculations
NanoSIMS analyses were performed using an N50 nanoSIMS instrument (Cameca, Gennevilliers, France) at the French National Ion MicroProbe Facility according to Bon-net et al. (2016a, b) and Berthelot et al. (2016). Briefly, a ∼ 1.3 pA cesium (16 KeV) primary beam focused onto a ∼100 nm spot diameter was scanned across a 256 × 256 or 512 × 512 pixel raster (depending on the image size) with a counting time of 1 ms per pixel. Samples were pre-sputtered prior to analyses with a current of ∼ 10 pA for at least 2 min to achieve sputtering equilibrium and ensure a consistent im-plantation and analysis of the cell interior by removing the cell surface. Negative secondary ions (12C14N−,12C15N−)
were collected by electron multiplier detectors, and sec-ondary electrons were also imaged simultaneously. A total of 10–50 serial quantitative secondary ion images were gen-erated that were combined to create the final image. Mass resolving power was ∼ 8000 in order to resolve isobaric in-terferences; 20 to 100 planes were generated for each cell an-alyzed. NanoSIMS runs are time-intensive and not designed for routine analysis, but a minimum of 250 cells of UCYN-B per station and 30 Trichodesmium filament portions were an-alyzed to take into account the variability of activity among the population.
Data were processed using the LIMAGE software. Briefly, all scans were corrected for any drift of the beam and sam-ple stage during acquisition. Isotope ratio images were cre-ated by adding the secondary ion counts for each recorded secondary ion for each pixel over all recorded planes and di-viding the total counts by the total counts of a selected refer-ence mass. Individual Trichodesmium filaments and UCYN-B cells were easily identified on nanoSIMS images that were used to define regions of interest (ROIs). For each ROI, the
15N /14N ratio was calculated.
Trichodesmiumand UCYN-B cellular biovolume was cal-culated from cell-diameter measurements performed on ∼ 50
cells or trichomes per station using an epifluorescence mi-croscope (Zeiss Axioplan, Jena, Germany) fitted with a green (510–560 nm) excitation filter. UCYN-B had a spher-ical shape and Trichodesmium cells were assumed to have a cylindrical shape. The carbon content per cell was esti-mated from the biovolume according to Verity et al. (1992) and the N content was calculated based on C : N ratios of 6 for Trichodesmium (Carpenter et al., 2004) and 5 for UCYN-B (Dekaezemacker and UCYN-Bonnet, 2011; Knapp et al., 2012).
15N assimilation rates were expressed “per cell” and
cal-culated as follows (Foster et al., 2011, 2013): assimilation (mol N cell−1d−1) = (15Nex×Ncon)/ Nsr, where15Nexis the
excess 15N enrichment of the individual cells measured by nanoSIMS after 24 h of incubation relative to the time zero value, Ncon is the N content of each cell determined as
described above, and Nsr is the excess 15N enrichment of
the source pool (N2) in the experimental bottles determined
by MIMS (see above). Standard deviations were calculated using the variability of N isotopic signatures measured by nanoSIMS on replicate cells. The relative contribution of Tri-chodesmiumand UCYN-B to bulk N2fixation was calculated
by multiplying cell-specific N assimilation by the cell abun-dance of each group, relative to bulk N2fixation determined
at the same time.
3 Results
3.1 Environmental conditions
Seawater temperature ranged from 21.4 to 30.0◦C in the sampled photic layer (0 to ∼ 80–180 m) over the cruise tran-sect (Fig. 2a). The mixed layer depth (MLD) calculated according to the de Boyer Montégut et al. (2004) method was located around 20–40 m throughout the zonal transect: maximum temperatures were measured in the surface mixed layer (∼ 0–20/40 m) and remained almost constant along the longitudinal transect with 29.1 ± 0.3◦C in MA waters and 29.5 ± 0.4◦C in GY waters.
Based on other hydrographic measurements (dissolved nu-trients, dissolved Fe and Chl a concentrations), the longi-tudinal transect was divided into two sub-regions: (1) the MA region from station SD1 (160◦E) to LDB (165◦W), and (2) the GY sub-region from station LDB (165◦W) to SD15 (160◦W). Chl a concentration in the upper 50 m was signifi-cantly (p < 0.05) higher in MA waters (0.17 µg L−1on aver-age) than in GY waters (0.06 µg L−1on average) (Figs. 1 and 2b). The DCM was located around 80–100 m in MA waters and deepened to ∼ 150 m in GY waters, indicating higher oligotrophy in the GY region. Surface NO−3 concentrations (Fig. 2c) were consistently close to or below the detection limit (0.05 µmol L−1) in the upper water column (0–50 m) throughout the transect and the depth of the nitracline grad-ually deepened from ∼ 75–100 m in MA waters to ∼ 115 m in GY waters. DIP concentrations were slightly higher than
or close to detection limits (0.05 µmol L−1) in MA surface waters (0–50 m), and the phosphacline was shallower (20– 45 m) than the nitracline and DIP concentrations increased significantly (p < 0.05) in GY waters and ranged from 0.13 to 0.17 µmol L−1(Fig. 2d).
3.2 N isotopic signature of the N2pool after incubation
The 15N enrichment of the N2 pool after 24 h of
incuba-tion with the15N2tracer was on average 6.145 ± 0.798 at. %
(n = 54) in bottles incubated in on-deck incubators and sig-nificantly higher (p < 0.05) in bottles incubated on the moor-ing line (7.548 ± 0.557 at. % (n = 44), Fig. 3a). However, the depth of incubation on the mooring line (between 5 and 180 m) did not have any significant effect (p > 0.05) on the isotopic signature of the N2 pool at LDB and LDC, which
remained constant over the water column (Fig. 3b). 3.3 Natural isotopic signature of suspended particles
and N2fixation rates
The natural N isotopic signature of suspended particles mea-sured over the photic layer was on average −0.41 ‰ in MA waters and 8.06 ‰ in GY waters (Table 1). Those isotopic values were used as time zero samples to calculate N2
fixa-tion rates.
N2 fixation was detected at all 17 sampled stations and
the average measured N2 fixation rates in the two
previ-ously defined sub-regions were (1) 8.9 ± 10 nmol N L−1d−1 (range QL-48 nmol N L−1d−1) over the photic layer in MA waters, and 2) 0.5 ± 0.6 nmol N L−1d−1 (range QL-4.0 nmol N L−1d−1) in GY waters (Fig. 2e). In MA waters, N2 fixation was largely restricted to the mixed layer, where
average rates were 15 nmol N L−1d−1, with local maxima (> 20 nmol N L−1d−1) at stations SD1, SD6 and LDB and local minima (< 5 nmol N L−1d−1) at SD8 and SD10. In GY waters, maximum rates reached 1–2 nmol N L−1d−1and were located deeper in the water column (∼ 50 m). When integrated over the photic layer, N2 fixation represented
an average net N addition of 631 ± 286 µmol N m−2d−1 (range 196–1153 µmol N m−2d−1) in MA waters and of 85 ± 79 µmol N m−2d−1 (range 18–172 µmol N m−2d−1) in GY waters.
N2 fixation rates were significantly positively correlated
with seawater temperature and photosynthetically active ra-diation (PAR) (p < 0.05), significantly negatively correlated with depth and salinity (p < 0.05) and not significantly cor-related with dissolved oxygen concentrations (p > 0.05) (Ta-ble 2). N2fixation rates were significantly positively
corre-lated with dissolved Fe, dissolved organic N (DON), phos-phorus (DOP), carbon (DOC), particulate organic N (PON), particulate organic carbon (POC), biogenic silica (BSi), Chl a concentrations, and primary and bacterial production (p < 0.05), and significantly negatively correlated with con-centration of dissolved nutrients: NO−3, NH+4, DIP and
sil-Figure 2. Horizontal and vertical distributions of (a) seawater temperature (◦C), (b) chlorophyll fluorescence (µg L−1), (c) NO−3 (µmol L−1), (d) DIP (µmol L−1) and (e) N2fixation rates (nmol N L−1d−1) across the OUTPACE transect. LD stations are noted and the extent of the two defined sub-regions: MA: Melanesian archipelago waters, GY: South Pacific Gyre waters. Y axis: pressure (dbar), X axis: longitude; black dots correspond to sampling depths at the various SD and LD stations.
icate (p < 0.05). N2 fixation rates were significantly
posi-tively correlated with nifH abundances for Trichodesmium spp., UCYN-B and the symbionts of DDAs (het-1, het-2) (p < 0.05) and not significantly correlated with UCYN-A1 and UCYN-A2 abundances (p > 0.05) (Table 2). Regard-ing non-diazotrophic plankton, N2 fixation rates were
sig-nificantly positively correlated with Prochlorococcus spp., Synechococcusspp., heterotrophic bacteria and protist abun-dances (p < 0.05) and significantly negatively correlated with picoeukaryotes (p < 0.05).
3.4 Contribution of Trichodesmium and UCYN-B to N2
fixation and nitrogenase gene expression
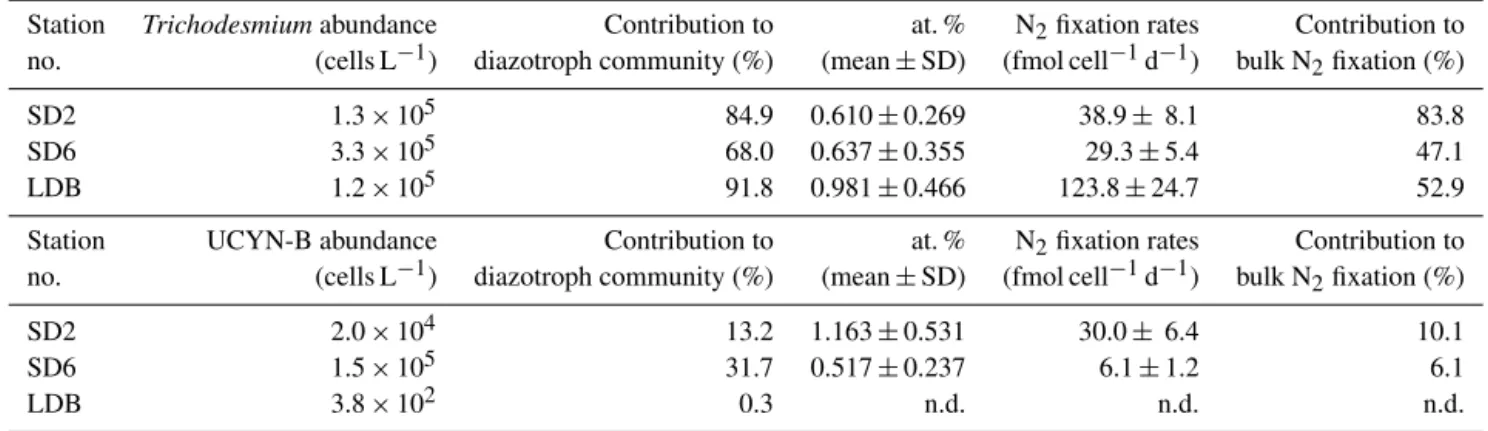
At the three stations where cell-specific N2 fixation rates
were estimated by nanoSIMS (SD2, SD6 and LDB), the most abundant diazotroph phylotype was Trichodesmium with 1.3 × 10⁵, 3.3 × 10⁵ and 1.2 × 10⁵cells L−1, respectively, followed by UCYN-B, whose abundances were 2.0 × 10⁴, 1.5 × 10⁵and 3.8 × 10²nifHcopies L−1, respectively. Het-1 and het-2 combined were 1 to 2 orders of magnitude lower, ranging from 1.0 to 9.9 × 10³nifHcopies L−1, and
UCYN-Figure 3. (a) The average measured15N /14N ratio of the N2pool in the incubation bottles incubated either in on-deck incubators (n = 54) or in situ (mooring line) (n = 44). The dashed lines rep-resent the theoretical value (∼ 8.2 at. %) calculated assuming com-plete isotopic equilibration between the gas bubble and the seawater based on gas constants. Error bars represent the standard deviation (b) depth profiles of the15N /14N ratio of the N2pool in the in-cubation bottles incubated either in on-deck incubators (filled sym-bols) or on an in situ mooring line (open symsym-bols).
A1 were below detection at the three stations. In summary, Trichodesmiumand UCYN-B accounted for 98.2, 99.8 and 92.1 % of the total diazotroph community (based on the phy-lotypes targeted here) at SD2, SD6 and LDB, respectively (Table 3).
The 15N /14N ratios of individual cells/trichomes of UCYN-B and Trichodesmium were measured via nanoSIMS analyses and used to estimate single-cell N2 fixation rates.
A summary of the enrichment values and cell-specific N2 fixation is provided in Table 3. Individual trichomes
exhibited significant 15N enrichments (0.610 ± 0.269, 0.637 ± 0.355 and 0.981 ± 0.466 at. % at stations SD2, SD6 and LDB, respectively) compared with time zero samples (0.369 ± 0.002 at. %). UCYN-B were also significantly15 N-enriched, with 1.163 ± 0.531 and 0.517 ± 0.237 at. % at SD2 and SD6, respectively (note that no UCYN-B could be sorted and analyzed by nanoSIMS at LDB as they accounted for only 0.3 % of the diazotroph community). Cell-specific N2
fixation rates of Trichodesmium were 38.9 ± 8.1, 29.3 ± 5.4 and 123.8 ± 24.8 fmol N cell−1d−1 at SD2, SD6 and LDB. Cell-specific N2 fixation of UCYN-B was 30.0 ± 6.4 and
6.1 ± 1.2 fmol N cell−1d−1 at SD1 and SD6. The contribu-tion of Trichodesmium to bulk N2fixation was 83.8, 47.1 and
52.9 % at stations SD2, SD6 and LDB, respectively. The con-tribution of UCYN-B was 10.1 and 6.1 % at SD2 and SD6, respectively (Table 3).
The in situ nifH expression for all diazotroph groups tar-geted by qPCR was estimated using a TaqMAN quantitative reverse transcription PCR (RT-qPCR) (Table 4). The sam-pling and filtering time (17:00–21:00 h) was not optimal for quantifying the nifH gene expression for all diazotrophs; however, it provides useful information about which dia-zotrophs were potentially active during the experiment and complements the nanoSIMS analysis which measures the in situ activity. Both Trichodesmium and UCYN-B dominated the biomass (Stenegren et al., 2018), as did their nifH gene expression at all three stations, especially SD2 and SD6. Of the two DDAs, het-1 had a higher nifH gene expression, which was consistent with its higher nifH abundance by DNA qPCR (Stenegren et al., 2018). UCYN-A1 was consistently below detection for the nifH gene expression and was also the least detected diazotroph by nifH qPCR (Stenegren et al., 2018).
4 Discussion
4.1 Methodological considerations: the importance of measuring the15N /14N ratio of the N2pool
Our understanding of the marine N cycle relies on accurate estimates of N fluxes to and from the ocean. Here we de-cided to use the “bubble addition method” to minimize po-tential trace metal and organic matter contaminations, which may have resulted in overestimating rates (Klawonn et al.,
Table 3. Summary of diazotroph abundances and nanoSIMS analyses at SD2, SD6 and LDB.
Station Trichodesmiumabundance Contribution to at. % N2fixation rates Contribution to no. (cells L−1) diazotroph community (%) (mean ± SD) (fmol cell−1d−1) bulk N2fixation (%)
SD2 1.3 × 10⁵ 84.9 0.610 ± 0.269 38.9 ± 8.1 83.8
SD6 3.3 × 10⁵ 68.0 0.637 ± 0.355 29.3 ± 5.4 47.1
LDB 1.2 × 10⁵ 91.8 0.981 ± 0.466 123.8 ± 24.7 52.9 Station UCYN-B abundance Contribution to at. % N2fixation rates Contribution to no. (cells L−1) diazotroph community (%) (mean ± SD) (fmol cell−1d−1) bulk N2fixation (%)
SD2 2.0 × 10⁴ 13.2 1.163 ± 0.531 30.0 ± 6.4 10.1
SD6 1.5 × 10⁵ 31.7 0.517 ± 0.237 6.1 ± 1.2 6.1
LDB 3.8 × 10² 0.3 n.d. n.d. n.d.
Table 4. Summary of nifH gene expression data determined by qRT-PCR at selected stations (SD2, SD6, LDB), where the cell-specific N2 fixation rates were measured.
Diazotroph
Station SD2 Station SD6 Station LDB cDNAnifH cDNAnifH cDNAnifH (gene copies L−1) (gene copies L−1) (gene copies L−1) Trichodesmium 1.1 × 10⁵ 5.1 × 10⁵ 5.78 × 10⁴ UCYN-B 1.9 × 10⁵ 1.5 × 10⁵ 1.03 × 10² het-1 6.83 × 10² 1.56 × 10³ 2.04 × 10² het-2 5.44 × 10² 2.14 × 10² bd
UCYN-A1 bd bd bd
2015). Moreover, a recent extensive meta-analysis (13 stud-ies, 368 observations) between bubble and enriched amend-ment experiamend-ments to measure15N2rates reported that
under-estimation of N2fixation is negligible in experiments that last
12–24 h (e.g., error is −0.2 %); hence our 24 h based exper-iments should be within a small amount of error (Wannicke et al., 2018). However, we paid careful attention to accurately measure the term AN2to avoid any potential underestimation
and reveal that the way bottles are incubated (on-deck versus in situ) has a great influence on the AN2value, and thus on
N2fixation rates.
Our MIMS results measured a significantly (p < 0.05) lower15N enrichment of the N2 pool (6.145 ± 0.798 at. %)
when bottles were incubated in on-deck incubators com-pared to when bottles were incubated on the mooring line (7.548 ± 0.557 at. %). This suggests that the15N2dissolution
is much more efficient when bottles are incubated in situ, probably due to the higher pressure in seawater at the depth of incubation (1.5 to 19 bars between 5 and 180 m) com-pared to the pressure in the on-deck incubators (1 bar). The seawater temperature checked regularly in the on-deck in-cubators was equivalent to ambient surface temperature and likely did not explain the differences observed. This result highlights the need to perform routine MIMS measurements to use the most accurate AN2value for rate calculations,
in-dependently of the 15N2 approach used (gas or dissolved).
In our study, the theoretical AN2 value based on gas
con-stant calculations (Weiss, 1970) was ∼ 8.2 at. %, so the de-viation from this value is more important when bottles are incubated in on-deck incubators as compared to when they are incubated in situ. This suggests that the use of the bub-ble addition method without MIMS measurement potentially leads to higher underestimations when bottles are incubated in on-deck incubators, which is the case in the great major-ity of marine N2fixation studies published so far (Luo et al.,
2012). We are aware that the dissolution kinetics of15N2in
the incubation bottles may have been progressive along the 24 h of incubation (Mohr et al., 2010); therefore, the N2
fix-ation rates provided here represent conservative values. Despite the AN2 value being different according to the
incubation mode, it did not change with the depth of incu-bation on the mooring line, indicating that a slightly higher pressure than atmospheric pressure (1.5 bar at 5 m depth) is enough to promote the15N2dissolution. It also indicates that
the slightly lower seawater temperature (22–24◦C) recorded at ∼ 100–180 m where the deepest samples were incubated likely did not affect the solubilization of the15N2gas. In our
study, the vertical profiles performed at LD stations and in-cubated either on-deck in triplicate or in situ in triplicate re-veal identical (p > 0.05) N2 fixation rates regardless of the
incubation method used (Caffin et al., 2018b). This indicates that in situ incubations and on-deck incubations that simu-late appropriate light levels are a valid methodology for15N2
lines cannot be deployed, as long as routine measurements of the isotopic ratio of the N2pool are performed in incubation
bottles.
4.2 Drivers of high N2fixation rates in the WTSP?
N2 fixation rates measured in MA waters (average
631 ± 286 µmol N m−2d−1) are 3 to 4 times higher than model predictions for this area (150–200 µmol N m−2d−1, Gruber, 2016). They are in the upper range of the higher cat-egory (100–1000 µmol N m−2d−1) of rates defined by Luo et al. (2012) in the N2fixation MAREDAT database for the
global ocean and thus identify the WTSP as an area for high N2 fixation in the global ocean. Recent studies performed
in the western part of the WTSP, i.e., in the Solomon, Bis-marck (Berthelot et al., 2017; Bonnet et al., 2009; Bon-net et al., 2015) and Arafura (Messer et al., 2015; Mon-toya et al., 2004) seas, also reveal extremely high rates (> 600 µmol N m−2d−1), indicating that this high N2
fix-ation activity area extends geographically west–east from Australia to Tonga and north–south from the Equator to 25–30◦S, covering a vast ocean area of ∼ 13 × 106 km2 (i.e., ∼ 20 % of the South Pacific Ocean area). However, the driver(s) for diazotrophy in this region is(are) still poorly re-solved and raise(s) the question of which factors influence the distribution and activity of N2fixation in the ocean. In a
global-scale study conducted by Luo et al. (2014), which in-vestigated the correlations between N2fixation and a variety
of environmental parameters commonly accepted to control this process, they concluded that SST (or surface solar radia-tion) was the best predictor to explain the spatial distribution of N2fixation in the surface ocean. Below we highlight the
most plausible factors explaining such high N2fixation rates
in our study area.
Seawater temperature.Seawater temperature was unlikely to be the factor explaining the differences in N2fixation rates
observed between MA and GY waters, as it was consistently high (> 28◦C in the surface mixed layer) and optimal for the growth and nitrogenase activity of most diazotrophs (Breit-barth et al., 2007; Nübel et al., 1997) all along the cruise tran-sect. This indicates that other factors such as nutrient avail-ability may explain the distribution of N2fixation.
DIP availability.The ∼ 4000 km transect was divided into two main sub-regions: (1) the MA waters, harboring typical oligotrophic conditions with surface NO−3 and DIP concen-trations close to detection limits (0.05 µmol L−1), a nitracline located at 75–100 m, moderate surface Chl a concentrations (∼ 0.17 µg L−1), a DCM located at ∼ 80–100 m and very high N2 fixation rates (631 ± 286 µmol N m−2d−1 on
aver-age), and (2) the GY waters harboring ultra-oligotrophic con-ditions with undetectable NO−3, a deeper nitracline (115 m), and comparatively high DIP concentrations (0.15 µmol L−1), very low Chl a concentrations (0.06 µg L−1, DCM ∼ 150 m) and low N2fixation rates (85 ± 79 µmol N m−2d−1).
In the NO−3-depleted MA waters, low DIP concentrations are indicative of the consumption of DIP by the planktonic community, including diazotrophs. This is consistent with the negative correlation found between N2fixation and DIP
turnover time (the ratio between DIP concentrations and DIP uptake rates) (Table 2) and suggests a higher DIP limitation when N2fixation is high and consumes DIP. The high DIP
concentrations (> 0.1 µmol L−1) in GY surface waters com-pared to MA waters are consistent with former studies that consider the South Pacific Gyre as a high phosphate, low chlorophyll ecosystem (Moutin et al., 2008), in which DIP accumulates in the absence of NO−3 and low N2fixation
ac-tivity. In the high phosphate, low chlorophyll scenario, the community is limited by temperature and/or Fe availability (Moutin et al., 2008; Bonnet et al., 2008). During the OUT-PACE cruise, the DIP turnover time was variable but close to or below 2 days in MA waters (Moutin et al., 2018), in-dicating a potential limitation by DIP at some stations. Tri-chodesmium, the most abundant and major contributor to N2
fixation during the cruise, is known to synthesize hydrolytic enzymes in order to acquire P from the dissolved organic phosphorus pool (DOP) (Sohm and Capone, 2006). More-over, Trichodesmium spp. differs from the other major dia-zotroph UCYN-B enumerated on the cruise in the forms of organic P it can synthesize. It is thus likely that DOP species that favored Trichodesmium over UCYN-B played a role in maintaining high Trichodesmium biomass in MA waters. It has to be noted that average DIP turnover times in MA wa-ters were always much higher than those typically measured in severely DIP-limited environments such as the Mediter-ranean and Sargasso seas (e.g., Moutin et al., 2008), suggest-ing that DIP concentrations are generally favorable for the development of certain diazotrophs in the WTSP, and do not alone explain why N2fixation is high in MA waters and low
in GY waters. However, it is likely that the depletion of DIP stocks at the end of the austral summer season forces the de-cline of diazotrophic blooms in the WTSP (Moutin et al., 2005), concomitantly with the decline of SST.
Fe availability.Before OUTPACE, our knowledge on Fe sources and concentrations in the WTSP was limited, espe-cially in MA waters. During OUTPACE, Guieu et al. (2018) reported high dissolved Fe concentrations in MA waters (range 0.2–66.2 nmol L−1, 1.7 nmol L−1on average over the photic layer), i.e., significantly (p < 0.05) higher than those reported in GY waters (range 0.2–0.6 nmol L−1, 0.3 nM on average over the photic layer). The low dissolved Fe concen-trations measured in the GY waters agree well with previ-ous reports for the same region (Blain et al., 2008; Fitzsim-mons et al., 2014). However, the high dissolved Fe con-centrations measured in MA waters were previously undoc-umented and reveal several maxima (> 50 nmol L−1) be-tween stations SD7 and SD11, indicative of intense fertil-ization processes taking place in this region. Guieu et al. (2018) found that atmospheric deposition measured during the cruise in this region was too low to explain the observed
dissolved Fe concentrations in the surface water column. The seafloor of the WTSP hosts the Tonga–Kermadec subduc-tion zone which stretches 2500 km from New Zealand to the Tonga archipelago (Fig. 1). It has among the highest densities of submarine volcanoes associated with hydrothermal vents recorded in the ocean (2.6 vents / 100 km, Massoth et al., 2007), which discharge large quantities of material into the water column, including biogeochemically relevant elements such as Fe and Mn. Guieu et al. (2018) used hydrological data recorded by Argo float in situ measurements, atlas data and simulations from a general ocean circulation model to argue that the high dissolved Fe concentrations may be sus-tained by a submarine source. They show that such Fe inputs could spread throughout the WTSP through mesoscale activ-ity mainly westward through the South Equatorial Current, SEC (Fig. 1). Guieu et al. (2018) hypothesize that the high dissolved Fe concentrations in MA waters compared to the GY ones is due to shallow inputs of hydrothermal origin to-gether with potential Fe input from islands themselves (Sh-iozaki et al., 2014). In our study, dissolved Fe concentrations were significantly positively correlated with N2fixation and
help to explain the distribution of N2fixation rates measured
across the OUTPACE transect.
In summary, our hypothesis to explain the spatial distribu-tion of N2fixation in MA waters is the following: when high
DIP waters flow westward from the ETSP through the SEC and cross the South Pacific Gyre, N2-fixing organisms do not
develop despite optimal SST (> 25◦C), likely because GY waters are Fe-depleted (Moutin et al., 2008; Bonnet et al., 2008). When the high DIP, low DIN (dissolved inorganic N) waters from the gyre are advected west of the Tonga trench in Fe-rich and warm (> 25◦C) waters, all environmental
condi-tions are fulfilled for diazotrophs to bloom extensively. Ac-cording to Moutin et al. (2018), the strong depth difference between the nitracline and the phosphacline in MA waters as-sociated with winter mixing allows a seasonal replenishment of DIP, which creates an excess of P relative to N and thus also favors N2fixation in this region. Further investigations
are required to better quantify Fe input from both islands and shallow volcanoes and associated hydrothermal activity along the Tonga volcanic arc for the upper mixed layer, study the fate of hydrothermal plumes in the water column at the local and regional scales, and investigate the potential impact of such hydrothermal inputs on diazotrophic communities at the scale of the whole WTSP.
N2 fixation rates were significantly negatively correlated
with NO−3 concentrations, consistent with the high ener-getic cost of N2 fixation compared to NO−3 assimilation
(Falkowski, 1983). They were also negatively correlated with depth and logically positively correlated with PAR and sea-water temperature, two parameters which are depth depen-dent. Most N2fixation took place in the surface mixed layer
and rates were ∼ 15 nmol N L−1d−1in MA waters with lo-cal maxima at stations SD1, SD6 and LDB and lolo-cal minima at SD8 and SD10. Trichodesmium, the most abundant
dia-zotroph enumerated at those stations (Stenegren et al., 2018), is buoyant, and horizontal advection is well known to re-sult in patchy distributions of Trichodesmium in the surface ocean (Dandonneau et al., 2003), with huge surface accumu-lations named slicks, as observed during OUTPACE (Stene-gren et al., 2018), surrounded by areas with lower accumula-tions. These physical processes may explain the differences between stations rather than local enrichments of nutrients due to islands as those three stations where the highest rates were measured are not located close to islands. However, the huge surface bloom observed at LDB (Fig. 1) and ex-tensively studied by de Verneil et al. (2017) was mainly sus-tained by N2 fixation (secondary fueling picoplankton and
diatoms, Caffin et al., 2018a), rather than deep nutrient in-puts (de Verneil et al., 2017). This bloom had been drifting eastwards for several months and initially originated from Fiji and Tonga archipelagoes (https://outpace.mio.univ-amu. fr/spip.php?article160, last access: February 2016), which may have provided sufficient Fe to alleviate limitation and trigger this exceptional diazotroph bloom.
4.3 Trichodesmium: the major contributor to N2
fixation in the WTSP
In MA waters, the dominant diazotroph phylotypes quanti-fied using nifH quantitative PCR assays were Trichodesmium spp. and UCYN-B (Stenegren et al., 2018), which commonly peaked at > 106nifHcopies L−1in surface (0–50 m) waters. DDAs (mainly het-1, but het-2 and het-3 were also detected) were the next most abundant diazotrophs (Stenegren et al., 2018). This result is consistent with the fact that abundances of those phylotypes co-varied and were significantly posi-tively correlated with N2 fixation rates (Table 2). The two
UCYN-A lineages (UCYN-A1 and UCYN-A2) were less abundant (< 1.0–1.5 % of total nifH copies, Stenegren et al., 2018) and not significantly correlated with N2fixation rates
(Table 2).
The relative contribution of different diazotroph phylo-types to bulk N2 fixation has been largely investigated
through bulk and size fractionation measurements (usually comparing > and < 10 µm size fraction N2 fixation rates),
which may be misleading since some small-size diazotrophs are attached to large-size particles (Benavides et al., 2016; Bonnet et al., 2009) or form colonies or symbioses with di-atoms (e.g., UCYN-B, Foster et al., 2011, 2013) and some diazotrophic-derived N released by diazotrophs is assimi-lated by small and large non-diazotrophic plankton (e.g., Bonnet et al., 2016a). Here we directly measured the in situ cell-specific N2fixation activity of the two dominating
dia-zotroph groups in MA waters: Trichodesmium and UCYN-B. At all three studied stations, Trichodesmium dominated, accounting for 68.0–91.8 % of the diazotroph community, followed by UCYN-B, accounting for 0.3–31.7 %. In ad-dition, Trichodesmium and UCYN-B had the highest mea-sured gene expression (102–105 cDNA nifH copies L−1). It
was not surprising that UCYN-B had a high gene expression given that the sampling time occurred later in the day (17:00– 21:00); however, both Trichodesmium and het-1 (which typ-ically reduce N2 and express nifH highest during the day,
Church et al., 2005) had a detectable and often equally as high expression as UCYN-B. Cell-specific N2fixation rates
reported here are on the same order of magnitude as those reported for field populations of Trichodesmium (Berthelot et al., 2016; Stenegren et al., 2018) and UCYN-B (Foster et al., 2013). Trichodesmium was always the major contrib-utor to N2 fixation, accounting for 47.1–83.8 % of bulk N2
fixation, while UCYN-B never exceeded 6.1–10.1 %, despite accounting for > 30 % of the diazotroph community at SD6. This may be linked with the lower 15N enrichment at SD6 (0.517 ± 0.237 at. %), which is due to a high proportion of inactive cells (at. % close to natural abundance) compared to SD2, where the majority of cells were active and highly15 N-enriched (1.163 ± 0.531 at. %). Such heterogeneity in N2
fix-ation rates among UCYN-B-like cells has already been re-ported by Foster et al. (2013). Overall, these results show that the most abundant phylotype (Trichodesmium) accounts for the majority of N2fixation, but not in the same proportion,
further indicating that the abundance of micro-organisms in seawater cannot be equated to activity, which has already been reported for other functional groups such as bacte-ria (Boutrif et al., 2011). In the North Pacific Gyre (station ALOHA), Foster et al. (2013) report a higher contribution of UCYN-B to daily bulk N2fixation (24–63 %) during the
summer season, indicating that this group likely contributes more to the N budget at station ALOHA than in the WTSP, where Trichodesmium seems to be the major player.
5 Ecological relevance of N2fixation in the WTSP and
conclusions
N2fixation was significantly positively correlated with Chl a,
PON, POC and BSi concentrations, as well as with pri-mary production, suggesting a tight coupling between N2
fixation, primary production and biomass accumulation in the water column. Based on our measured C : N ratios at each depth, the computation of the N demand derived from primary production measured during OUTPACE (Johnson et al., 2007) indicates that N2 fixation fueled on average
8.2 ± 1.9 % (range 5.9 to 11.5 %) of total primary production in the WTSP. This contribution is higher than in other olig-otrophic regions such as the northwestern Pacific (Shiozaki et al., 2013), ETSP (Raimbault and Garcia, 2008), northeast-ern Atlantic (Benavides et al., 2013), or the Mediterranean Sea (Bonnet et al., 2011; Ridame et al., 2014), where it is generally < 5 %. However, it is comparable to results found further north in the Solomon Sea (N2fixation fueled 9.4 %
of primary production, Berthelot et al., 2017), which is part of the WTSP “hotspot” for N2fixation (Bonnet et al., 2017).
Caffin et al. (2018b, a) show that N2fixation represents the
major source (> 90 %) of new N to the upper photic (produc-tive) layer during the OUTPACE cruise, before atmospheric inputs and nitrate diffusion across the thermocline, indicat-ing that N2fixation supported nearly all new production in
this region during austral summer conditions.
The large amount of N provided by N2 fixation likely
stimulated the growth of non-diazotrophic plankton as sug-gested by significant positive correlations between N2
fixa-tion rates and the abundance of Prochlorococcus spp., Syne-chococcus spp., heterotrophic bacteria and protists. 15N2
-based transfer experiments coupled with nanoSIMS exper-iments designed to trace the transfer of15N in the planktonic food web demonstrated that ∼ 10 % of diazotroph-derived N is rapidly (24–48 h) transferred to non-diazotrophic phyto-plankton (mainly diatoms and bacteria) in coastal waters of the WTSP (Bonnet et al., 2016a, b; Berthelot et al., 2016). The same experiments performed in offshore waters dur-ing the present cruise confirm that ∼ 10 % of recently fixed N2is also transferred to picophytoplankton and bacteria
af-ter 48 h (Caffin et al., 2018a). This is in accordance with Van Wambeke et al. (2018), who report that N2fixation fuels
40 to 70 % of the bacteria N demand in MA waters. This fur-ther demonstrates that N2fixation acts as an efficient natural
N fertilization in the WTSP, potentially fueling subsequent export of organic material below the photic layer. Caffin et al. (2018a, b) estimated that the e-ratio, which quantifies the efficiency of a system in exporting particulate carbon rela-tive to primary production (e-ratio = POC export/PP), was 3 times higher (p < 0.05) in MA waters compared to GY waters. Moreover, e-ratio values were as high as 9.7 % in MA waters, i.e., higher than the e-ratios in most studied olig-otrophic regions (Karl et al., 2012; Raimbault and Garcia, 2008), where they rarely exceed 1 %, indicating that produc-tion sustained by N2 fixation is efficiently exported in the
WTSP. Diazotrophs were recovered in sediment traps during the cruise (Caffin et al., 2018a, b), but their biomass only ac-counted for ∼ 5 % (locally 30 % at LDA) of the N biomass in the traps, indicating that most of the export was indirect, i.e., after transfer of diazotroph-derived N to the surrounding planktonic communities that were subsequently exported. A δ15N budget performed during the OUTPACE cruise reveals that N2fixation supports exceptionally high (> 50 % and
lo-cally > 80 % of) export production in MA waters (Knapp et al., 2018). Together these results suggest that N2fixation
plays a critical role in export in this globally important region for elevated N2fixation.
The magnitude and geographic distribution of N2fixation
control the rate of primary productivity and vertical export of carbon in the oligotrophic ocean; thus, accurate estimates of N2fixation are of primary importance for oceanographers to
constrain and predict the evolution of marine biogeochemi-cal carbon and N cycles. The number of N2fixation estimates
have increased dramatically at the global scale over the past 3 decades (Luo et al., 2012). The results reported here show that some poorly sampled areas such as the WTSP provide
unique conditions for diazotrophs to fix at high rates and con-tribute to the need to update current N2fixation estimates for
the Pacific Ocean. Further studies would be required to assess the seasonal variability of N2fixation in this region and
per-form accurate N budgets. Nonetheless, such high N2fixation
rates question whether or not these high N inputs can balance the N losses in the ETSP. A recent study based on the N∗(the excess of N relative to P) at the whole South Pacific scale Fu-menia et al. (2018) reveals a strong positive N∗anomaly (in-dicative of N2fixation) in the surface and thermocline waters
of the WTSP, which potentially influences the geochemical signature of the thermocline waters further east in the South Pacific through the regional circulation. However, the WTSP is chronically undersampled, and a better description of the mesoscale and general circulation would be necessary to as-sess how N sources and sinks are coupled at the South Pacific scale.
Data availability. All data and metadata are available at the follow-ing web address: http://www.obs-vlfr.fr/proof/php/outpace/outpace. php, last access: June 2018.
Author contributions. SB designed the experiments; SB, MC, HB and MB carried them out at sea. MC, HB, RAF, SHN, CG and OG analyzed the samples; MC and SB analyzed the data. SB prepared the manuscript with contributions from all co-authors.
Competing interests. The authors declare that they have no conflict of interest.
Special issue statement. This article is part of the special issue “In-teractions between planktonic organisms and biogeochemical cy-cles across trophic and N2 fixation gradients in the western tropical South Pacific Ocean: a multidisciplinary approach (OUTPACE ex-periment)”. It is not associated with a conference.
Acknowledgements. This research is a contribution of the OUT-PACE (Oligotrophy from Ultra-oligoTrophy PACific Experiment) project (https://outpace.mio.univ-amu.fr/, last access: June 2018) funded by the Agence Nationale de la Recherche (grant ANR-14-CE01-0007-01), the LEFE-CyBER program (CNRS-INSU), the Institut de Recherche pour le Développement (IRD), the GOPS program (IRD) and the CNES (BC T23, ZBC 4500048836). The OUTPACE cruise (http://dx.doi.org/10.17600/15000900, last access: June 2018) was managed by the MIO (OSU Institut Pytheas, AMU) from Marseilles (France). The authors thank the crew of the R/V L’Atalante for outstanding shipboard operations. Gilles Rougier and Marc Picheral are warmly thanked for their efficient help in CTD rosette management and data processing, as well as Catherine Schmechtig for the LEFE-CyBER database management and Thibaut Wagener for providing the map of bathymetry. Aurelia Lozingot is acknowledged for the
administra-tive work. Mar Benavides was funded by the People Programme (Marie Skłodowska-Curie Actions) of the European Union’s Seventh Framework Programme (FP7/2007-2013) under REA grant agreement number 625185. The participation, nucleic acid sampling and analysis were provided to Rachel A. Foster by the Knut and Alice Wallenberg Foundation. Rachel A. Foster also acknowledges the assistance by Lotta Berntzon, Marcus Stenegren and Andrea Caputo. The satellite products are provided by CLS with the support of CNES.
Edited by: Douglas G. Capone
Reviewed by: Carolin Löscher and three anonymous referees
References
Aminot, A. and Kérouel, R.: Dosage automatique des nutriments dans les eaux marines: méthodes en flux continu, Editions Quae, 2007.
Benavides, M. and Voss, M.: Five decades of N2fixation research in the North Atlantic Ocean, Frontiers in Marine Science, 2, 1–20, https://doi.org/10.3389/fmars.2015.00040, 2015.
Benavides, M., Bronk, D. A., Agawin, N. S., Pérez-Hernández, M. D., Hernández-Guerra, A., and Arístegui, J.: Longitudinal variability of size-fractionated N2fixation and DON release rates along 24.5◦N in the subtropical North Atlantic, J. Geophys. Res.-Oceans, 118, 3406–3415, 2013.
Benavides, M., Moisander, P. H., Berthelot, H., Dittmar, T., and Grosso, O.: Mesopelagic N2 fixation related to organic matter composition in the Solomon and Bis-marck Seas (Southwest Pacific), PLoS One, 10, 12, https://doi.org/10.1371/journal.pone.0143775, 2015.
Benavides, M., Moisander, P. H., Daley, M. C., Bode, A., and Arístegui, J.: Longitudinal variability of diazotroph abundances in the subtropical North Atlantic Ocean, J. Plankton Res., 38, 662–672, 2016.
Benavides, M., Berthelot, H., Duhamel, S., Raimbault, P., and Bonnet, S.: Dissolved organic matter uptake by Tri-chodesmium in the Southwest Pacific, Sci. Rep.-UK, 7, 41315, https://doi.org/10.1038/srep41315, 2017.
Berthelot, H., Bonnet, S., Grosso, O., Cornet, V., and Barani, A.: Transfer of diazotroph-derived nitrogen towards non-diazotrophic planktonic communities: a comparative study between Trichodesmium erythraeum, Crocosphaera wat-sonii and Cyanothece sp., Biogeosciences, 13, 4005–4021, https://doi.org/10.5194/bg-13-4005-2016, 2016.
Berthelot, H., Benavides, M., Moisander, P. H., Grosso, O., and Bonnet, S.: High-nitrogen fixation rates in the partic-ulate and dissolved pools in the Western Tropical Pacific (Solomon and Bismarck Seas), Geophys. Res. Lett., 2, 1–10, https://doi.org/10.1002/2017GL073856, 2017.
Blain, S., Bonnet, S., and Guieu, C.: Dissolved iron distribu-tion in the tropical and sub tropical South Eastern Pacific, Biogeosciences, 5, 269–280, https://doi.org/10.5194/bg-5-269-2008, 2008.
Bock, N., Van Wambeke, F., Dion, M., and Duhamel, S.: Micro-bial community structure in the Western Tropical South Pa-cific, Biogeosciences Discuss., https://doi.org/10.5194/bg-2017-562, in review, 2018.
Bonnet, S. and Guieu, C.: Atmospheric forcing on the annual iron cycle in the Mediterranean Sea. A one-year survey, J. Geophys. Res., 111, C9, https://doi.org/10.1029/2005JC003213, 2006. Bonnet, S., Guieu, C., Bruyant, F., Prášil, O., Van Wambeke, F.,
Raimbault, P., Moutin, T., Grob, C., Gorbunov, M. Y., Zehr, J. P., Masquelier, S. M., Garczarek, L., and Claustre, H.: Nutrient limi-tation of primary productivity in the Southeast Pacific (BIOSOPE cruise), Biogeosciences, 5, 215–225, https://doi.org/10.5194/bg-5-215-2008, 2008.
Bonnet, S., Biegala, I. C., Dutrieux, P., Slemons, L. O., and Capone, D. G.: Nitrogen fixation in the western equatorial Pa-cific: Rates, diazotrophic cyanobacterial size class distribution, and biogeochemical significance, Global Biogeochem. Cy., 23, 1–13, https://doi.org/10.1029/2008gb003439, 2009.
Bonnet, S., Grosso, O., and Moutin, T.: Planktonic dinitrogen fixa-tion along a longitudinal gradient across the Mediterranean Sea during the stratified period (BOUM cruise), Biogeosciences, 8, 2257–2267, https://doi.org/10.5194/bg-8-2257-2011, 2011. Bonnet, S., Rodier, M., Turk-Kubo, K., Germineaud, C., Menkes,
C., Ganachaud, A., Cravatte, S., Raimbault, P., Campbell, E., Quéroué, F., Sarthou, G., Desnues, A., Maes, C., and Eldin, G.: Contrasted geographical distribution of N2fixation rates and nifHphylotypes in the Coral and Solomon Seas (South-Western Pacific) during austral winter conditions, Global Biogeochem. Cy., 29, 11, https://doi.org/10.1002/2015GB005117, 2015. Bonnet, S., Berthelot, H., Turk-Kubo, K. A., Cornet-Barthaux,
V., Fawcett, S., Berman-Frank, I., Barani, A., Grégori, G., Dekaezemacker, J., Benavides, M., and Capone, D. G.: Dia-zotroph derived nitrogen supports diatom growth in the South West Pacific: A quantitative study using nanoSIMS, Limnol. Oceanogr., 61, 1549–1562, https://doi.org/10.1002/lno.10300, 2016a.
Bonnet, S., Berthelot, H., Turk-Kubo, K., Fawcett, S., Rahav, E., L’Helguen, S., and Berman-Frank, I.: Dynamics of N2 fixa-tion and fate of diazotroph-derived nitrogen in a low-nutrient, low-chlorophyll ecosystem: results from the VAHINE mesocosm experiment (New Caledonia), Biogeosciences, 13, 2653–2673, https://doi.org/10.5194/bg-13-2653-2016, 2016b.
Bonnet, S., Caffin, M., Berthelot, H., and Moutin, T.: Hot spot of N2 fixation in the western tropical South Pacific pleads for a spatial decoupling between N2 fixation and den-itrification, P. Natl. Acad. Sci. USA, 114, E2800–E2801, https://doi.org/10.1073/pnas.1619514114, 2017.
Böttjer, D., Dore, J. E., Karl, D. M., Letelier, R. M., Mahaf-fey, C., Wilson, S. T., Zehr, J. P., and Church, M. J.: Tem-poral variability of nitrogen fixation and particulate nitrogen export at Station ALOHA, Limnol. Oceanogr., 62, 200–216, https://doi.org/10.1002/lno.10386, 2017.
Breitbarth, E., Oschlies, A., and LaRoche, J.: Physiological con-straints on the global distribution of Trichodesmium – ef-fect of temperature on diazotrophy, Biogeosciences, 4, 53–61, https://doi.org/10.5194/bg-4-53-2007, 2007.
Boutrif, M., Garel, M., Cottrell, M. T., and Tamburini, C.: Assimi-lation of marine extracellular polymeric substances by deep-sea prokaryotes in the NW Mediterranean Sea, Environmental mi-crobiology reports, 3, 705–709, https://doi.org/10.1111/j.1758-2229.2011.00285.x, 2011.
Caffin, M., Berthelot, H., Cornet-Barthaux, V., Barani, A., and Bon-net, S.: Transfer of diazotroph-derived nitrogen to the planktonic
food web across gradients of N2fixation activity and diversity in the western tropical South Pacific Ocean, Biogeosciences, 15, 3795–3810, https://doi.org/10.5194/bg-15-3795-2018, 2018a. Caffin, M., Moutin, T., Foster, R. A., Bouruet-Aubertot, P.,
Dogli-oli, A. M., Berthelot, H., Guieu, C., Grosso, O., Helias-Nunige, S., Leblond, N., Gimenez, A., Petrenko, A. A., de Verneil, A., and Bonnet, S.: N2 fixation as a dominant new N source in the western tropical South Pacific Ocean (OUTPACE cruise), Biogeosciences, 15, 2565–2585, https://doi.org/10.5194/bg-15-2565-2018, 2018b.
Carpenter, E. J., Subramaniam, A., and Capone, D. G.: Biomass and primary productivity of the cyanobacterium Trichodesmium spp. in the tropical N Atlantic ocean, Deep-Sea Res. Pt. I, 51, 173– 203, 2004.
Church, M. J., Short, C. M., Jenkins, B. D., Karl, D. M., and Zehr, J. P.: Temporal patterns of nitrogenase gene (nifH) ex-pression in the oligotrophic North Pacific Ocean, Appl. Environ. Microb., 71, 5362–5370, https://doi.org/10.1128/aem.71.9.5362-5370.2005, 2005.
Cook, J.: The Voyages of Captain James Cook, vol. 2, William Smith, 1842.
Dabundo, R., Lehmann, M. F., Treibergs, L., Tobias, C. R., Altabet, M. A., Moisander, A. M., and Granger, J.: The contamination of commercial 15N2 gas stocks with 15N labeled nitrate and ammonium and consequences for ni-trogen fixation measurements, PLoS One, 9, e110335, https://doi.org/10.1371/journal.pone.0110335, 2014.
Dandonneau, Y., Vega, A., Loisel, H., du Penhoat, Y., and Menkes, C.: Oceanic Rossby waves acting as a “hay rake” for ecosystem floating by-products, Science, 302, 1548–1551, https://doi.org/10.1126/science.1090729, 2003.
de Boyer Montégut, C., Madec, G., Fischer, A. S., Lazar, A., and Iudicone, D.: Mixed layer depth over the global ocean: An examination of profile data and a profile-based climatology, J. Geophys. Res.-Oceans, 109, C12, https://doi.org/10.1029/2004JC002378, 2004.
Dekaezemacker, J. and Bonnet, S.: Sensitivity of N2 fixation to combined nitrogen forms (NO−3 and NH+4) in two strains of the marine diazotroph Crocosphaera watsonii (Cyanobacteria), Mar. Ecol. Prog. Ser., 438, 33–46, https://doi.org/10.3354/meps09297, 2011.
Dekaezemacker, J., Bonnet, S., Grosso, O., Moutin, T., Bressac, M., and Capone, D. G.: Evidence of active dinitrogen fixa-tion in surface waters of the Eastern Tropical South Pacific during El Nino and La Nina events and evaluation of its po-tential nutrient controls, Global Biogeochem. Cy., 27, 1–12, https://doi.org/10.1002/gbc.20063, 2013.
Deutsch, C. A., Sarmiento, J. L., Sigman, D. M., Gru-ber, N., and Dunne, J. P.: Spatial coupling of nitrogen inputs and losses in the ocean, Nature, 445, 163–167, https://doi.org/10.1038/nature05392, 2007.
de Verneil, A., Rousselet, L., Doglioli, A. M., Petrenko, A. A., and Moutin, T.: The fate of a southwest Pacific bloom: gauging the impact of submesoscale vs. mesoscale circulation on biologi-cal gradients in the subtropics, Biogeosciences, 14, 3471–3486, https://doi.org/10.5194/bg-14-3471-2017, 2017.
Dugdale, R. C. and Goering, J. J.: Uptake of new and regenerated forms of nitrogen in primary productivity, Limnol. Oceanogr., 12, 196–206, https://doi.org/10.4319/lo.1967.12.2.0196, 1967.