Demographic inference through approximate-Bayesian-computation skyline plots
Texte intégral
Figure
Documents relatifs
• Simulated samples are summarized using the same statistics as the observed sample, and the best 0.5% of population size histories (i.e. those providing statistics that are the
Section 3 describes then our parametric skyline extraction algorithm based on low level image processing that allows to extract the upper envelope, which is a disconnected
In the second case, no finite population size is assumed, but the gain from future patients is geometrically discounted, so that the gain from patient j if they receive treatment i is
L’archive ouverte pluridisciplinaire HAL, est destinée au dépôt et à la diffusion de documents scientifiques de niveau recherche, publiés ou non, émanant des
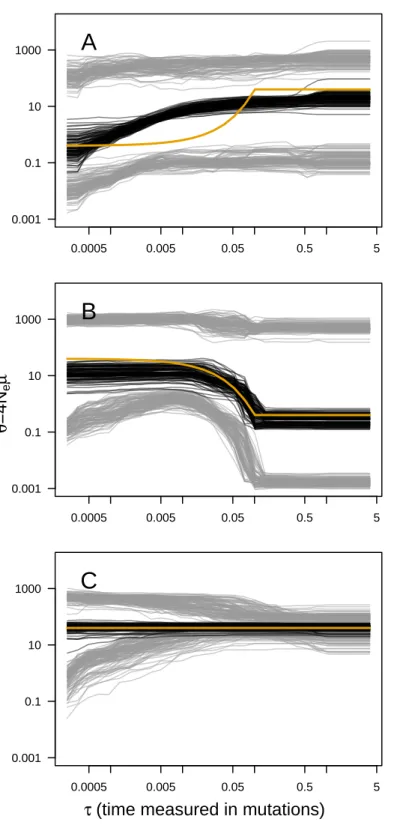
of: coalescent times, effective population size trajectory and ranked tree shape topology.
We consider a size-structured model for cell division and address the question of determining the division (birth) rate from the measured stable size distribution of the population..
Our analysis shows that the worst time complexity of SDI is better than the best known one [13] in high- dimensionality domains with reasonably low cardinality, and our
First, in Section 2.1, we recall the stochastic process describing the eco-evolution of a structured population with ecological feedbacks (introduced in Billiard et al., 2015).
