HAL Id: hal-02883575
https://hal-enpc.archives-ouvertes.fr/hal-02883575
Submitted on 29 Jun 2020
HAL is a multi-disciplinary open access
archive for the deposit and dissemination of
sci-entific research documents, whether they are
pub-lished or not. The documents may come from
teaching and research institutions in France or
L’archive ouverte pluridisciplinaire HAL, est
destinée au dépôt et à la diffusion de documents
scientifiques de niveau recherche, publiés ou non,
émanant des établissements d’enseignement et de
recherche français ou étrangers, des laboratoires
Planning for environmental justice - reducing well-being
inequalities through urban greening
Charlotte Liotta, Yann Kervinio, Harold Levrel, Léa Tardieu
To cite this version:
Charlotte Liotta, Yann Kervinio, Harold Levrel, Léa Tardieu. Planning for environmental justice
-reducing well-being inequalities through urban greening. Environmental Science and Policy, Elsevier,
2020, 112, pp.47-60. �10.1016/j.envsci.2020.03.017�. �hal-02883575�
Planning for environmental justice - reducing
well-being inequalities through urban greening
Charlotte Liotta
1, Yann Kervinio
1, Harold Levrel
1, and L´
ea
Tardieu
∗11
CIRED, AgroParisTech, Cirad, CNRS, EHESS, Ecole des Ponts
ParisTech, Universit´
e Paris-Saclay, F-94736 Nogent-sur-Marne,
France
March 19, 2020
Highlights:
• Green spaces are unequally distributed within the Paris metropolitan area. • Targeting areas poorly endowed with green space is likely to favour affluent
populations.
• We propose a new methodology for just green infrastructure development.
Abstract
Urban green spaces provide cultural ecosystem services, and urban policies typically aim to enhance these services by targeting new invest-ments in deprived areas. The implementation of urban greening policies is one way to reduce inequalities in well-being, for example by targeting areas where increased access to green spaces will benefit citizens of low socioeconomic status. Most research has addressed the targeting of green infrastructure development by considering income and access to green spaces, while few studies have considered a multidimensional definition of well-being. The aims of this paper are to i) integrate inputs from the eco-nomic and political philosophy literature to propose a broader definition of well-being, including health, education, insecurity, and social relations; ii) develop a criterion to prioritise areas where urban greening would have the greatest impact on well-being inequalities; and iii) apply this criterion to the Paris metropolitan area (Ile-de-France region), a spatially hetero-geneous region where areas deprived of access to green spaces are not systematically deprived in other dimensions. Our analysis shows that the city of Paris and the inner suburbs would be targeted when considering inequality in access to green spaces only. The results differ when inequal-ities in income or multidimensional well-being are taken into account, in which case the northern inner suburbs and some outer suburbs become a higher priority.
Keywords: environmental justice; cultural ecosystem services; green spaces; planning strategies; multidimensional inequality indices.
1
Introduction
Urban greening has become a priority in urban planning policies. Target 11.7 of the sustainable development goals (SDGs, United Nations) states that cities have to “provide universal access to safe, inclusive and accessible, green and public spaces, particularly for women and children, older persons and persons with disabilities” by 2030. In that spirit, the city of Paris recently announced
5
the creation of 4 urban forests in the core of the city1. Such public policies
are motivated by the growing recognition of the multiple contributions that urban green spaces offer people. Accordingly, cities seek to increase access to green spaces and design urban green infrastructure2 from which citizens derive
ecosystem services, including benefits in terms of physical and mental health
10
(WHO, 2016) or social relations (De Vries et al., 2013; Campbell et al., 2016). Urban greening policies have to rely on decision criteria. Most existing targeting criteria are based on the ”greenness” of the city, and the indicator associated with target 11.7 of the SDGs focuses on areas with a lower propor-tion of green space at a specific level (e.g., municipality). The major planning
15
document3 for the Ile-de-France region in 2013 suggested that at least 10m2
of public green space should be supplied per inhabitant at the municipal level, and municipalities composed of less than 10% natural space should be priori-tised. However, such a targeting approach could have mixed effects on existing inequalities and give rise to different conclusions from an environmental justice
20
perspective.
Environmental justice concerns emerged in the 1970s in the United States, based on the observation that deprived populations also experienced poor envi-ronmental quality. From the initial observation that ethnic minorities were more exposed to industrial pollution (Chavis and Lee, 1987), this literature later
ex-25
panded its scope to the distribution of environmental amenities, including green spaces. In many cities, access to green spaces has been shown to be stratified based on income or ethno-racial characteristics. This unequal distribution of green spaces and biodiversity is partly due to dynamic effects: green spaces make neighbourhoods wealthier and more aesthetically attractive, increasing
30
housing costs and property values (Wolch et al., 2014). For instance, Wolch et al. (2005) showed that residents of deprived areas in Los Angeles have less access to green spaces. Landry and Chakraborty (2009) found that city trees in Tampa, Florida, are unevenly distributed, exhibiting a pattern of discrim-ination against ethnic minorities and low-income populations. Heynen et al.
35
(2006) demonstrated that greenness in Milwaukee, Wisconsin, is significantly positively correlated with income and negatively correlated with the presence of ethnic minorities. A pattern of higher biodiversity in affluent neighbourhoods,
1See
www.paris.fr/actualites/des-forets-urbaines-bientot-sur-quatre-sites-emblematiques-6899, consulted on August 20, 2019.
2According to the European Union (2013), green infrastructure is a “strategically planned
network of natural and semi-natural areas (. . . ) designed and managed to deliver a wide range of ecosystem services” (p.7).
termed the ”luxury effect”, has also been found globally regarding plant diver-sity and canopy or vegetative cover (Leong et al., 2018). In addition, there is
40
evidence of a ”luxury effect” in North America, Europe and New Zealand re-garding the distribution of birds, bats or lizards (Leong et al., 2018). In such cases, targeting green space creation where such areas are lacking would re-duce inequalities and address equity concerns. There are cases, however, where wealthy populations also have less access to green spaces. We will show that
45
the Paris metropolitan area is one such instance. There, the development of green infrastructure faces a trade-off between targeting areas with few green spaces and targeting areas where the new infrastructure would best contribute to reducing inequalities through the provision of ecosystem services to deprived populations.
50
Beyond diagnosis, few environmental justice studies propose a prioritisation method that incorporates equity criteria in urban greening investments. In a recent exception, Schaeffer and Tivadar (2019) propose two spatial indices to measure environmental inequalities in the French city of Grenoble, consider-ing income and vegetation cover4. As a public policy criterion, they propose
55
targeting the areas where increasing vegetation cover would have the largest influence on environmental inequalities. However, the idea that income alone can adequately account for individual well-being has been challenged. Follow-ing Kabisch and Haase (2014), we agree on the necessity to account for multiple socioeconomic characteristics of the population in regard to urban greening
in-60
vestments. For instance, Kabisch and Haase (2014) show that in Berlin, even if overall access to green spaces is good, immigrants generally have lower access than the rest of the population.
In this paper, we develop a new methodological approach that identifies where urban greening would have the greatest impact on well-being
inequali-65
ties. In recent decades, some authors have argued in favour of going beyond the typical indicators when addressing equity issues by expanding the focus on material living conditions to a wider notion of human well-being (Stiglitz et al., 2009). The Millennium Ecosystem Assessment Consortium (2005) also devel-oped a framework in which security, basic materials for a good life, health, and
70
social relations are the main dimensions of human well-being and conditions for actual freedom of choices and actions. Following the Stiglitz-Sen-Fitoussi report (2009), we define ”well-being” through multiple dimensions including material living conditions, health, education, personal activities, political participation, social connections and relationships, economic and physical insecurity and
en-75
vironmental conditions, where access to green spaces is part of this latter di-mension.
Following Campbell et al. (2016), we contend that green spaces significantly contribute to human well-being through cultural ecosystem services (CES), a category that has been shown to be difficult to characterise and connect to
80
decision-making processes (Gould, Morse and Adams, 2019). The Millennium
4Measured as the normalised difference vegetation index (NDVI) obtained by remote
Ecosystem Assessment (MEA, 2005) defines CES as the ”non-material benefits people obtain from ecosystems through spiritual enrichment, cognitive devel-opment, reflection, recreation, and aesthetic experiences”. In the Ile-de-France, green spaces support multiple uses, including activities such as practicing sports,
85
relaxing or walking (Ta et al., 2020). These uses provide, in turn, multiple non-material benefits, including improvements in terms of physical and mental health (De Vries et al., 2013, WHO, 2016), social relations (De Vries et al., 2013, Campbell et al, 2016) or sense of place (Campbell et al, 2016).
Our methodology seeks to strengthen distributive justice in urban greening
90
decisions (Low, 2013). We first develop an index of multidimensional well-being inequalities. Then, we simulate urban greening actions that would increase access to green spaces for 100 inhabitants in each census tract and identify the census tracts where urban greening actions would decrease multidimensional inequalities according to this index. Such an evaluation criterion could inform
95
urban greening public policies, in conjunction with efficiency and feasibility criteria.
We apply this methodology to the Ile-de-France region, roughly correspond-ing to the Paris metropolitan area. This case study differs from most case studies in environmental justice for two reasons. First, most case studies
con-100
cern United States cities, the spatial organisation of which frequently differs from that of European cities (Brueckner et al., 1999). In the Ile-de-France, areas with higher incomes are also more densely populated and relatively deprived of ac-cess to green spaces. As Faburel and Gueymard (2008) show, socioeconomically favoured households are not systematically favoured in terms of environmental
105
amenities and pollution. In Paris, Cohen et al. (2012) do not find a ”luxury effect”: household income and species richness are not positively correlated. This can be explained by the ”Haussmann paradox”: upper social categories live in high-density districts with low-density coverage. Second, our case study is extended to the scale of a metropolitan region covering urban and rural
ar-110
eas. Half of the territory of the Ile-de-France is used for agriculture. Thus, there is some heterogeneity in our study area that we would like to address via a multidimensional definition of well-being.
We compare three decision criteria that may be used to target urban green-ing. First, decision makers can target only those areas most deprived in terms
115
of access to green space only. This is the current approach of the Ile-de-France region. Second, decision makers can target areas by accounting for both inequal-ities in income and access to green spaces. Third, they can target areas where the impact on multidimensional well-being inequalities will be the highest.
2
Material and methods
2.1
The Ile-de-France case study
The Ile-de-France is the most economically active area in France, accounting
120
concen-trating a large number of inhabitants (12.2 million in 2018, 18% of the French population) in a relatively small area (12012 km2, less than 2% of the French metropolitan area). Overall, 50% of the territory is used for agriculture, and 23% is covered by forests. Spatial disparities exist between Paris and the inner
125
suburbs5, which are heavily urbanised and densely populated, and the outer suburbs6, which are more rural (Figure 1).
Figure 1: Land use and land cover in the Ile-de-France (based on the simplified classification into 11 categories developed by Institut Paris Region)
2.2
Measuring access to green spaces
We developed an indicator of access to public green spaces to indicate whether
130
each inhabitant has a green space near his or her home. For each inhabitant, this indicator’s value is 1 if there is a green space larger than 1.5 hectares within 300 meters of his or her home and 0 otherwise.
The 300-meter buffer was chosen following the WHO report Urban green
5Inner suburbs: the three departments closest to Paris, i.e. Seine-Saint-Denis,
Hauts-de-Seine and Val-de-Marne
6Outer suburbs: the four departments farthest from Paris, i.e. Seine-et-Marne, Val-d’Oise,
spaces and health (2016). According to this report, 300 meters correspond to
135
a 5-minute walking distance, which guarantees access to green spaces, even for children, elderly people, and those who do not own a car. Because we are interested in CES, we consider only green spaces larger than 1.5 hectares following Niemel¨a et al. (2010), Cabral et al. (2016), and Levrel et al. (2017), assuming that it is the minimal size that allows uses such as engaging in sports,
140
relaxing or walking. This is consistent with existing studies: Coombes et al. (2010) indicate that 2 hectares is the minimal size that makes green spaces suitable for adult physical activity and report a significant relationship between the access to parks larger than 2 hectares and the amount of physical activity. We do not account for smaller green spaces, even if they contribute to the overall
145
greenness of the living environment and thus provide some benefits, such as improved mental health (De Vries et al., 2003). The WHO (2016) advises that only green spaces with free access should be considered: private green spaces (private gardens) and semi-private green spaces (parks with entrance fees, sports courts) are excluded.
150
Our indicator is consistent with existing policy recommendations. Natural England recommends access to a green space larger than 2 hectares within 300 meters of home. The European Common Indicator of local public open areas uses a criterion of a public open area larger than 0.5 hectares within 300 meters of home.
155
This indicator is computed using the land use data in the Ile-de-France pro-duced by the Institut Paris Region with a 25-meter resolution. Land use is classified into 81 categories, including categories related to public green spaces and housing areas (Tables S1 and S2). We consider ”public green space” to be categories 1 to 13, excluding intensive arable land (categories 6, 9 and 10)
160
because those areas are rarely accessible to practice recreational activities. We also exclude private green spaces (categories 14 to 25), cemeteries (category 26) and grasslands associated with military fields, aerodromes or commercial activ-ities (category 27) because they do not allow recreational activactiv-ities. Moreover, we exclude vacant lots (category 28): even if they could allow for recreational
165
activities after restoration (Anderson and Minor, 2017), their current quality and vegetation are in doubt. We regard categories 29 to 36, except category 35 (prisons), as ”housing areas”. The indicator of access to green spaces is com-puted for each spatial polygon classified as ”housing area” and then aggregated at the census tract level7, weighted by the population of the housing area8.
170
We use the indicator of access to public green spaces as a first decision crite-rion to target urban greening. However, such a targeting approach raises equity concerns. It does not account for the socioeconomic characteristics of a popula-tion. Thus, it targets some populations that are already well off based on factors that include income or education. In the United States, where low-income and
175
7in France, sub-municipal census tracts are called ”IRIS” (Ilots Regroup´es pour
l’Information Statistique) and have a targeted size of 2000 inhabitants.
8We multiplied their areas by the densities provided by the Institut Paris R´egion
multidimensionally deprived populations are frequently deprived also in terms of access to green spaces (Heynen et al., 2006; Landry and Chakraborty, 2009; Wolch et al., 2005), targeting areas lacking green spaces would potentially re-duce inequality. However, in the Ile-de-France, wealthy populations can also lack access to green spaces, which is consistent with many European cities; thus,
180
considering the criterion of access to green spaces for urban greening targeting could benefit wealthy populations and reinforce existing inequalities.
2.3
Measuring well-being inequality
2.3.1 Measuring individual well-being
Measuring individual well-being could follow various approaches, with different underlying visions of a good life and how public policies should treat individ-ual preferences (Decancq, Fleurbaey and Schokkaert, 2015). The dimensions
185
included in our measure of well-being are chosen on the basis of the Commis-sion on the Measurement of Social Progress (Stiglitz, Sen and Fitoussi, 2009). Following the authors, individual well-being is underpinned by material living conditions (income, consumption and wealth), health, education, personal activ-ities (including work), political participation and governance, social connections
190
and relationships, economic and physical insecurity, and the environment. The commission recommends monitoring each dimension separately. Therefore, our aim is to define indicators of each dimension.
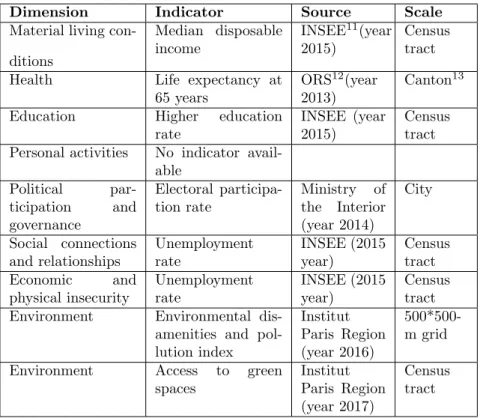
Table 1 summarises the sources and scales of the indicators. Material liv-ing conditions are captured by disposable income. Health is captured by life
195
expectancy. Following the commission, a higher education rate, defined as the fraction of the population with more than a secondary education, is considered intrinsically valuable. The unemployment rate is used because the Stiglitz-Sen-Fitoussi report insists on this indicator, and it is a proxy for both economic insecurity and social connections and relationships. Political participation and
200
governance are captured by the electoral participation rate in the first round of municipal elections. We chose municipal elections because the Stiglitz-Sen-Fitoussi report (2009) recommends considering local voting rather than national elections9. Finally, we introduce two indicators for environmental conditions. The first is the total number of environmental disamenities and pollution
expe-205
rienced among five pollutions that have proven effects on health (air pollution, noise pollution, soil pollution, water pollution, and chronic pollution due to in-dustrial activity)10. The second is an indicator for access to public green spaces,
as defined in section 2.1. Because of a lack of relevant data, personal activities (quality of leisure and working conditions) are not included in our
multidimen-210
sional inequality index. Due to data availability, we work at the census tract
9”Questions on local voting are often found to be more reliable and to display higher
vari-ance than voting in national elections, probably because it is less subject to ’social desirability’ response bias.”
10This corresponds to an aggregated indicator computed by the Institut Paris Region within
each 500*500-meter cell using various sources (Airparif, Bruitparif, DRIEE-IF, ARS Ile de France).
level and aggregate the data if needed. In the absence of information at the census tract level, we attribute values at a broader scale.
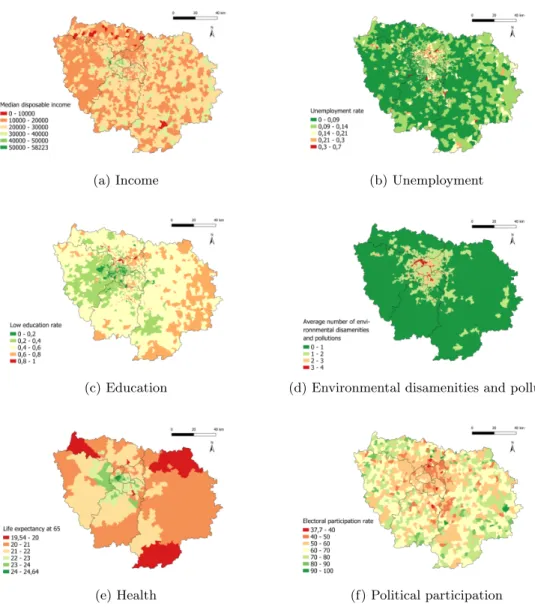
The spatial distributions of the dimensions (Figure 2) confirm that we could not have restricted our analysis to a single dimension. Indeed, even if there are
215
some similarities between the spatial distributions of the dimensions, they do not overlap. Areas where the median disposable income is high are generally areas where education and life expectancy are high. This observation is con-firmed by Spearman correlations (weighted by the population) of -0.78 between income and low education rate (meaning that poorer populations are in
gen-220
eral less educated) and 0.51 between income and life expectancy. Overall, some areas, such as the northern inner suburbs, exhibit accumulated inequalities in multiple dimensions. However, some dimensions show different patterns. Envi-ronmental disamenities and pollution are concentrated in Paris and part of the inner suburbs, although those areas are favoured with respect to many other
225
dimensions. This finding is again confirmed by Spearman correlations, as we find a significant relationship between income and exposure to environmental disamenities and pollution (+0.06).
Table 1: Indicators of the well-being dimensions Dimension Indicator Source Scale Material living
con-ditions Median disposable income INSEE11(year 2015) Census tract Health Life expectancy at
65 years
ORS12(year
2013)
Canton13
Education Higher education rate
INSEE (year 2015)
Census tract Personal activities No indicator
avail-able Political par-ticipation and governance Electoral participa-tion rate Ministry of the Interior (year 2014) City Social connections and relationships Unemployment rate INSEE (2015 year) Census tract Economic and physical insecurity Unemployment rate INSEE (2015 year) Census tract Environment Environmental
dis-amenities and pol-lution index Institut Paris Region (year 2016) 500*500-m grid Environment Access to green
spaces Institut Paris Region (year 2017) Census tract
2.3.2 Measuring well-being inequalities
Measuring well-being inequalities could also follow various approaches with dif-ferent analytical and ethical foundations (Aaberge and Brandolini, 2015). On
230
the basis of the dimensions of well-being identified in section 2.3.1, we define a multidimensional well-being inequality index that is consistent with environ-mental justice concerns. Specifically, we require the index to be sensitive to both the unequal distribution of each well-being dimension between the individuals (e.g., unequal distribution of the access to green spaces) and their cumulative
235
impact on inequalities (e.g., the extent to which deprived population also have little access to green space). To clarify further, we illustrate this with a simple example with 2 persons and 3 dimensions of well-being.
We start by introducing our example: in a reference situation, Anna and Bob have different well-being levels. Anna earns a large disposable income of
240
e4,000/month and can expect to live until 80 years of age. However, she spends most of her time in a polluted urban environment. By contrast, Bob lives in the outskirts of the city. The quality of his living environment is better, but he earns a low wage and is in poor health, which is reflected by a lower life expectancy.
245
Reference situation Anna Bob Income e4,000 e1,600
Health 80 years 60 years Environment 0.2 0.8
We first require the inequality index to decrease when well-being levels are averaged on every dimension. This property is called the uniform majorisation principle (Tsui, 1999).14 For instance, in situation 1, well-being levels are
av-eraged between Anna and Bob. Anna and Bob keep 75% of their well-being
250
levels in each dimension and give 25% of them to the other individual. The uniform majorisation principle requires that the inequality index decrease from the reference situation to situation 1.
Situation 1 Anna Bob Income e3,400 e2,200
Health 75 years 65 years Environment 0.35 0.65
We additionally require that the inequality index be sensitive to cumulative
255
inequalities. This is a central property, as environmental justice claims start
13Institut national de la statistique et des ´etudes ´economiques. 13Organisation r´egionale de la sant´e.
13Territorial subdivisions of approximately 30,000 inhabitants.
14This principle is a generalisation of the Pigou-Dalton transfer principle (Pigou, 1912 ;
Dalton, 1920). In a unidimensional case, the Pigou-Dalton transfer principle states that a transfer of income from a richer to a poorer individual should be assessed as a reduction in inequality.
(a) Income (b) Unemployment
(c) Education (d) Environmental disamenities and pollution
(e) Health (f) Political participation
from the observation that the populations that experience a degraded environ-ment are also disadvantaged on other dimensions of well-being. We require our inequality index to satisfy a property called correlation-increasing majorisation (Tsui, 1999). This property requires that any correlation-increasing
permuta-260
tion between individuals of well-being levels on one dimension be assessed as an increase in inequalities. This permutation corresponds, for instance, to the change from the reference situation to situation 2, where the quality of the living environment is permuted between Anna and Bob. Bob is now bottom-ranked on all dimensions, while Anna is top-ranked on all dimensions. The
correlation-265
increasing majorization principle requires that the inequality index increases from the reference situation to situation 2.
Situation 2 Anna Bob Income e4,000 e1,600
Health 80 years 60 years Environment 0.8 0.2
Following Kolm (1977), various multidimensional indexes of inequality have been introduced. In the appendix, we review this literature to identify an index
270
satisfying the two properties introduced above. We select an index proposed by Bourguignon (1999) that satisfies both properties under specific parameter restrictions.
The computation of this index can be decomposed into two steps. First, being dimensions, denoted by k, are aggregated into a one-dimensional
well-275
being level. This aggregation is performed through a classic function that allows substitution between well-being dimensions according to their relative weights, denoted by wk, and the substitutability β between well-being dimensions. The
smaller β is, the smaller the substitutability between the dimensions15. Then,
the one-dimensional well-being levels obtained are aggregated across the
pop-280
ulation. The parameter α accounts for inequality aversion, and it reflects the importance assigned to changes at the lower part of the distribution relative to changes for individuals who are better off.
1 −n1 P N[ P K(wkxβik)] α β [P K(wkxkβ)] α
β where xik is the well-being of individual i
on dimension k and xk its mean value in
the population N
(1)
285
15As β → −∞, the dimensions are considered perfect complements, and individual
well-being is tantamount to the worst dimension. When β = 0, the dimensions remain partial complements: a one-unit change on one dimension is all the more valuable to the individual because he or she enjoys high levels of well-being in other dimensions. When β = 1, the dimensions are perfect substitutes: a unit change on one dimension can be perfectly offset by a unit change in another dimension.
We need to justify the weights on well-being dimensions. Similar to the procedure used to compute the Human Development Index, we choose to remain agnostic about the relative importance of well-being dimensions and assign an equal weight to each dimension after a linear standardisation such that the
290
indices fall between 0 and 116.
To maintain desirable properties, β must fall between 0 and 1 and α must be positive and strictly lower than β. We opt for β = 0.5 (imperfect substitutabil-ity) and, following Lugo (2007), α = 1/3. We will also explore alternative options for the choices of α and β and their consequences for the targeting of
295
urban greening.
2.3.3 Targeting method
Given a set of potential urban greening projects, the targeting method consists of computing the impacts of each project on individual well-being and evaluating the overall impact on well-being inequalities through the index defined above. This allows for the ranking of projects according to their impact on well-being
300
inequalities.
In the application, we consider a set of hypothetical urban greening projects that give access to a green space to 100 additional inhabitants17 and could be
implemented in any census tract. We are working at the level of the census tract, which means that all the inhabitants of the census tract are assigned
305
the demographic characteristics of their respective census tracts and thus are considered similar. In each census tract, we compute the multidimensional inequality index before and after the hypothetical implementation of this urban greening project. We can thus evaluate the impact of such an urban greening project on well-being inequalities and rank the areas of intervention.
310
3
Application of different targeting criteria to
the Ile-de-France
3.1
Targeting urban greening on the basis of a green space
access criterion
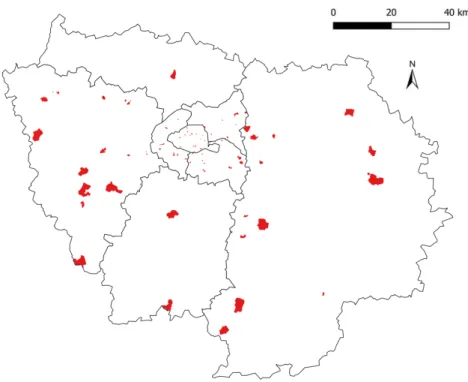
Our first decision criterion is to target areas deprived of access to green spaces. Only half of the inhabitants of Paris have access to a public green space larger than 1.5 hectares within 300 meters of their home, whereas almost 80% of the inhabitants of the outer suburbs do. The inner suburbs are similar to Paris in this regard, with 57.1% of the inhabitants having access to a public green space.
315
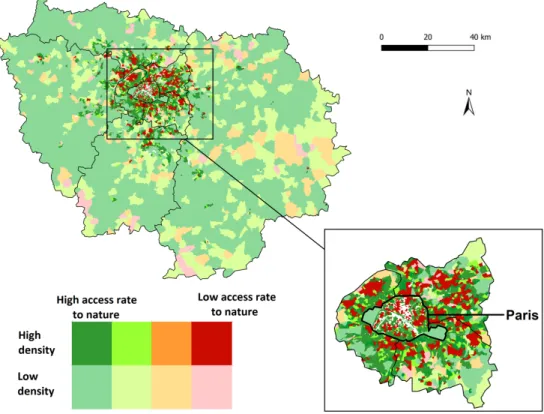
The spatial distribution of the indicator of access to green spaces (Figure 3) supports this view. Paris and the inner suburbs are densely populated (20791
16on weighting, see, e.g., Decancq and Lugo (2013)
17If fewer than 100 inhabitants in the census tract lack access to green space, we simulate
inhabitants per km2in Paris and 8234 inhabitants per km2in the inner suburbs, compared to 477 inhabitants per km2 in the outer suburbs) but deprived of access to green spaces, which is particularly true for the northern part of the
320
city of Paris, Seine-Saint-Denis (northern/eastern inner suburbs) and the north of Hauts-de-Seine (western inner suburbs). In the outer suburbs, the rate of inhabitants having access to green space is considerably higher, although this value is heterogeneous in the eastern outer suburbs (Seine-et-Marne) and in the very southern outer suburbs.
325
Thus, targeting areas with low access to green spaces implies targeting urban greening in Paris and some inner suburbs. However, although these areas lack access to green spaces, they are rich in other dimensions (figure 2). Inhabitants of Paris are significantly wealthier and more educated than inhabitants of the outer suburbs. Targeting the city of Paris would mean favouring populations
330
already favoured in other dimensions, which could be deemed inequitable. To address these concerns, we propose a targeting criterion that accounts for access to green spaces and other dimensions of well-being.
Figure 3: Criterion 1 - Public access to green spaces Aggregated at the census tract level.
3.2
Targeting urban greening on the basis of income and
access to green spaces
335
First, we compute our multidimensional index of well-being inequality with only two dimensions: access to green spaces and disposable income. Then, for each census tract, we simulate access to green spaces being given to 100 more inhabitants and recompute the bidimensional inequality index. We can thus ultimately identify the census tracts in which such a project has the greatest
340
impact on inequality so defined (Figure 4).
Figure 4: Criterion 2 - Bidimensional inequality index Aggregated at the census tract level.
An advantage of this criterion over the access-to-green-spaces criterion is that it allows prioritisation of the census tracts where urban greening should be targeted. Indeed, the access-to-green spaces criterion (section 3.1) establishes that in 15% of the census tracts (765 census tracts), no one has access to a
345
to prioritise among those 15%. By contrast, the bidimensional equity criterion determines which census tracts should be top priority.
More important, the access-to-green spaces and the bidimensional equity criteria target distinct census tracts. We compared the 15% of the census
350
tracts targeted as a priority by both criteria (for the access-to-green spaces criterion, these areas correspond to the census tracts where no one has access to green spaces). A 6% difference among targeted census tracts is observed. Some income-rich census tracts are targeted by the access-to-green-spaces criterion but not by the bidimensional equity criterion. These census tracts are mostly
355
located in Paris, particularly in the west (8th arrondissement, 15th arrondisse-ment). Conversely, some income-poor census tracts, mostly in the northern inner suburbs, are targeted by the bidimensional equity criterion but not by the access-to-green-spaces criterion. These census tracts are mostly located in northern inner suburbs (Epinay-sur-Seine in Seine-Saint-Denis, Clamart in
360
Hauts-de-Seine).
As a consequence, the bidimensional equity criterion places lower priority on Paris and the western inner suburbs that benefit from high incomes. The northern inner suburbs remain a top priority, as they exhibit low income and low access to green spaces, which is particularly obvious in the cases of
Seine-Saint-365
Denis (northern inner suburbs) and the northern suburbs (north of Hauts-de-Seine, south of Val-d’Oise). Some census tracts in the east of the eastern outer suburbs (Seine-et-Marne) and in the south of the Ile-de-France (Seine-et-Marne, Essonne) are also targeted because of the low income of their inhabitants and low access to green spaces despite the rural context.
370
3.3
Targeting urban greening on the basis of a
multidi-mensional well-being equity criterion
We computed the multidimensional index of well-being inequality with all our well-being dimensions, including access to green spaces. We applied the same methodology as in section 3.2 to identify the census tracts where an increase in
375
access to green spaces has the greatest impact on multidimensional inequality (Figure 5).
The bidimensional and multidimensional well-being equity criteria are very similar. Similar to the bidimensional well-being equity criterion, the multidi-mensional inequality index targets the inner suburbs, particularly the norther
380
inner suburbs. Some census tracts in Paris are also targeted with a high prior-ity. Some census tracts in the outer suburbs, particularly in the eastern outer suburbs (Seine-et-Marne), are also targeted with a low priority.
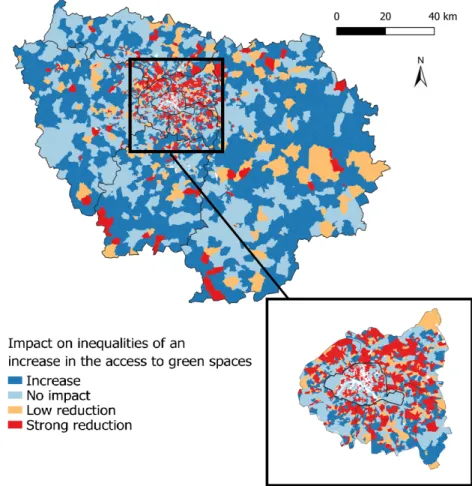
Only 6 census tracts are targeted by the multidimensional inequality index but not by the bidimensional inequality index. Therefore, six census tracts are
385
considered inequality-reducing by the multidimensional inequality index but not by the bidimensional inequality index, whereas 76 census tracts are targeted by the bidimensional inequality index but not by the multidimensional inequality index. Those census tracts can be found throughout the Ile-de-France but are
particularly numerous in the outer suburbs such as Seine-et-Marne or Yvelines
390
(figure 6). Indeed, compared to the Ile-de-France in general, the census tracts targeted with the bidimensional criterion but not by the multidimensional crite-rion are on average poorer and deprived of green spaces, but they are favoured in other dimensions. In particular, they have low rates of unemployment and low exposure to environmental disamenities and pollution.
395
Figure 5: Criteria 3 - Multidimensional inequality index Aggregated at the census tract level.
Figure 6: Census tracts targeted by the bidimensional inequality index and not by the multidimensional inequality index
3.4
Substitutability and inequality-aversion parameters
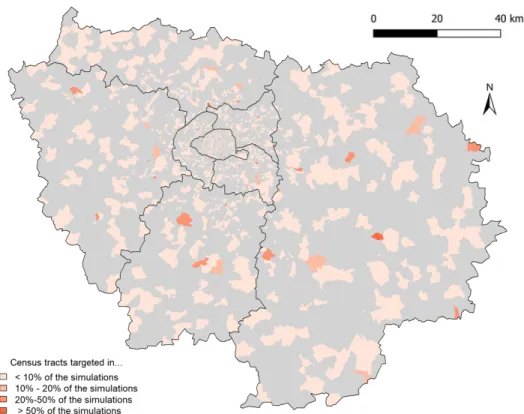
We explored alternative options concerning the choice of the substitutability pa-rameter β and the inequality-aversion papa-rameter α. We replicated our method-ology, allowing β and α to vary from 0 to 1 in steps of 0.05. For the census tracts targeted with our baseline criterion (i.e., where urban greening would strictly decrease inequalities), we checked that those census tracts were still targeted
400
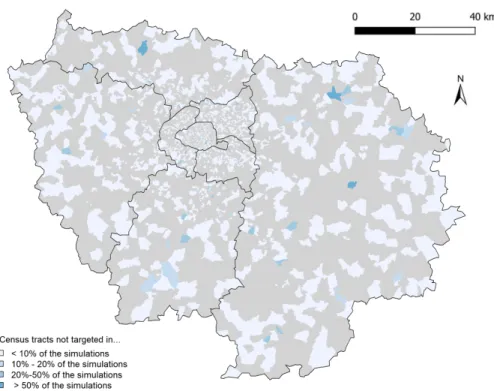
when β and α vary (Figure 7). For the census tracts not targeted with our baseline criterion (i.e., where urban greening would strictly increase inequali-ties), we checked that those census tracts were still not targeted when β varies (Figure 8).
Our results do not depend on the choices of β and α. Indeed, 89% of the
405
census tracts targeted with our baseline criterion remain targeted when consid-ering at least 90% of the alternative criteria with different β and α values. 72% of the census tracts that were not targeted with our baseline criterion are not targeted considering at least 90% of the alternative criteria with different β and α.
Figure 7: Census tracts that are targeted with the baseline criterion - explo-ration of alternative options for α and β
Figure 8: Census tracts that are not targeted with the baseline criterion - ex-ploration of alternative options for α and β
Other census tracts are represented in grey.
4
Discussion
The methodology developed in this paper offers a new tool to incorporate envi-ronmental justice concerns in urban greening investments. Despite the progress we offer in terms of methodology, further research is still needed to improve
415
the scientific, political and ethical relevance of the index and associated policy recommendations.
First, the approach developed here essentially addresses this issue through a distributive lens. However, in the definition of an equitable distribution of pub-lic space, Low (2013) calls for a broader framework, including a consideration of
420
procedural and interactional justice. From this perspective, our approach could be enhanced to include procedural justice concerns. For instance, the properties and parametric specification of the index and the choice of well-being dimensions
could be adjusted to reflect the actual judgments of inhabitants, involving disad-vantaged social groups, which could be accomplished through survey methods
425
or group deliberations over a well-designed set of simple situations. Our ap-proach thus paves the way for the enhancement of the inclusive character of urban greening decisions and innovative forms of public involvement.
Second, in this study, we compare the relative effects of urban greening actions on the reduction of cumulative well-being inequalities, but we do not
430
consider their relative efficiency in terms of the magnitude of associated bene-fits for health and other non-environmental dimensions of well-being. A robust assessment of these effects would provide a highly relevant complementary infor-mation that could also have indirect impacts on the assessment of inequalities and be included in the proposed multidimensional inequality index. Such
in-435
sights would be all the more relevant to this issue given that the benefits of green spaces can often be of higher magnitude for deprived populations. For instance, the WHO report Urban green spaces and health (2016) reviews stud-ies finding that the effects of green spaces on health are of higher magnitude for deprived populations in England (Mitchell and Popham, 2008), the United
440
Kingdom (Lachowycz and Jones, 2014), China (Xu et al., 2017) and in Europe as a whole (Mitchell et al., 2015). Conceptually, these considerations could be integrated into an overall assessment by replacing the proposed multidimen-sional inequality index with a multidimenmultidimen-sional social welfare measure (see, e.g., Cowell, 2000). However, this would require further capacity to evaluate
green-445
space-related ecosystem services and a clear understanding of how inequalities are to be traded off against efficiency considerations.
Many alternative indicators have been proposed to measure the natural fea-tures of the urban environment that generate ecosystem services, such as the “greenness” of the living environment (Gascon et al., 2016) or the number of
450
street trees (Baro et al., 2019). The 300-meter buffer is also debatable, especially in rural contexts where most households own a car (INSEE, 2016). Another op-tion would have been to consider that a census tract is deprived of access to green spaces if there is neither a small green space close to the place of residence nor a larger green space farther from the place of residence. The ”Plan Vert”
455
(”Green Plan”) of the Ile-de-France region adopts this kind of approach.18 This approach would allow for a population that lives close to large urban parks or forest to appear as favoured in terms of access to green spaces, even if they do not fulfil the 300 meters/1.5 hectares criterion. However, given the lack of evi-dence on the relevance of one indicator in particular, we have chosen to remain
460
as general as possible, using an intuitive and broadly used indicator. Devel-opment could be required to improve the access-to-green-space index chosen in this study.
18The ”Plan Vert” considers a census tract to be deprived of access to green spaces if there
is neither a green or wooded area open to the public at less than 200 meters, nor a green space larger than 1 hectare to 10 hectares at less than 300 meters, nor a green space from 10 to 30 hectares at less than 600 meters, nor a green space of more than 30 hectares at less than 1,200 meters.
Further research could account for the quality of green spaces, as the pop-ulation’s preferences regarding green spaces depend, for instance, on the type
465
of landscape or vegetation. A recent choice experiment in the Ile-de-France (Ta et al., 2020) shows that citizens’ willingness to accept spending time travelling to urban nature areas varies considerably according to their natural attributes (e.g., canopy coverage, water). Refined indicators could also reflect the fact that the benefits provided depend on the socioeconomic characteristics of the
470
population on the demand side. The same choice experiment shows that citi-zens’ willingness to accept spending time travelling to urban nature areas varies according to their socioeconomic characteristics. In a similar vein, Cole et al. (2019) have shown that the health benefits provided by green spaces depend on the socioeconomic composition of the neighbourhoods: greater exposure to
475
green space is significantly associated with lower odds of reporting poor health but only for those living in gentrifying neighbourhoods.
Some analyses could complement our well-being analyses. First, the long-term effects of urban greening policies should be considered in future research. For instance, “green gentrification” means that urban greening may increase
480
rents and attract wealthier residents to a previously polluted or disenfran-chised neighbourhood. Examples of green gentrification have been analysed in Barcelona (Anguelovski, 2018) and New York (Wolch et al., 2014). The crite-rion we developed also ignores current land uses. However, converting wasteland or transport infrastructure would have different indirect impacts on well-being.
485
Further research is required to refine the spatial targeting of urban greening by accounting for current land uses and targeting prior land uses to transform into green spaces within the census tracts. We could use our land use and land cover dataset to estimate the well-being loss induced by urban greening in each census tract that considers the current land use and compare those well-being losses to
490
the well-being gain caused by the increased access to green spaces. Approaches such as optimal land use allocation given a set of objectives, namely the opti-misation of ecosystem services delivery, can be considered a complement to our targeting proposition (Polasky et al., 2008).
5
Conclusions
495
Our study provides a new environmental justice case study in a European con-text. In the context of dense European urban areas, the rural areas close to the city centre are vital in terms of recreational activities, such as outdoor sport and recreation, landscape aesthetics, or nature conservation, but they are under high pressure due to the high population density and urban development (see,
500
e.g., Gant, 2011 for the case of London and its “green belt”). Thus, careful urban planning is required for the development of green infrastructure that is inclusive of the multiple related issues, including economic development and social equity.
More important, this study provides a new methodological approach to
in-505
infras-tructure development while accounting for the multiple dimensions of human well-being with an explicit theoretical basis.
Acknowledgements
This study has been funded by the French Ministry for an Ecological and Solidar-ity Transition (MTES) and the IDEFESE project19 (ADEME, MTES/PUCA and AgroParisTech). We wish to thank Francesc Bar´o, Nadja Kabisch, Jo-hannes Langemeyer and Edyta Laszkiewicz for giving us the opportunity to present this work at the ESP10 world conference and be part of this special issue. We would like to thank the IDEFESE team (Vincent Vigui´e, Perrine Hamel, Lana Coste and Mai-thi Ta) for helpful comments on the manuscript as well as all the stakeholders involved in IDEFESE. We finally thank two anony-mous referees and the editors for their useful feedback and suggestions that led to significant improvements in the manuscript.
References
Aaberge, R., Brandolini, A. (2015). Multidimensional poverty and inequality. In Handbook of income distribution (Vol. 2, pp. 141-216). Elsevier.
Anguelovski, I., Connolly, J.J., Masip, L., Pearsall, H., 2018. Assessing green gentrification in historically disenfranchised neighborhoods: a longitudinal and spatial analysis of Barcelona. Urban Geography, 39, 458–91.
Anderson, E.C., Minor, E.S., 2017. Vacant lots: An underexplored resource for ecological and social benefits in cities. Urban Forestry Urban Greening, 21. Bar´o, F., Calder´on-Argelich, A., Langemeyer, J., Connolly, J.J.T., 2019. Under one canopy? Assessing the distributional environmental justice implications of street tree benefits in Barcelona. Environmental Science and Policy 102, 54-64. Bourguignon, F., 1999. Comment on ’Multidimensioned approaches to welfare analysis’ by E. Maasoumi. In: Silber, J. (Eds.), Handbook of income inequality measurement. Kluwer Academic, London, pp. 477-84.
Brueckner, J.K., Thisse, J.F., Zenou., Y., 1999. Why Is Central Paris Rich and Downtown Detroit Poor? An Amenity-Based Theory. European Economic Review 43 (1): 91–107.
Boland, P. J., Proschan, F. (1988). Multivariate arrangement increasing func-tions with applicafunc-tions in probability and statistics. Journal of Multivariate Analysis, 25(2), 286-298.
Cabral, P., Feger, C., Levrel, H., Chambolle, M., Basque, D., 2016. Assessing the impact of land-cover changes on ecosystem services: A first step toward integrative planning in Bordeaux, France. Ecosystem Services, 22:318–327. Campbell, L. K., Svendsen, E. S., Sonti, N. F., Johnson, M. L. (2016). A so-cial assessment of urban parkland: Analyzing park use and meaning to inform management and resilience planning. Environmental Science Policy, 62, 34-44.
Chavis, B.F., Lee, C., 1987. Toxic Wastes and Race in the United States. New York: United Church Christ.
Cohen, M., Baudoin, R., Palibrk, M., Persyn, N., Rhein, C., 2012. Urban biodi-versity and social inequalities in built-up cities: new evidences, next questions. The example of Paris, France. Landscape and Urban Planning 106, 277–287. Cole, H.V.S., Triguero-Mas, M., Connolly, J.J.T., Anguelovski, I, 2019. Deter-mining the health benefits of green space: Does gentrification matter? Health Place, 57, 1-11.
Coombes, E., Jones, A.P., Hillsdon, M., 2010. The relationship of physical ac-tivity and overweight to objectively measured green space accessibility and use, Social Science and Medicine, vol. 70 6, 816-22.
distri-bution, 1, 87-166.
Dalton, H., 1920. Measurement of the inequality of incomes. The Economic Journal, 30(9), 358-361.
Decancq, K., Fleurbaey, M., Schokkaert, E., 2015. Inequality, income, and well-being. In Handbook of income distribution (Vol. 2, pp. 67-140). Elsevier. Decancq, K., Lugo, M.A., 2012. Inequality of Well-being: a Multidimensional Approach. Economica, 79, 721-746.
Decancq, K., Lugo, M. A., 2013. Weights in multidimensional indices of well-being: An overview. Econometric Reviews, 32(1), 7-34.
de Vries, S., van Dillen, S.M.E., Groenewegen, P.P., Spreeuwenberg, P., 2013. Streetscape greenery and health: stress, social cohesion and physical activity as mediators. Social Science and Medicine, 94:26–33.
de Vries, S., Verheij, R.A., Groenewegen, P.P., Spreeuwenberg, P., 2003. Natu-ral environments—healthy environments? An exploratory analysis of the rela-tionship between greenspace and health. Environment and Planning A, 35:1717–31. European Union (2013). Building a Green Infrastructure for Europe. Office of publication of the European Union. Brussels, Belgium.
Faburel, G., Gueymard, S., 2008. In´egalit´es environnementales en r´egion Ile-de-France : le rˆole structurant des facteurs n´egatifs de l’environnement et des choix politiques aff´erents. Espace populations soci´et´es, vol. 1, 159-72.
Gajdos, T., Weymark, J.A., 2005. Multidimensional generalized Gini indices. Economic Theory, 26, 471–496.
Gant, R.L., Robinson, G.M., Fazal, S., 2011. Land-use change in the ‘edge-lands’: policies and pressures in London’s rural–urban fringe. Land Use Policy 28, 266–279.
Gascon, M., Triguero-Mas, M., Mart´ınez, D., Dadvand, P., Rojas-Rueda, D., Plas`encia, A., Nieuwenhuijsen, M.J., 2016. Residential green spaces and mor-tality: a systematic review. Environmental International, 86, 60–67.
Gould, R. K., Morse, J. W., Adams, A. B. (2019). Cultural ecosystem services and decision-making: How researchers describe the applications of their work. People and Nature, 1(4), 457-475.
Grant, M., Bird, C., Marno, P., 2012. Health inequalities and determinants in the physical urban environment: Evidence briefing. Bristol: WHO Collaborat-ing Centre for Healthy Urban Environments, University of the West of England.
Harlan, S.L., Brazel, A.J., Prashad, L., Stefanov, W. L., Larsen, L., 2006. Neighborhood microclimates and vulnerability to heat stress. Social Science and Medicine, 63, 2847-63.
Hartig, T., Mitchell, R., De Vries, S., Frumkin, H., 2014. Nature and Health. Annual Review of Public Health, 35, 207-228.
Heynen, N., Perkins, H.A, Roy, P., 2006. The Impact of Political Economy on Race and Ethnicity in Producing Environmental Inequality in Milwaukee. Urban Affairs Review, 42(1), 3–25.
IAURIF, 1995. R´ef´erentiel de densit´es et de formes urbaines.
Jenerette, G.D., Harlan, S.L., Stefanov, W.L., Martin, C.A., 2011. Ecosystem services and urban heat riskscape moderation: water, green spaces, and social inequality in Phoenix, USA. Ecological Applications, 21, 2637-2651.
Kabisch, N., Haase, D., 2014. Green justice or just green? Provision of urban green spaces in Berlin. Landscape and Urban Planning 122, 129–139.
Kolm, S.C., 1977. Multidimensional egalitarianisms. Quarterly Journal of Eco-nomics, 91(1), 1–13.
Lachowycz, K., Jones, A.P., 2011. Green space and obesity: a systematic review of the evidence. Obesity Reviews, 12.
Levrel H., Cabral P., Feger C., Chambolle M., Basque D., 2017. How to over-come the implementation gap in ecosystem services? A user-friendly and inclu-sive tool for an urban case study. Land Use Policy, 68, 574-584.
Landry, S.M., Chakraborty, J., 2009. Street trees and equity: evaluating the spatial distribution of an urban amenity. Environment and planning, 41(11), 2651–2670.
Leong, M., Dunn, R.R., Trautwein, M. D., 2018. Biodiversity and socioeco-nomics in the city: a review of the luxury effect. Biology Letters, 14.
Low, S., 2013. Public space and diversity: Distributive, procedural and interac-tional justice for parks. In: Young, G., and Stevenson, D., (eds.), The Ashgate Research companion to planning and culture, p. 295–310. Surrey, UK: Ashgate Publishing.
Lugo, M.A., 2007. Comparing Multidimensional Indices of Inequality: Methods and Application. In J. Bishop and Y. Amiel (eds.), Inequality and Poverty – Pa-pers from the Society for the Study of Economic Inequality’s Inaugural Meeting. Research On Economic Inequality, vol. 14, 213–236. Amsterdam: Elsevier JAI. Maasoumi, E., 1986. The Measurement and Decomposition of Multi–Dimensional Inequality. Econometrica, 54, 991–997.
Maasoumi, E., 1999. Multidimensioned Approaches to Welfare Analysis. In J. Silber (ed.), Handbook of Income Inequality Measurement, 437–477. Boston: Kluwer.
Mairie de Paris, 2019. Des forˆets urbaines bientˆot sur 4 sites embl´ematiques. www.paris.fr/pages/des-forets-urbaines-bientot-sur-quatre-sites-emblematiques-6899 (accessed on 20th August 2019).
Millenium Ecosystem Assessment, 2005. Ecosystems and Human Well-Being. World Resources Institute, Washington, DC.
Mitchell, R., Popham, F., 2008. Effect of exposure to natural environment on health inequalities: an observational population study. The Lancet, 372:1655–60. Mitchell, R.J., Richardson, E.A., Shortt, N. K., Pearce, J.R., 2015. Neigh-borhood Environments and Socioeconomic Inequalities in Mental Well-Being. American Journal of Preventive Medicine, 49(1):80-4.
Naess, O., Piro, F.N., Nafstad, P., Smith, G.D., Leyland, A.H., 2007. Air pollu-tion, social deprivapollu-tion, and mortality: a multilevel cohort study. Epidemiology, 18, 686-94.
Niemel¨a, J., Saarela, S., S¨oderman, T. et al., 2010. Using the ecosystem services approach for better planning and conservation of urban green spaces: a Finland case study. Biodiversity Conservation 19, 3225–3243.
Polasky, S., Nelson, E., Camm, J., Csuti, B., Fackler, P., Lonsdorf, E., Mont-gomery, C., White, D., Arthur, J., Garber-Yonts, B., Haight, R., Kagan, J., Starfield, A., Tobalske, C., 2008. Where to put things? Spatial land manage-ment to sustain biodiversity and economic returns. Biological Conservation 141, 1505-1524.
Pigou, A.C., 1912. Wealth and Welfare. Macmillan, London.
Schaeffer, Y., Tivadar, M., 2019. Measuring Environmental Inequalities: In-sights from the Residential Segregation Literature. Ecological Economics, vol. 164, 106329.
Stiglitz, J.E., Sen, A., Fitoussi, J.P., 2009. Rapport de la Commission sur la mesure des performances ´economiques et du progr`es social.
Ta, M.-T, Tardieu, L., Levrel, H. (2020). Specifying preference heterogeneity regarding natural attributes of urban green spaces to inform renaturation poli-cies. CIRED Working Paper n 2020-78.
Tsui, K.Y., 1999. Multidimensional inequality and multidimensional general-ized entropy measures: An axiomatic derivation. Social Choice and Welfare, 16: 145-57.
United Nations. 2015. Sustainable development goals. United Nations.
Ward Thompson, C., Roe, J., Aspinall, P., 2013. Woodland improvements in deprived urban communities: What impact do they have on people’s activities and quality of life? Landscape and Urban Planning, 118, 79-89.
WHO Regional Office for Europe, 2016. Urban green spaces and health. Wolch, J.R., Wilson, J.P., Fehrenbach, J., 2005. Parks and park funding in Los Angeles: An equity-mapping analysis. Urban Geography, 26(1), 4–35.
and environmental justice: the challenge of making cities ’just green enough’. Landscape and Urban Planning, 125: 234-244.
Xu, L., Ren, C., Yuan, C., Nichol, J.E., Goggins, W.B., 2017. An Ecological Study of the Association between Area-Level Green Space and Adult Mortality in Hong Kong. Climate, 5, 55.
Appendix
A
A review of existing multidimensional inequality
in-dices
This analysis presents and discusses the fairness properties of existing multidi-mensional inequality indices in order to motivate the choice of an index on a sound basis.
A.1 Formal framework
We consider a population N . It is composed of n individuals denoted by i. Individual being is measured of a set K of k dimensions of individual well-being denoted by j. For instance the first dimension could be individual income. A matrix X = (xij)i∈N,j∈K describes a situation, where xij ∈ R+corresponds
to the value of the j-th dimension of well-being experienced by individual i. A multidimensional inequality index I associates for any situation described by X ∈ Rn×k++ a positive number I(X). The greater this number, the greater
the inequality. A.2 Properties
Properties convey the intuition about how to assess multidimensional inequali-ties. They are formalized as axioms to be imposed on indices.
Sensitivity to inequality-reducing transfers
This requirement conveys the very basis of what we mean by ”inequality”. With unidimensional individual measures of well-being, wealth for instance, it roughly says that taking to a rich person to give to a poor person decreases inequalities. This is the intuition formalized by the Pigou-Dalton principle, which plays a central role in the characterization of unidimensional inequality indices. When well-being is considered as multidimensional, the generalization faces the diffi-culty of the ambiguous evaluation of transfer along a single dimension.
A possible generalization to the multidimensional framework states that, if a uniform mean-preserving averaging is carried out in all dimensions, the resulting features lower inequalities. This property is called the Uniform Majorization principle (UM)20.
Formally, an index I satisfies CIM if and only if for all distribution matrices X and Y in Rn×k++ , if for any n × n bistochastic matrix B, BX 6= X and BX is
not a permutation of X, then I(BX) > I(X). Sensitivity to correlations
Many environmental justice concerns start from the observation that the pop-ulations that experience a degraded environment are also disadvantaged with regards to other dimensions. In France, the Commission for the measurement of social progress also recommended to account for correlations among dimensions in the measurement of inequalities (Stiglitz, Sen and Fitoussi, 2009). In order to reflect these concerns, the index chosen shall be sensitive to correlation between dimensions of well-being.
Building on Boland and Proschan (1988), Tsui (1999) proposed the following requirement: a distribution shall be preferred to one in which the distributional profiles in all dimensions are unaltered, but where the dimensions are permuted between individuals so that correlations between well-being levels are reduced. This property is called the Correlation Increasing Majorization (CIM)21.
While other, weaker, requirements have been proposed in the literature22, CIM
seems most in line with the central concern to avoid reinforcing cumulative in-equalities.
Decomposability
Ideally, we would also like our multidimensional index of inequality to be de-composable across subpopulations (on N) and/or dimensions of well-being (on K). This would ease the description and interpretation of the results.
In the literature, this requirement has mostly been imposed on subpop-ulations23. For instance Tsui (1999) defines ”decomposability” (DC) as the possibility to decompose an index as a function of the same index computed separately on two subpopulations, the sizes of these populations and the means of well-being levels in each subpopulation on all the dimensions of well-being. This corresponds to decomposability across subpopulations (on N). In our case, this form of decomposability is appealing as it allows to investigate the relative role of a given subpopulation on inequalities and to decompose the relative role of within-group and between-group inequalities in the overall assessment.
A similar requirement can be imposed across dimensions of well-being. ”De-composability across dimensions of well-being” requires that the index can be disaggregated as a function of unidimensional indices for individual dimensions and a measure of association between these dimensions. This requirement was
21See Boland and Proschan (1988) or Tsui(1999) for a formal description.
22For instance, Decancq (2012) proposed the ”Unfair Rearrangement” (UR) principle. This
principle requires that the any distribution is deemed more equal than one in which the distributional profiles in all dimensions of well-being are unaltered, but where the rank of individual on well-being dimensions are perfectly correlated.
studied by Gajdos and Weymarck (2005) who propose a set of indices which satisfy this requirement along with others24.
Robustness
Ideally, we would also like our multidimensional index of inequality to be robust to irrelevant changes in the description of a situation.
One first requirement is that the index shall not vary depending on the scale of measurement. For instance, income could be measured in dollars or in euros. The ”strong ratio scale invariance” (SRSI) principle requires that for any multi-plicative rescaling of units, the value of the index shall not vary25. However, the practical relevance of such an invariance requirement was questioned by Bour-guignon (1999). He emphasized the potential relevance of multiplicative change in an attribute to the evaluation of multidimensional inequalities. Furthermore, in cases where welfare dimensions are weighted through exogenous parameters, a change in unit could be offset by an adjustment of weights.
Similarly, we may be willing to impose invariance to translation. The ”strong translation invariance” (STI) principle requires that for any additive re-scaling of well-being measures, the value of the index shall not vary26. Another require-ment is that the index shall not vary when the population is duplicated without changing the distribution of attribute. This requirement is called ”replication invariance” (RI)27. although it is intuitively appealing, the practical interest of
these requirements is unclear.
Finally, another requirement is that small changes in the situation do not lead to abrupt changes in the index. This is the ”continuity” requirement, which is satisfied by all the multidimensional inequality indices explored in the litera-ture.
Summary
Given the intended use of the index, we require the index to satisfy the following set of properties:
• The uniform majorization principle (UM); • The correlation majorization principle (CIM);
24However, these indices which sequentially aggregate information across individuals before
aggregating the information across dimensions, do not use the information on correlations and fail to meet CIM.
25See Tsui (1999) for a formal expression of this requirement. Decancq (2012) also proposes
a weaker version in which this robustness is only required for a re-scaling of well-being measure by a common parameter. Such a requirement is of little interest in our case as it does not allow robustness in the choice of units.
26Decancq (2012) proposes a weaker version in which this robustness is only required for an
additive re-scaling of well-being measure by a common parameter. Such a requirement is of little interest in our case.
• Decomposability across subpopulations (DC).
In the next subsection, we present and discuss existing indicator with regards to these requirements.
A.3 Indices
Table 2 presents the main families of indices identified in the literature along with their known properties. Among the set of indices considered, some ap-proaches first aggregate sequentially individual well-being levels into a single value and then derive an inequality index of these values (Maasoumi, 1986 ; Tsui, 1999 ; Bourguignon, 1999 ; Decancq, 2012). Other first derives inequal-ity indices on each dimension of welfare and then aggregate these indices into a single index (Gajdos, 2005, Decancq, 2012). These two approaches do not exhaust the set of possibilities. However, they reflects the state of the art on these indicators.
The properties required lead us to focus on the families proposed by Bour-guignon (1999) and Tsui (1999) with accurate restrictions on parameters. For practical purpose, we choose the former family.
The definition of an index within this family requires to define the following set of parameters, while respecting specific constraints in order to ensure the desired properties. Parameters and associated constraints are (i) weights wkon
well-being dimensions, (ii) a degree of substitutability β between them (with 0 < β < 1), and (iii) a degree of inequality aversion α (with α < β).
Index Expression Prop erties P arameters Reference Generalized en-trop y indices of individual w elfare 1 α (1+ α ) P N ( ui U ) 1+ α − 1 ui = [ P K wj x β ]ij 1 β U = P N ui UM CIM Decomp osable on N α (inequalit y a v ersion) β (substitutabilit y) w (w eigh ts on K) Maasoumi, 1986 Generalized en-trop y indices of w ell-b eing dimen-sions ρ n P N [ Q K ( xij xj ) cj − 1] UM CIM if ρc j cj 0> 0 Decomp osable on N cj Tsui, 1999 Dalton indices of individual w elfare 1 − 1 n P N [ P K ( wj x β ij )] α β [ P K ( wj xj β)] α β UM if α < 1 and β < 1 CIM if 0 < α < 1 and α < β Decomp osable on N α (inequalit y a v ersion) β (substitutabilit y) w (w eigh ts on K) Bourguignon, 1999 HDI-lik e ge n e ral-ized Gini ind ic es 1 − [ P K wj ( P N aij ∼ xij ) β ] 1 β [ P K wj xj β] 1 β UM CIM Decomp osable on N aij β (substitutabilit y) w (w eigh ts on K) Ga jdos and W eymarc k, 2005 Sp ecific S-Gini in -dices 1 − [ P K wj ( P N [( r i j )n α− ( r i j− 1 n ) α]x ij ) β] 1 β [ P K wj xj β] 1 β UM if α > 1 CIM Decomp osable on N α (inequalit y a v ersion) β (substitutabilit y) w (w eigh ts on K) Decancq, 2012 Individualistic S-Gini indices 1 − P N [( r i )n α− ( r i− 1 n ) α]( P K wj x β ij ) 1 β [ P K wj xj β] 1 β UM if α > 1 and β < 1 UR under restric-tiv e cond itions on α Decomp osable on N α (inequalit y a v ersion) β (substitutabilit y) w (w eigh ts on K) Decancq, 2012
T able 2: Existing m ultidimensional inequalit y indices Remarks : • F or clarit y reas on s, notations ha v e b een harmonized. • ∀ j = [1 , ..., k ], wj > 0 and P K wj = 1. • xj = 1 N P N xij is the a v erage lev el of w ell-b eing on dimension k. • ∼ xj is a p erm utation of x suc h that ∼ x1 j ≥ ∼ x2 j ≥ ... ≥ ∼ xnj • aij are suc h that a.j are increasing • r i j is the ranking of individual i accordin g to w ell-b eing d ime n sion j • r iis the ranking of individual i according to s i= ( P K wj x β )ij 1 β .