HAL Id: hal-03126702
https://hal.univ-reunion.fr/hal-03126702
Submitted on 1 Feb 2021
HAL is a multi-disciplinary open access archive for the deposit and dissemination of sci-entific research documents, whether they are pub-lished or not. The documents may come from teaching and research institutions in France or abroad, or from public or private research centers.
L’archive ouverte pluridisciplinaire HAL, est destinée au dépôt et à la diffusion de documents scientifiques de niveau recherche, publiés ou non, émanant des établissements d’enseignement et de recherche français ou étrangers, des laboratoires publics ou privés.
mellifera L.) in the tropics: Morphological changes
related to genetics in Mauritius Island (South-West
Indian Ocean)
Julien Galataud, Hélène Delatte, Maéva Techer, Christophe Simiand,
Preeaduth Sookar, Bernard Reynaud, Johanna Clémencet
To cite this version:
Julien Galataud, Hélène Delatte, Maéva Techer, Christophe Simiand, Preeaduth Sookar, et al.. When European meets African honeybees (Apis mellifera L.) in the tropics: Morphological changes related to genetics in Mauritius Island (South-West Indian Ocean). PLoS ONE, Public Library of Science, 2020, 15 (11), pp.e0242053. �10.1371/journal.pone.0242053�. �hal-03126702�
RESEARCH ARTICLE
When European meets African honeybees
(Apis mellifera L.) in the tropics: Morphological
changes related to genetics in Mauritius
Island (South-West Indian Ocean)
Julien Galataud1*, He´lène Delatte2, Mae´va Ange´lique TecherID3, Christophe Simiand2, Preeaduth Sookar4, Bernard Reynaud5, Johanna Cle´mencetID1
*
1 Universite´ de La Re´union, UMR PVBMT, La Re´union, France, 2 CIRAD, UMR PVBMT, 7 chemin de l’Irat, Ligne Paradis, Saint Pierre, La Re´ union, France, 3 Okinawa Institute of Science and Technology, Okinawa, Japan, 4 Ministry of Agro Industry and Food Security, Agricultural Services, Reduit, Mauritius, 5 Universite´ de La Re´ union, UMR PVBMT, Saint Pierre, La Re´union, France
*julien.galataud@univ-reunion.fr(JG);johanna.clemencet@univ-reunion.fr(JC)
Abstract
The previous genetic characterization of the honeybee population of Mauritius Island (Indian Ocean) revealed an ongoing process of hybridization between the first established African subspecies Apis mellifera unicolor and recently imported European subspecies (A. m. ligus-tica, A. m. carnica and A. m. mellifera). This context offers the rare opportunity to explore the influence of hybridization between African and European honeybees on phenotypic traits out of the case largely studied of the Africanized honeybee (hybrid between A. m. scu-tellata from South Africa and European subspecies). We thus conducted geometric morpho-metric analyses on forewings of 283 workers genetically characterized at 14 microsatellite loci to evaluate (1) if the morphological variability coincides well with the neutral genetic vari-ability, (2) if hybrids exhibited rather parental, intermediate or transgressive traits, and (3) to test if fluctuating asymmetry (FA) of size and shape, as a measure of developmental stabil-ity, was elevated in hybrids (due to genetic stress) and/or European bees (due to unsuitable environment) compared to African bees. A strong concordance was found between morpho-logical variability and neutral genetic variability, especially for wing shape, based on partial least-square analyses (PLS). However, on average, the morphology of hybrids was more similar to the African bees, potentially reflecting the dynamics and direction of introgression. Significant FA for wing size as well as wing shape was detected, suggesting the overall pres-ence of stress during the development of the studied individuals. In contrast, the asymmetry levels do not differ according to the ancestry (African, European or hybrid) of the individuals. Therefore, if ongoing hybridization contributed to increasing the genetic and phenotypic diversity of the populations and influences its adaptive potential, developmental stressors could not be identified and their evolutionary consequences remain uncertain.
a1111111111 a1111111111 a1111111111 a1111111111 a1111111111 OPEN ACCESS
Citation: Galataud J, Delatte H, Techer MA, Simiand C, Sookar P, Reynaud B, et al. (2020) When European meets African honeybees (Apis
mellifera L.) in the tropics: Morphological changes
related to genetics in Mauritius Island (South-West Indian Ocean). PLoS ONE 15(11): e0242053.
https://doi.org/10.1371/journal.pone.0242053
Editor: Arnar Palsson, University of Iceland, ICELAND
Received: October 12, 2019 Accepted: October 27, 2020 Published: November 19, 2020
Copyright:© 2020 Galataud et al. This is an open access article distributed under the terms of the
Creative Commons Attribution License, which permits unrestricted use, distribution, and reproduction in any medium, provided the original author and source are credited.
Data Availability Statement: All relevant data are within the manuscript and itsSupporting informationfiles.
Funding: This study was funded by the CIRAD, the ‘Conseil Re´gional de La Re´union’ and the European Agricultural Fund for Rural Development (EAFRD). J Galataud is a recipient of a PhD fellowship from the doctoral school of La Re´union University. The authors acknowledge the Plant Protection Platform
Introduction
Hybridization, defined as the contact between previously isolated lineages that result in viable and—to a varying degree—fertile offspring [1], has been extensively facilitated by human movements and activities, which intensify and ignore natural boundaries [2,3]. The recent establishment of gene flows through the dissemination—voluntary or not—of individuals out of their native range may result in increased phenotypic variation, especially in closely related populations with weak or non-existent reproductive barriers. Increased phenotypic variation is typically observed among individuals as a consequence of augmented genetic variability. The import of new alleles and the consequent novel genomic combinations formed by admix-ture and repeated backcrossings can generate a variety of phenotypes in the hybrid offspring. These can range from parental types to intermediate or transgressive (extreme) forms, depend-ing on both gene interactions (e.g. additive effects, over-dominance, epistasis), environmental influences on gene expression (external factors, e.g. temperatures, or internal factors, e.g. metabolism), and the relative contribution of natural selection and stochastic processes (dis-persal and drift). Inbreeding and exposure to unfamiliar environmental conditions may also affect the ability of individuals to undergo stable development, through disruption of
coadapted gene complexes in hybrid offspring, and as a consequence of radical environmental changes for imported genomes [4,5]. Development instability (DI) refers to slight and random deviations to perfect left-right symmetry in structures, and is classically measured as fluctuat-ing asymmetry (FA). In different taxa, excess of FA could be associated with (human-medi-ated) genetic [6–10] and environmental [11–14] stresses, and reduced adaptive value or fitness of individuals [15–17]. Thus, relating both components of morphological variation, i.e. between and within individuals variation (via FA), with neutral genetic markers permits
hybrid characterization, and may provide valuable insight on the extent of hybridization as well as the mechanisms shaping hybrid populations.
The biological model we used to address these questions is the Western honeybeeApis mel-lifera, whose distribution is nowadays much influenced by beekeeping activities [18]. Four major evolutionary lineages occupying a wide natural range have been described by combining morphological and molecular approaches (A: African lineage, C and M: West and South-East European lineages, O: Middle East lineage) [19–23]. Nearly thirtyA. mellifera subspecies and
various ecotypes were identified and can supposedly all interbreed due to absent or weak reproductive isolating barriers [24–26]. The highly polyandrous mating system of the honey-bee with its extensive mating flights [27], coupled with large-scale migratory beekeeping and trade-in queens, promoted gene flow and hybridization between formerly isolated honeybee populations within and outside its natural range [18]. The Africanized honeybee (AHB), a hybrid betweenApis mellifera scutellata (native of Africa) and European-derived strains,
which spread across America in a few decades and supplanted the pre-established European colonies, illustrates dramatically how human-induced hybridization can promote diversifica-tion and colonizadiversifica-tion success. The genome of the AHB is characterized by a large predomi-nance of African ancestry [28–31], most likely due to a predisposition of African traits to South American environmental conditions and genetic and behavioral biases that benefit Afri-can alleles [32]. In addition, a positive selection for Europeans-derived alleles has also been highlighted in part of the genome [31]. The AHB therefore owes its success to the human-initi-ated hybridization, pre-adaptations to tropical and subtropical climate, and the adaptive exploitation of imported diversity. Among the traits that characterize the AHB, the size and shape of the wings have proven to be discriminating enough to identify it quickly and effi-ciently [32–35]. Moreover, wing shape of African worker bees would show greater develop-mental stability, which could contribute to asymmetrical gene flow and the prevalence of
(3P, IBISA) where genetic experiments were conducted.
Competing interests: The authors have declared that no competing interests exist.
African ancestry if related to better fitness (e.g., better flight skills) [36]. In short, the evolution-ary trajectory of the American honeybee took a whole new direction following hybridization, and the study of both genetic and phenotypic markers helps to better understanding the mech-anisms underlying this evolutionary shift.
In this study we focused on the honeybee population of Mauritius Island, located in the South-West Indian Ocean, which also experiences ongoing hybridization between African and European lineages. It offers the opportunity to study the effects of relatively recent hybridiza-tion on traits variability in tropical and insular environmental condihybridiza-tions. Latest genetic stud-ies confirmed that the initial honeybee population of Mauritius belongs to the African lineage, closely related toA. m. unicolor [37] subspecies, endemic of Madagascar and established in surrounding archipelagos [38–40]. Mitochondrial signatures of repeated importations of European continental subspecies in the current population have been detected, and the analy-ses of genetic diversity revealed the occurrence of two hybridizing gene pools, with European and African ancestries sampled in near-balanced proportions (about 55% of A lineage, 44% of European C lineage, 1% of European M lineage) [39]. In this paper, morphological variability of Mauritius honeybees was examined on forewings size and venation patterns of the worker honeybeesvia geometric morphometric methods. Geo-morphometrics are now commonly
used in insect micro-taxonomy, and have been proved very effective in the identification of honeybee subspecies, ecotypes and hybrids [20,21,23,41]. We then related between and among individuals variation of morphometric traits with neutral genetic structuring and the degree of hybridization of the individuals previously inferred from Bayesian analysis of micro-satellite markers [40]. The relation between hybridization on developmental instabilities, i.e. individual FA, was also examined on both forewing size and shape.
Materials and methods
Recent genetic work by Te´cher et al. [39,40] has shown that the population of Mauritius con-sists of two hybridizing genetic clusters: one African related toA. m. unicolor, whose origin
(natural or anthropogenic) is not fully elucidated, and another European from successive imports. In order to better depict the honeybee population of Mauritius, the same bees were used for this study. They consist of workers sampled in 2012 in apiaries with 1 to 150 colonies, all managed by humans except for one wild colony. The bees were collected at the entrance or inside the hives, depending on the site. All of this information is compiled inTable 1.
Genetic data
The use of mitochondrial markers (length and sequence of the COI-COII intergenic region [20,42,43]) allowed Te´cher et al. [39] to identify the maternal origin of each individual. Three evolutionary lineages are thus represented in the sample (Table 1): the African lineage A grouping the African subspecies, the European lineage C including subspecies naturally dis-tributed east and south of the Alps, and the European lineage M including subspecies distrib-uted in north and west of Europe [19]. On the other hand, a Bayesian approach involving 14 microsatellite loci (A113, A24, AP55, A88, A28, A29, AP289, AP273, (A) B124, A8, A35, AP33, AP66, and AP43) [40,44] permitted to estimate the degree of hybridization of the individuals. This translates into a hybrid index (HI), which ranges from 0 for African ancestry to 1 for European ancestry. Intermediate values reflect hybridization to varying degrees. For conve-nience, HI was used as a continuous variable or transformed into a discrete variable, depend-ing on the hypothesis tested (seeTable 1and analyzes below). The raw data containing the allele frequencies of each microsatellite marker for each individual was also retrieved for analyzes.
Wing data acquisition
The above-mentioned genetic characterizations were carried out using DNA extracted from the legs of the bees. All remaining biological material was stored in 90% ethanol at -20 ˚ C. Under these conditions, the wings, when not damaged by capture or manipulations, kept their venation pattern intact. Thus, only individuals whose right and left wings were available and correctly preserved were used to perform morphometric measurements. For this, the wings of each individual were cut at their basis, mounted in distilled water on a micrometric slide for scaling, and then photographed with a high-resolution camera mounted on a microscope (Leica DMC5400, Leica Microsystems). Nineteen landmarks were digitized at the vein inter-sections following Smith et al. [45] procedure (Fig 1A). The x and y Cartesian coordinates of each landmark were collected in ImageJ version 1.49u [46] with the Point Picker plugin (http://bigwww.epfl.ch/thevenaz/pointpicker/) [47]. To avoid any user effect, all measurements were made by a single operator. A total of 283 individuals already genetically characterized (lineage, allele frequencies, HI) were thus characterized morphologically. In addition, 36
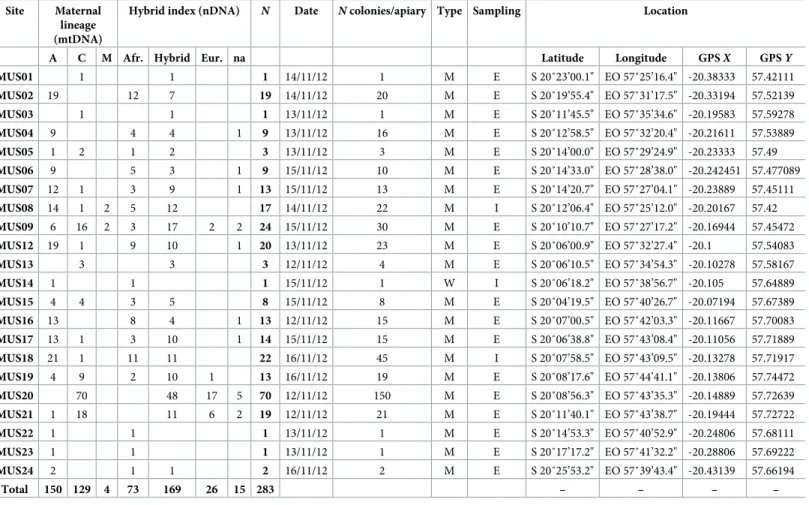
Table 1. Genetic categorization and contextual data on honeybees (Apis mellifera) sampled in Mauritius.
Site Maternal lineage (mtDNA)
Hybrid index (nDNA) N Date N colonies/apiary Type Sampling Location
A C M Afr. Hybrid Eur. na Latitude Longitude GPSX GPSY
MUS01 1 1 1 14/11/12 1 M E S 20˚23’00.1" EO 57˚25’16.4" -20.38333 57.42111 MUS02 19 12 7 19 14/11/12 20 M E S 20˚19’55.4" EO 57˚31’17.5" -20.33194 57.52139 MUS03 1 1 1 13/11/12 1 M E S 20˚11’45.5" EO 57˚35’34.6" -20.19583 57.59278 MUS04 9 4 4 1 9 13/11/12 16 M E S 20˚12’58.5" EO 57˚32’20.4" -20.21611 57.53889 MUS05 1 2 1 2 3 13/11/12 3 M E S 20˚14’00.0" EO 57˚29’24.9" -20.23333 57.49 MUS06 9 5 3 1 9 15/11/12 10 M E S 20˚14’33.0" EO 57˚28’38.0" -20.242451 57.477089 MUS07 12 1 3 9 1 13 15/11/12 13 M E S 20˚14’20.7" EO 57˚27’04.1" -20.23889 57.45111 MUS08 14 1 2 5 12 17 14/11/12 22 M I S 20˚12’06.4" EO 57˚25’12.0" -20.20167 57.42 MUS09 6 16 2 3 17 2 2 24 15/11/12 30 M E S 20˚10’10.7" EO 57˚27’17.2" -20.16944 57.45472 MUS12 19 1 9 10 1 20 13/11/12 23 M E S 20˚06’00.9" EO 57˚32’27.4" -20.1 57.54083 MUS13 3 3 3 12/11/12 4 M E S 20˚06’10.5" EO 57˚34’54.3" -20.10278 57.58167 MUS14 1 1 1 15/11/12 1 W I S 20˚06’18.2" EO 57˚38’56.7" -20.105 57.64889 MUS15 4 4 3 5 8 15/11/12 8 M E S 20˚04’19.5" EO 57˚40’26.7" -20.07194 57.67389 MUS16 13 8 4 1 13 12/11/12 15 M E S 20˚07’00.5" EO 57˚42’03.3" -20.11667 57.70083 MUS17 13 1 3 10 1 14 15/11/12 15 M E S 20˚06’38.8" EO 57˚43’08.4" -20.11056 57.71889 MUS18 21 1 11 11 22 16/11/12 45 M I S 20˚07’58.5" EO 57˚43’09.5" -20.13278 57.71917 MUS19 4 9 2 10 1 13 16/11/12 19 M E S 20˚08’17.6" EO 57˚44’41.1" -20.13806 57.74472 MUS20 70 48 17 5 70 12/11/12 150 M E S 20˚08’56.3" EO 57˚43’35.3" -20.14889 57.72639 MUS21 1 18 11 6 2 19 12/11/12 21 M E S 20˚11’40.1" EO 57˚43’38.7" -20.19444 57.72722 MUS22 1 1 1 13/11/12 1 M E S 20˚14’53.3" EO 57˚40’52.9" -20.24806 57.68111 MUS23 1 1 1 13/11/12 1 M E S 20˚17’17.2" EO 57˚41’32.2" -20.28806 57.69222 MUS24 2 1 1 2 16/11/12 2 M E S 20˚25’53.2" EO 57˚39’43.4" -20.43139 57.66194 Total 150 129 4 73 169 26 15 283 – – – –
MUS01-24, site as designated in [40]; mtDNA, mitochondrial DNA (COI-COII intergenic region); A, African lineage; C, Eastern European lineage; M, Western European lineage; nDNA, nuclear DNA; Hybrid index (HI), Bayesian estimates of individuals’ admixture (see Techer et al. [40]) subdivided into three discrete categories; Afr., “pure” Africans (HI � 0.1); Hybrids (0.1 < HI < 0.9); Eur., “pure” Europeans (HI � 0.9) [59]; na, data not available;N, number of individuals; M,
managed colony; W, wild colony; E, entrance; I; inside.
individuals randomly selected were photographed and digitized twice in separate sessions to quantify measurement errors related to image acquisition and landmark positioning.
Forewing size and shape extraction
Overall wing size was estimated by the centroid size (CS), a measure equal to the square root of the sum of the squared distances between each landmark and the centroid, i.e. the
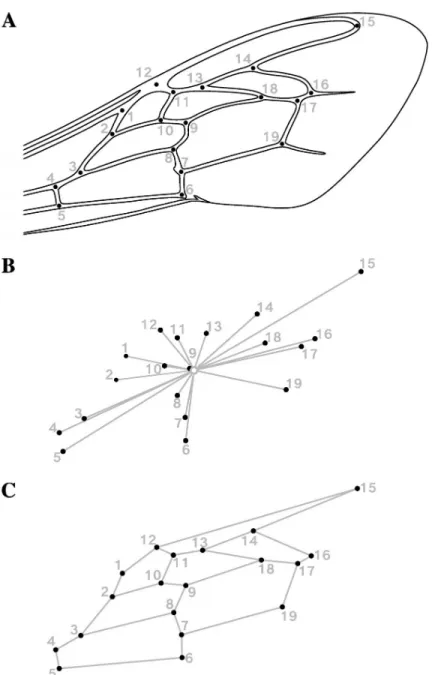
Fig 1. Geometric morphometrics of the forewing venation of honeybee workers (Apis mellifera). (A) Location of
the 19 landmarks digitized on the right and (mirrored) left forewings ofApis mellifera workers, following Smith et al.
[45] procedure. (B) Visual representation of the centroid size as computed for 19 landmarks on a forewing ofApis mellifera. The open circle is the centroid (i.e. the barycenter) of the landmark configuration; the segments connecting
the centroid to the landmarks represent the distances used to compute centroid size. (C) Wireframe visualization of forewing shape. The landmarks are connected with straight lines depicting the wing venation pattern.
barycenter of the landmark configuration (Fig 1B). Wing shape variables were extracted from x and y coordinates of the 19 landmarksvia a generalized least-squares Procrustes
superimpo-sition with the following steps [48,49] (Fig 1C):(1) right and—previously mirrored—left
wings of each individual were centered on their centroid, then(2) normalized to unit
cen-troid-size (CS = 1.0) to remove size and shape association (i.e. isometry), and(3) iteratively
rotated to minimize the sum of squared distances between each configuration and the sample mean. Thus, any difference in Procrustes coordinates of corresponding landmarks between two configurations resulted from (isometry-free) shape differences, expressed in units of Pro-crustes distances (dimensionless). As a consequence of ProPro-crustes superimposition steps, 4 degrees of freedom are lost (two for centering, one for scaling, and one for rotation) resulting in 38–4 = 34 shape space dimensions.
Amounts of among individuals’ variation and asymmetry
The first step consisted in testing the presence of directional and fluctuating asymmetry while accounting for measurement errors relating to both the position and orientation of the wings in the photos and the digitization of the landmarks at vein intersections. An ANOVA on CS for size [50,51] and a Procrustes ANOVA on Procrustes distances for shape [49,52] were therefore conducted on the subsample of 36 individuals whose forewings were photographed and digitized twice. Both analyses follow the same two-way mixed model design and partition the total variation into components of symmetric and asymmetric variation. Following this design, the main random effect ‘individual’ represents the variation among individuals and is computed as individuals’ left-right means (corrected for any type of asymmetry). The second main and fixed effect ‘side’ represents directional asymmetry (DA) and is computed as mean of left-right differences. Fluctuating asymmetry (FA), expressed as individual left-right differ-ences, is represented by the interaction term ‘individual× side’ (a mixed effect). Measurement errors due to imaging (ME1) and digitizing (ME2) are quantified by the variation over repli-cates for each individual and side. Statistical significance of the various effects was assessed with parametric Goodall’sF tests [53], based on summed square Procrustes distances in the case of shape [51]. Ultimately, to determine the proportion of size or shape variation explained by each factor in the whole sample, the same analyzes were conducted on the complete data but in the absence of replicates, after proving the measurement errors as negligible (see
Results). All the analyses mentioned above were conducted with the software MorphoJ (https://www.R-project.org/) [54].
Congruence between morphological and neutral genetic variation
To assess the congruence between morphometric and genetic datasets, we conducted partial least squares (PLS) analyses in MorphoJ using alternatively wings size and shape (i.e., centroid sizes and Procrustes coordinates) against microsatellite allele frequencies. The PLS method is based on a singular value decomposition of the matrix of covariances between two separate blocks of variables [55,56]. It resulted in paired axes uncorrelated and ordered by decreasing singular values, each forming linear combinations of the variables from each dataset and accounting for as much as possible of the overall covariance. The number of axes was equal to the number of dimensions in the smaller dataset (i.e. 1 for size and 34 for shape). The overall association between morphological and genetic datasets was assessed by the Escoufier’s RV coefficient [57], a multivariate generalization of the squared Pearson correlation coefficient (r).
Singular values, correlations between paired PLS axes as well as RV coefficients were statisti-cally tested by randomly permuting the individuals (rows) in the shape block (10,000 itera-tions), so that the covariance structure between blocks was modified without altering the
variance within blocks [55,56]. Additionally, to parallel dominant patterns of covariance between blocks to the major patterns of variation within each block, PLS singular axes were compared to their counterparts from principal component analyses conducted separately on shape and genetic datasets. For this purpose, angles and correlations between corresponding PLS and PCA axes were computed and statistically tested in MorphoJ [58]. Regarding genetic data, the results of multivariate analyses were faced with the Bayesian clustering method by measuring correlation of PLS and PCA scores with hybrid index values.
Effects of hybridization on wing morphology
The hybrid index (HI) was directly exploited to specifically address how the current intraspe-cific admixture between two genetic pools, one prior African related toA. m. unicolor and one
European composed of recently imported subspecies (C and M lineages), affected wings size and shape of honeybees in Mauritius. As a first step, HI was used as a grouping variable to dis-tinct hybridized individuals from non-hybridized. Three clusters were created following Va¨ha¨ and Primmer [59] recommendations: the workers were classified as ‘pure’ Africans if HI was smaller than 0.1 (NAFR= 74), as ‘pure’ Europeans if HI was larger than 0.9 (NEUR= 27), and as
hybrids (NH= 177) if HI was contained between those values [22,60]. This results in means/
medians values of 0.06/0.06 for ‘pure’ Africans, 0.39/0.32 for hybrids, and 0.96/0.97 for ‘pure’ Europeans, denoting that hybrid values are slightly shifted towards the African genetic cluster. A one-way ANOVA with post-hoc tests was conducted to compare group means based on wings size. Regarding wings shape, given the unequal distribution of individuals in different clusters and the high dimensionality of the Procrustes dataset (34 dimensions), a between-group PCA was conducted, as recommended by Mitteroecker and Bookstein [61]. This allowed (1) examining the relative arrangement of the three clusters in a reduced space of two
dimensions, (2) evaluating the significance of group separation, and (3) visualizing related
shape changes. Pairwise mean differences and reliability of classification rates were assessed by a leave-one-out cross-validation and permutation tests (30,000 iterations). To determine if hybrids presented phenotypic transgression, the angle formed by the vectors joining the cluster means (Hybrids—Africans—Europeans: dHAE) in the shape-space was computed and tested. This analyze was achieved in RStudio software (https://www.R-project.org/) [62], using the trajectory.analysis function from the package geomorph [63,64]. Additionally, correlations between size, bgPC1 and bgPC2 scores and HI were estimated.
Effect of hybridization on wing asymmetry
Size FA (fluctuating asymmetry) of each individual was given by the difference between the CS of the left and the right forewing. The amount of shape FA of each individual was synthetized in the form of univariate scores based on either Procrustes distances (Procrustes FA scores) or Mahalanobis distances (Mahalanobis FA scores), which take the covariance structure into account [56,65]. To establish the reliability of these measures (delivered in MorphoJ when per-forming ANOVAs), intraclass correlation coefficients (2,1) were computed in the sub-dataset with repeats [66,67]. The association between the amounts of FA and size variability was then explored with regression analyzes and permutation tests (10,000 iterations). HI was treated as a continuous, rather than a categorical variable to better infer the relationship between the level of hybridization and the amount of developmental instability, while providing precision, flexibility and statistical power compared to ANOVAs [68,69]. In this perspective, linear and quadratic regressions were conducted to find the optimal fit for data trends, comparing
F-ratios and fit indices (AIC, AICc and BIC) for model choice. Developmental instability, mea-sured as FA, could indeed express a variety of patterns, characterized by linearity or
monotonous change towards some specific value [70], depending of the underlying mecha-nisms that drive it.
Results
Estimating measurement errors
Repeated ANOVA measurements were performed on a subsample of 36 honeybees, photo-graphed and digitized twice. The relative contribution of measurement errors (ME) to the total variation for centroid size and shape, due to imaging and landmark digitizing steps (esti-mated by the mean squares (MS)), was small compared to the components of symmetric and asymmetric variation (Table 2). In particular, fluctuating asymmetry (FA), used as an estimate of developmental instability, was found significant, withF ratios sufficiently high to consider
ME as negligible (F > 18 and 64, for shape and size, respectively) [71]. As a result, it was esti-mated that repeated measurements were unnecessary for the whole data set in order to obtain reliable and accurate estimates of FA.
Quantifying among individuals variation and asymmetry
The ANOVAs performed on the whole sample (Table 3) indicated that morphological varia-tion among individuals (‘individuals’ effect) accounts for the largest porvaria-tion of the variavaria-tion in the whole sample (99.27% for size and 91.02% for shape,P < 0.0001). Directional asymmetry
(‘sides’ effect) was found significant only for shape (F = 16.69, P < 0.0001), despite a tiny
con-tribution to sample variability (0.79%). Fluctuating asymmetry also contributes to only 0.72% of size variation, compared to 8.51% for wing shape.
Congruence between morphology and neutral genetic variation
Partial least square (PLS) analyzes were used to measure the congruence of wing size (centroid size), and then wing shape variation (Procrustes coordinates), with microsatellite allele fre-quencies. In both cases, we found a relatively strong overall association between morphological and genetic blocks, resulting in a RV coefficient of 0.29 for size (Pperm< 0.0001) and 0.32 for
shape (Pperm< 0.0001). The PLS analysis conducted between size (one dimension) and
micro-satellites resulted in a single pair of axes whose corresponding PLS scores are moderately and significantly correlated (SV = 220.98,r = 0.58, Pperm< 0.0001). Note that the size vector
ordered individuals according to their wings size, so that size-PLS scores and centroid sizes are interchangeable. The PLS analysis conducted between shape and microsatellites resulted in 34 pairs of PLS axes, of which only the first was found significant, taking up 90.02% of the total covariance. Microsatellite and shape PLS1 scores were also highly correlated (SV1 = 0.014,
r = 0.71, Pperm< 0.0001). When compared to the PCAs (S1andS2Figs) computed separately
on the same data, the major shape and genetic PLS axes appear nearly identical to the corre-sponding first principal components (microsatellite PC1 = 23.35%, shape PC1 = 22.22%), with pairwise correlations displaying values greater than 0.98 and highly significant (P < 0.0001).
Overall, these results suggest that the major dimension of variation between morphological and genetic blocks is equivalent to the dominant variation within the same blocks. The associ-ated patterns illustrassoci-ated inFig 2A and 2Breveal a (essentially) one-dimensional morphoge-netic continuum polarized between African and European lineages and reflecting the ongoing hybridization process. Besides, high similarities found between the hybrid index (HI) and the dominant genetic PCA and PLS axes (r = 0.98, P < 0.0001) prove multivariate analyses as
Effects of hybridization on wing size
The one-way ANOVA conducted on centroid sizes determined that differences exist among clusters, and both Tukey and Games-Howell (equal variances not assumed) post-hoc tests found highly significant differences for all pairwise comparisons of means (Padj< 0.0001). The Table 2. Analysis of variance of forewing size and shape in 36 honeybees photographed and digitized twice.
Size (Centroid size) ANOVA
Effect SS df %Var. MS Goodall’sF P
Individuals 12209246.53 35 96.19% 348835.62 26.50 < 0.0001
Sides 6216.62 1 0.05% 6216.62 0.47 0.4965
Individuals × sides 460811.61 35 3.63% 13166.05 64.80 < 0.0001
ME1: imaging 14626.51 72 0.12% 203.15 11.33 < 0.0001
ME2: landmark digitizing 2581.80 144 0.02% 17.93
Shape (Procrustes distances) Procrustes ANOVA
Effect SS×105 df %Var. MS ×105 Goodall’s F P Individuals 13403.27 1190 88.35% 11.26 9.70 < 0.0001 Sides 119.44 34 0.79% 3.51 3.02 < 0.0001 Individuals × sides 1381.96 1190 9.11% 1.16 18.83 < 0.0001 ME1: imaging 150.97 2448 1.00% 0.06 2.63 < 0.0001
ME2: landmark digitizing 114.90 4896 0.76% 0.02
df, degrees of freedom (in Procrustes ANOVA, df is that for conventional ANOVA multiplied by the shape dimension, i.e. 34); SS, sum of squares; MS, mean squares; % Var., percentage contributions of each variance component to the total variance, computed from SS values.
‘Individuals’: variation among individuals (i.e. symmetric component); ‘Sides’: directional asymmetry (DA), ‘individuals x sides’ interaction: fluctuating asymmetry (FA).
FInd.= MSInd./ MSInd. × Sides
FSides= MSSides/ MSInd. × Sides
FInd. × Sides= MSInd. × Sides/ MSME1
FME1= MSME1/ MSME2
https://doi.org/10.1371/journal.pone.0242053.t002
Table 3. Analysis of variance for both forewing size and shape of honeybee workers (Apis mellifera).
Size (Centroid size) ANOVA
Effect SS df %Var. MS Goodall’sF P
Individuals 21922690.35 301 99.27% 72832.86 137.46 < 0.0001
Sides 471.81 1 0.002% 471.81 0.89 0.3461
Individuals × sides 159485.47 301 0.72% 529.85
Shape (Procrustes coordinates) Procrustes ANOVA
Effect SS (×105) df %Var. MS ×105 Goodall’s F P Individuals 27146.97 10234 91.02% 2.65 10.69 < 0.0001 Sides 140.00 34 0.47% 4.12 16.60 < 0.0001 Individuals × sides 2538.83 10234 8.51% 0.25
df, degrees of freedom (in Procrustes ANOVA, df is that for conventional ANOVA multiplied by the shape dimension, i.e. 34); SS, sum of squares; MS, mean squares; % Var., percentage contributions of each variance component to the total variance, computed from SS values.
‘Individuals’: variation among individuals (i.e. symmetric component); ‘Sides’: directional asymmetry (DA), ‘individuals x sides’ interaction: fluctuating asymmetry (FA).
FInd.= MSInd./ MSInd. × Sides
FSides= MSSides/ MSInd. × Sides
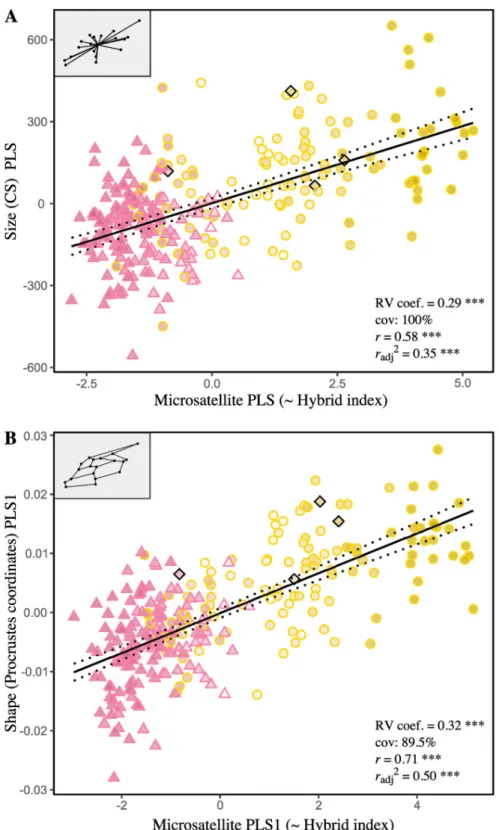
Fig 2. Patterns of covariation between forewing morphology and neutral genetic variation assessedvia partial
least-square analyses (PLS). (A) Scatter plot of the PLS of the forewing size (centroid size) and neutral genetic variation (14 microsatellite allele frequencies). The analysis resulted in one significant pair of PLS axes (10,000 permutations) accounting for 100% of covariation since size is a one-dimensional variable. (B) Scatter plot of the PLS of the forewing shape (Procrustes coordinates) and neutral genetic variation (14 microsatellite allele frequencies). The first pair of PLS axes is shown, which is also the only pair found significant by the permutation test (10,000 perm.). In the graphs, each point represents one individual. The symbol and outline color represents the maternal origin of individuals (pink circle: African lineage, yellow circle: European C lineage, black diamond: European M lineage). The
African cluster presents the smaller wings (6453μm, sd = 145 μm, se = 17 μm, ci = 33 μm), the greatest ones corresponding to the European cluster (6778μm, sd = 195 μm, se = 38 μm, ci = 77μm), and hybrids occupying an intermediate place closer to the African cluster (6560μm, sd = 176 μm, se = 13 μm, ci = 26 μm). Finally, as expected, wing size—treated as continuous—is positively correlated with HI (r = 0.59, P < 0.0001) and coincides well with the
continuum of introgression between African and European genetic pools (Fig 3A).
Effects of hybridization on wing shape
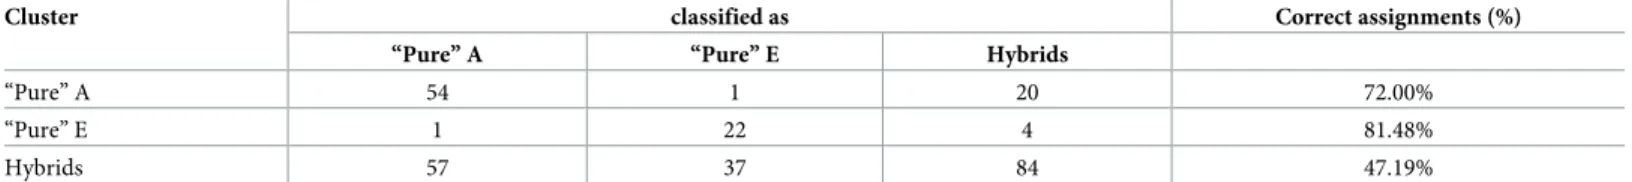
The between-group PCA conducted on wings shape (left-right mean of Procrustes coordi-nates) resulted in two orthogonal axes representing the Euclidean distances among the three cluster means. The first axis (bgPC1), accounts for 90.69% of the variation between group means, against 9.31% for bgPC2. Cross-validated classification revealed poor overall accuracy with only 57.14% of individuals correctly classified, which is largely attributable to the strong overlap of the hybrids on other clusters (correct classification rate rises to 90.20% when hybrids are excluded). ‘Pure’ Africans and ‘pure’ Europeans appear more distinct, and each presents a single misclassified individual attributed to the opposite group (‘pure’ Afr.: 72.97%, ‘pure’ Eur.: 81.48%) (Table 4). The trajectory analysis failed to find an angle statistically different from 0˚ between the vector connecting the mean shapes of the three clusters ( dHAE ¼ 26:13�
,P = 0.29). Instead, it revealed significant differences of magnitudes (i.e.
vec-tors size), suggesting intermediacy rather than transgressive phenotypes in hybrids shape with greater proximity toward ‘pure’ Africans (A—E: 0.020; A—H: 0.009; E—H: 0.013,P < 0.0001
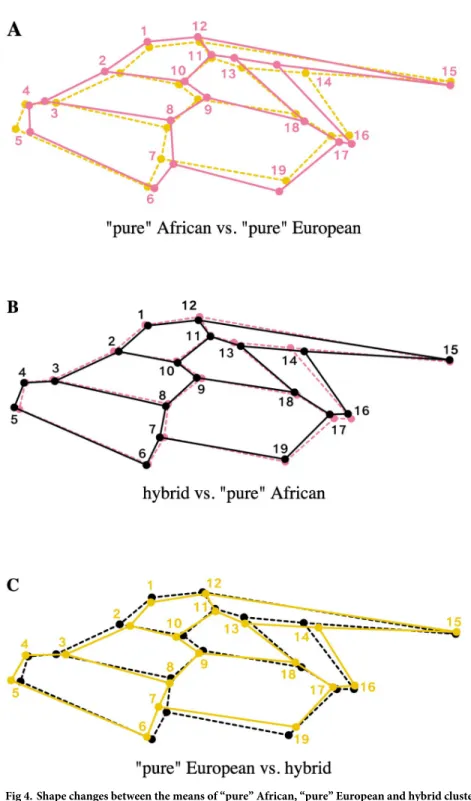
for all distances). The associated shape changes as captured by bgPCA components are depicted in the form of wireframe graphs [72] inFig 4. Notice that the joint analysis of size and shape (not shown) did not improved classification rates [61]. Again, strong association is observed between bgPC1 and HI (r = 0.70, P < 0.0001), while it is absent for bgPC2 (r = -0.01, P = 0.87) (Fig 3B).
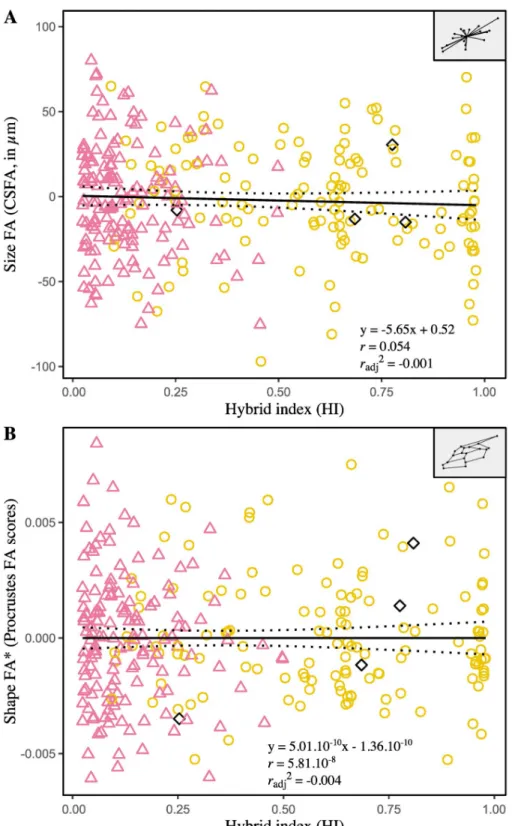
Effects of hybridization on fluctuating asymmetry
Single measure intraclass correlation coefficients (2, 1) are reported to establish the reliability of univariate measures of size FA (CSFA) and shape FA (based on Procrustes or Mahalanobis distances), used to infer levels of developmental instability. Results obtained from the subsam-ple with repeats– 36 individuals, four measurements per wing and a single examiner—indicate that repeatability is high for CSFA (0.99, 95% IC [0.987, 0.996]) and Procrustes FA scores (0.91, 95% IC [0.86, 0.95]), but low for Mahalanobis FA scores (0.02, 95% IC [-0.10, 0.19]). Consequently, Mahalanobis FA scores were excluded from the following analyzes. Linear regression analyses failed to find significant association between size and CSFA (r = 0.07, P = 0.25). On the other hand, significant effect of size on Procrustes FA scores indicates that
the smaller wings tend to be more asymmetrical (r = -0.12, P = 0.04). Regression residuals
were therefore used as size-corrected FA values for shape. To assess the ability of HI to predict the amount of FA, two models were constructed: one linear and one quadratic (polynomial of degree two), both compared in terms of goodness of fit. As a result, adding a quadratic term did not improve the model fits (i.e. higher values of AIC, AICc and BIC), so that the simplest (linear) has been privileged. The slopes and coefficient of determination are not significantly
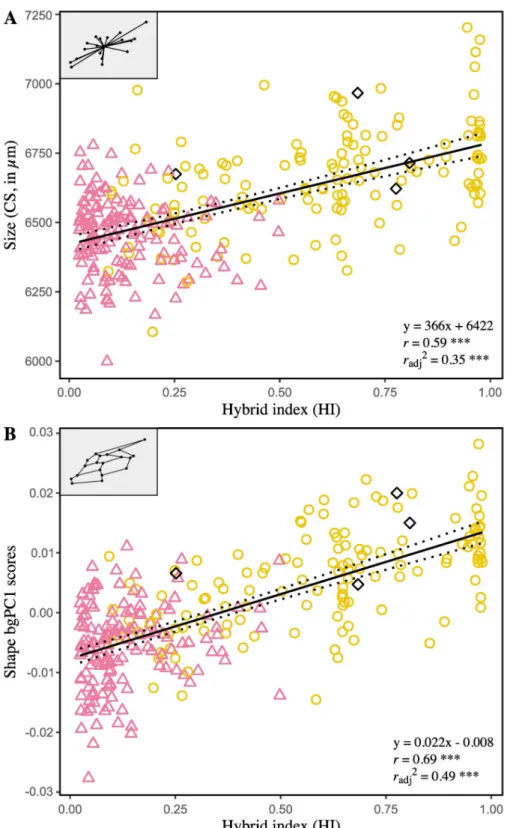
fill color symbolizes the hybrid index (HI), i.e. the hybridization gradient from African genotypes (pink) to European genotypes (yellow). Regressions lines with 95% confidence intervals (dotted lines) are shown.
Fig 3. Relationships between forewing size (A) and shape (B), as captures by the between-group PCA, and the hybrid index. CS: average centroid sizes, i.e. mean of right and the left forewing computed for each individual, inμm; bgPC1: first axis of the between-group PCA conducted on individuals classified as “pure” Africans, “pure” European and hybrids. The symbol and outline color represents the maternal origin of individuals (Δ African lineage, � European C lineage,◆ European M lineage) inferred from mitochondrial markers. Regressions lines with 95% confidence intervals (dotted lines) are shown.
different from zero for both CSFA (P = 0.84) and size-corrected Procrustes FA scores
(P = 1.00), indicating no association between FA and HI (Fig 5).
Discussion
This study aims to investigate the influence of ongoing hybridization in Mauritius Island, as evidenced by genetics [40], between an initial population related to the subspeciesApis melli-fera unicolor from Madagascar and imported European subspecies, at the phenotype level. For
this purpose, individual variation and fluctuating asymmetry in forewing size and shape of honeybee workers were quantifiedvia geometric morphometric methods. These traits were
then confronted with neutral genetic variation to assess the effects of hybridization with exotic subspecies on phenotypic variability and developmental instability.
Effect of hybridization with European-related subspecies on wing size and
shape
Results from multivariate analyses show that morphological variation coincides well with vari-ation in microsatellite allele frequencies. The patterns of covariance for both wings size and shape, revealed by partial least-square analyses, are (essentially) one-dimensional and parallel the level of hybridization of the individuals (Fig 2). It results in an Afro-European continuum of admixture, which also emerges in PCAs as the dominant and only intelligible pattern of var-iation within shape and microsatellite datasets (except unstructured phenotypic plasticity) (S1 Fig). Overall, this highlights that demographic and stochastic processes, initiated by the recent successive imports of continental European subspecies in Mauritius, are still ongoing and pre-vail over possible selective processes. Oleska and Tofilski [22] previously reported such agree-ment between morphometrics and microsatellites, but in a context of admixture between two European subspecies,A.m. carnica and A.m. mellifera. Thus, these results reaffirm the
useful-ness of wing geometric morphometrics for hybrid detection and to infer patterns of introgres-sion in honeybee populations. Yet, classification of workers as pure European, pure African and hybrids show that non-introgressed individuals are still well distinct morphologically, as suggested by wings size comparisons (Fig 3A) and shape based assignment tests (Table 4; Figs
3Band4); besides, the analyses failed to find transgressive phenotypes (i.e., exhibiting unique morphological components) in hybrid descendant. If wings size clearly reflects ancestries of the two genetic pools, i.e. smaller wings in African-related individuals and larger wings in indi-viduals related to European commercial subspecies [19,36,73–77], it can only be suspected concerning wing shape, which could have been further affected by secondary evolutionary or stochastic processes [78]. Ultimately, in the absence of breeding programs and new imports— officially banned since 2011 on the island [79,80]–the honeybee population of Mauritius should evolve towards complete admixture. Unlike the Africanized honeybee (A.m. scutellata
× various European subspecies), which is partly characterized by a shift of European towards African traits leading notably to smaller wings and unique shapes [35], the Mauritian
Table 4. Cross-validated classification of worker honeybees as pure Africans (A), pure Europeans (E) and hybrids (H) using forewing shape.
Cluster classified as Correct assignments (%)
“Pure” A “Pure” E Hybrids
“Pure” A 54 1 20 72.00%
“Pure” E 1 22 4 81.48%
Hybrids 57 37 84 47.19%
Fig 4. Shape changes between the means of “pure” African, “pure” European and hybrid clusters along the first axis of the between-group PCA. (A) “Pure” Africansversus “pure” Europeans. (B) “Pure” Africans versus hybrids. (C)
“Pure” Europeansversus hybrids. Shape changes are displayed as wireframe graphs symbolizing the pattern of
forewing venation ofApis mellifera. Pink: “pure” African mean shape; yellow: “pure” European mean shape; black:
hybrid mean shape.
Fig 5. Relationships between fluctuating asymmetry of forewing size (A) and shape (B) and the hybrid index. CSFA: difference between the centroid sizes of the right and the left forewing, inμm; Procrustes FA scores: Procrustes distance between the shapes of the right and the left forewing. The asterisk (�) designates FA values corrected for size
effect. Each point represents one individual. The symbol and outline color represents the maternal origin of individuals (pink circle: African lineage, yellow circle: European C lineage, black diamond: European M lineage) inferred from mitochondrial markers. Regressions lines with 95% confidence intervals (dotted lines) are shown.
honeybees exhibit on average larger forewings as well as shape changes as a result of “Europe-anization” of its population. A comparison with the surrounding islands and archipelagos of the SWIO whereA.m. unicolor occurs, as well as with continental European sources, should
shed light on the particular evolutionary trajectory followed by the population of Mauritius.
Effects of hybridization with European-related subspecies on
developmental instability
Developmental instability, measured as fluctuating asymmetry of bilateral traits (i.e., left-right random variations), is closely related to both the inherent genomic architecture of individuals (heterozygosity, ploidy, intra- and intergenic interactions, genomic coadaptation) and various environmental stressors, which interact in complex—and still misunderstood—ways [81]. A common assumption states that hybridization, by instigating genetic incompatibilities or breaking coadapted gene complexes, can lead to increased developmental instability in organ-isms; conversely, genotypes may be less able to ensure stable development under unsuitable habitats [82,83]. In Mauritius, where individuals from separate lineages have been brought into contact and hybridize, higher levels of developmental instability were therefore expected in hybrid descendant and/or in non-native genotypes from continental European subspecies. Significant FA has been detected in the whole sample, and affects markedly more wing shape (8.51% of variation) that wing size (<1% of variation); subtle directional asymmetry was also noticed (<1% of variation), but found significant only in shape (Table 3). These results corrob-orate previous studies reporting the contribution of asymmetry in wing variability in honey-bees [84] and other insects [64,85,86]. If they suggest the overall presence of stress during the development of the studied individuals, the amounts of individual size FA and shape FA, on the other hand, do not differ according to ancestry (African, European or mixed) (Fig 5). The only trend observed and already reported by Łopuch and Tofilski [87], is that individuals with larger wings tend to present less shape asymmetry. The results, therefore, do not highlight the (potential) effects of hybridization and exposure to an unusual environment solely. Intrinsic factors specific to each subspecies, bottlenecks, or a globally stressful environment are all addi-tional factors to consider, among others, as sources of developmental instabilities that can hide or overcome differences, difficult to detect in real conditions. To date, only two publications investigated the influence of hybridization between separate lineages on wing asymmetry inA. mellifera, and only one involved both European and African lineages. The first, conducted by
Smith et al. [45] on two European subspecies of M and C lineages (A.m. mellifera and A.m. car-nica respectively), observed no significant effect of hybridization on wing asymmetry. The
sec-ond, conducted by Schneider et al. [36], in which the African subspeciesA.m. scutellata and a
European commercial strain (combination of several European subspecies) were crossbred to mimic the first stages of the emergence of the Africanized honeybee, found lower shape FA in African honeybees relative to European and hybrid workers. In theory, the similar amounts of FA observed in the African workers compared to European (mix ofA.m. ligustica, A.m. carnica
andA.m. mellifera) and hybrids in Mauritius may result from a more sensitive developmental
system inherited fromA.m. unicolor [81], or may reflect population isolation [88]. One alter-native is that other stressors interact and supplant the effects of hybridization and unsuitable habitat. Indeed, Mauritius is highly subject to human pressures. Terrestrial ecosystems of the island have been largely transformed, sparing less than 2% of native habitats [89,90], and the majority of land area is devoted to agriculture (53%), resulting in high degrees of human dis-turbances. Recent studies reported increased asymmetry in honeybees related to urbanization [91,92], exposition to pesticides [93] and pollution rates [84]. Likewise, such anthropogenic stressors could impact the development of bees in Mauritius and deserve further research.
Conclusion
The Mauritian honeybee is experimenting intraspecific hybridization betweenA.m.
unicolor-related individuals (subspecies endemic of Madagascar) and European-unicolor-related subspecies, fol-lowing the latter’s imports since the 19thcentury. The strong agreements found between wings morphology, based on wings size and shape, and neutral genetic variation (14 microsatellite markers) show that the process is still going on, and reaffirm that wings morphometry can be used for hybrid detection in honeybees. Developmental instabilities, measured by individual FA and observed in both wing size and shape, affect individuals in comparable levels whatever their origin and level of hybridization. Consequently, wing asymmetry should influence equally fitness and performance (if linked to) of the workers at the population level, and might not contribute directly to trait displacements in the population, as it is suggested for the Afri-canized honeybee [36]. Measuring more traits, including behavioral ones, would be necessary and could help to clarify the evolutionary mechanisms driving the population. Human-medi-ated hybridization has surely changed the evolutionary trajectory of the Mauritian honeybee. In the shorter term, increased genetic and phenotypic variances could have improved its ability to cope with growing anthropogenic threats, as illustrated by the recent and accidental intro-duction ofVarroa destructor in Mauritius [94], a mite implicated in elevated colony mortality rates worldwide as a virus vector [95,96]. Thus, results presented by Techer et al. [39,40] and here can beneficiate, as a reference point beforeV. destructor arrival, to the management of the
honeybee in Mauritius in order to preserve its ecosystem and economic roles. More widely, it could provide better understanding on the impact of intraspecific hybridization and contact with new parasites on evolutionary trajectories of populations.
Supporting information
S1 Fig. Patterns of variation within neutral genetic variation (A) and forewing shape (B) from principal component analyses (PCAs). Genetic and shape structures are inferred from
microsatellite allele frequencies and Procrustes coordinates, respectively. Variables were cen-tered but not scaled. Points represent individuals genotype (A) or forewing shape (B). The symbol and outline color represents the maternal origin of individuals (pink circle: African lineage, yellow circle: European C lineage, black diamond: European M lineage). The fill color symbolizes the hybrid index (HI), i.e. the hybridization gradient from African genotypes (pink) to European (yellow) genotypes, which is highly similar to the main genetic and shape (PC1) axes.
(EPS)
S2 Fig.
(EPS)
Acknowledgments
The authors are grateful to all beekeepers from Mauritius. The authors acknowledge the Plant Protection Platform (3P, IBISA) where all genetics experiments were conducted, and would like to thank P. Frouin for providing access to the Leica DMC5400 microscope. We thank the anonymous reviewers for their many insightful comments, which significantly contributed to improving the quality of the manuscript.
Author Contributions
Data curation: Julien Galataud, He´lène Delatte, Mae´va Ange´lique Techer, Johanna Cle´mencet.
Formal analysis: Julien Galataud.
Funding acquisition: He´lène Delatte, Bernard Reynaud, Johanna Cle´mencet.
Investigation: Julien Galataud, He´lène Delatte, Mae´va Ange´lique Techer, Christophe Simiand, Preeaduth Sookar, Johanna Cle´mencet.
Methodology: Julien Galataud, He´lène Delatte, Johanna Cle´mencet.
Project administration: Bernard Reynaud, Johanna Cle´mencet.
Resources: Mae´va Ange´lique Techer, Christophe Simiand, Preeaduth Sookar. Supervision: He´lène Delatte, Bernard Reynaud, Johanna Cle´mencet.
Validation: Johanna Cle´mencet.
Visualization: Julien Galataud, He´lène Delatte, Johanna Cle´mencet.
Writing – original draft: Julien Galataud.
Writing – review & editing: Julien Galataud, He´lène Delatte, Mae´va Ange´lique Techer, Ber-nard Reynaud, Johanna Cle´mencet.
References
1. Woodruff D. Natural hybridization and hybrid zones. Systematic Biology. 1973; 22(3):213–218.https:// doi.org/10.1111/2041-210x.12035
2. Mooney H, Cleland E. The evolutionary impact of invasive species. Proceedings of the National Acad-emy of Sciences. 2001; 98(10):5446–5451.https://doi.org/10.1073/pnas.091093398PMID:11344292
3. Vallejo-Marı´n M, Hiscock S. Hybridization and hybrid speciation under global change. New Phytologist. 2016; 211(4):1170–1187.https://doi.org/10.1111/nph.14004PMID:27214560
4. Clarke G. Patterns of developmental stability of Chrysopa perla L. (Neuroptera: Chrysopidae) in response to environmental pollution. Environmental Entomology. 1993; 22(6):1362–1366.https://doi. org/10.1093/ee/22.6.1362
5. Møller A. Developmental Stability and Fitness: A Review. The American Naturalist. 1997; 149(5):916– 932.https://doi.org/10.1086/286030PMID:18811255
6. Wayne R K, Modi W S, O’Brien S J. Morphological variability and asymmetry in the cheetah (Acinonyx
jubatus), a genetically uniform species. Evolution. 1986; 40(1): 78–85. https://doi.org/10.1111/j.1558-5646.1986.tb05719.xPMID:28564107
7. Debat V, Alibert P, David P, Paradis E, Auffray J-C. Independence between developmental stability and canalization in the skull of the house mouse. Proceedings of the Royal Society B: Biological Sciences. 2000; 267: 423–430.https://doi.org/10.1098/rspb.2000.1017PMID:10737397
8. Iguchi K, Watanabe K, Nishida M. Validity of fluctuating asymmetry as a gauge of genetic stress in ayu stocks. Fisheries Science. 2005; 71: 308–313.https://doi.org/10.1111/j.1444-2906.2005.00965.x
9. Rego C, Matos M, Santos M. Symmetry breaking in interspecific Drosophila hybrids is not due to devel-opmental noise. Evolution. 2006; 60(4): 746–761.https://doi.org/10.1111/j.0014-3820.2006.tb01153.x PMID:16739456
10. Eterovick P, Sloss B, Scalzo J, Scalzo J, Alford, R. Isolated frogs in a crowded world: Effects of human-caused habitat loss on frog heterozygosity and fluctuating asymmetry. Biological Conservation. 2016; 195: 52–59.https://doi.org/10.1016/j.biocon.2015.12.036
11. Marchand H, Paillat G, Montuire S, Butet A. Fluctuating asymmetry in bank vole populations (Rodentia, Arvicolinae) reflects stress caused by landscape fragmentation in the Mont-Saint-Michel Bay. Biological Journal of the Linnean Society. 2003; 80: 37–44
12. Sa´nchez-Chardi A, Garcı´a-Pando M, Lo´pez-Fuster M. Chronic exposure to environmental stressors induces fluctuating asymmetry in shrews inhabiting protected Mediterranean sites. Chemosphere. 2013; 93(6): 916–923.https://doi.org/10.1016/j.chemosphere.2013.05.056PMID:23800592
13. LazićM, Miguel C, Crnobrnja-IsailovićJ, Kaliontzopoulou A. Effects of environmental disturbance on phenotypic variation/ an integrated assessment of canalization, developmental stability, modularity, and allometry in lizard head shape. The American Naturalist. 2015; 185(1): 4–58.https://doi.org/10.1086/ 679011PMID:25560552
14. Lezcano A, Quiroga M, Liberoff A, Van der Molen S. Marine pollution effects on the southern surf crab
Ovalipes trimaculatus (Crustacea: Brachyura: Polybiidae) in Patagonia Argentina. Marine Pollution
Bul-letin. 2014; 91(2): 524–529.https://doi.org/10.1016/j.marpolbul.2014.09.038PMID:25293645
15. Goto S, Iwata H, Shibano S, Ohya K, Suzuki A, Ogawa H. Fruit shape variation in Fraxinus mandshurica var. japonica characterized using elliptic Fourier descriptors and the effect on flight duration. The Eco-logical Society of Japan. 2005; 20(6): 733–738.https://doi.org/10.1007/s11284-005-0090
16. Bakker T, Mazzi D, Kraak S. Broods of attractive three-spined stickleback males require greater pater-nal care. Jourpater-nal of Fish Biology. 2006; 69(4): 1664–1177.https://doi.org/10.1111/j.1095-8649.2006. 01194.x
17. Frey F, Bukoski M. Floral symmetry is associated with flower size and pollen production but not insect visitation rates in Geranium robertianum (Geraniaceae). Plant Species Biology. 2013; 29(3): 272–280. https://doi.org/10.1111/1442-1984.12021
18. De la Ru´a P, Jaffe´ R, Dall’Olio R, Muñoz I, Serrano J. Biodiversity, conservation and current threats to European honeybees. Apidologie. 2009; 40(3):263–284.https://doi.org/10.1051/apido/2009027
19. Ruttner F. Biogeography and Taxonomy of Honeybees. Berlin, Heidelberg: Springer Berlin Heidelberg; 1988.
20. Meixner M, Pinto M, Bouga M, Kryger P, Ivanova E, Fuchs S. Standard methods for characterising sub-species and ecotypes of Apis mellifera. Journal of Apicultural Research. 2013; 52(4):1–28.https://doi. org/10.3896/ibra.1.52.4.05
21. Kandemirİ, O¨ zkan A, Fuchs S. Reevaluation of honeybee (Apis mellifera) microtaxonomy: a geometric morphometric approach. Apidologie. 2011; 42(5):618–627.https://doi.org/10.1007/s13592-011-0063-3
22. Oleksa A, Tofilski A. Wing geometric morphometrics and microsatellite analysis provide similar discrimi-nation of honey bee subspecies. Apidologie. 2015; 46(1):49–60. https://doi.org/10.1007/s13592-013-0212-y
23. Nawrocka A, Kandemirİ, Fuchs S, Tofilski A. Computer software for identification of honey bee subspe-cies and evolutionary lineages. Apidologie. 2017.https://doi.org/10.1007/s13592-017-0538-y
24. Kerr W, Bueno D. Natural crossing between Apis mellifera adansonii and Apis mellifera ligustica. Evolu-tion. 1970; 24(1):145–148.https://doi.org/10.1111/j.1558-5646.1970.tb01747.xPMID:28563015
25. Koeniger N, Koeniger G. Reproductive isolation among species of the genus Apis. Apidologie. 2000; 31 (2):313–339.https://doi.org/10.1051/apido:2000125
26. Oleksa A, Wilde J, Tofilski A, Chybicki I. Partial reproductive isolation between European subspecies of honey bees. Apidologie. 2013; 44(5):611–619.https://doi.org/10.1007/s13592-013-0212-y
27. Soland-Reckeweg G. Genetic differentiation and hybridization in the honey bee (Apis mellifera L.) in Switzerland. Thesis, University of Bern. 2006
28. Hall HG. Parental analysis of introgressive hybridization between African and European honeybees using nuclear DNA RFLPs. Genetics. 1990; 125(3):611–621. PMID:1974226
29. Zayed A, Whitfield C. A genome-wide signature of positive selection in ancient and recent invasive expansions of the honey bee Apis mellifera. Proceedings of the National Academy of Sciences. 2008; 105(9):3421–3426.https://doi.org/10.1073/pnas.0800107105PMID:18299560
30. Mikheyev A, Tin M, Arora J, Seeley T. Museum samples reveal rapid evolution by wild honey bees exposed to a novel parasite. Nature Communications. 2015; 6(1).https://doi.org/10.1038/ncomms8991 PMID:26246313
31. Nelson R, Wallberg A, Simões Z, Lawson D, Webster M. Genomewide analysis of admixture and adap-tation in the Africanized honeybee. Molecular Ecology. 2017; 26(14):3603–3617.https://doi.org/10. 1111/mec.14122PMID:28378497
32. Schneider S, DeGrandi-Hoffman G, Smith D. The African Honeybee: Factors Contributing to a Suc-cessful Biological Invasion. Annual Review of Entomology. 2004; 49(1):351–376.https://doi.org/10. 1146/annurev.ento.49.061802.123359PMID:14651468
33. Francoy T, Gonc¸alves L, De Jong D. Rapid morphological changes in populations of hybrids between Africanized and European honey bees. Genetics and Molecular Research. 2012; 11(3):3349–3356. https://doi.org/10.4238/2012.September.17.5PMID:23079828
34. Francoy T, Wittmann D, Drauschke M, Mu¨ller S, Steinhage V, Bezerra-Laure M, et al. Identification of Africanized honey bees through wing morphometrics: two fast and efficient procedures. Apidologie. 2008; 39(5):488–494.https://doi.org/10.1051/apido:2008028
35. Francoy T, Wittmann D, Steinhage V, Drauschke M, Muller S, Cunha D, et al. Morphometric and genetic changes in a population of Apis mellifera after 34 years of Africanization. Genetics and Molecular Research. 2009; 8(2):709–717.https://doi.org/10.4238/vol8-2kerr019PMID:19554770
36. Schneider S, Leamy L, Lewis L, DeGrandi-Hoffman G. The Influence of hybridization between African and European honeybees, Apis mellifera, on asymmetries in wing size and shape. Evolution. 2003; 57 (10):2350.https://doi.org/10.1111/j.0014-3820.2003.tb00247.xPMID:14628923
37. Latreille P. Notice des espèces d’abeilles vivant en grande socie´te´, ou abeilles proprement dites, et description d’espèces nouvelles. Ann Mus Hist Nat. 1804; 5:161–178.
38. Techer M, Cle´mencet J, Simiand C, Portlouis G, Reynaud B, Delatte H. Genetic diversity of the honey-bee (Apis mellifera L.) populations in the Seychelles archipelago. Insect Conservation and Diversity. 2015; 9(1):13–26.https://doi.org/10.1111/icad.12138
39. Techer M, Cle´mencet J, Simiand C, Preeaduth S, Azali H, Reynaud B, et al. Large-scale mitochondrial DNA analysis of native honey bee Apis mellifera populations reveals a new African subgroup private to the South West Indian Ocean islands. BMC Genetics. 2017; 18(1). https://doi.org/10.1186/s12863-017-0520-8PMID:28577537
40. Techer M, Cle´mencet J, Simiand C, Turpin P, Garnery L, Reynaud B, et al. Genetic diversity and differ-entiation among insular honey bee populations in the Southwest Indian Ocean likely reflect old geo-graphical isolation and modern introductions. PloS One. 2017; 12(12):26.https://doi.org/10.1371/ journal.pone.0189234PMID:29281653
41. Miguel I, Baylac M, Iriondo M, Manzano C, Garnery L, Estonba A. Both geometric morphometric and microsatellite data consistently support the differentiation of the Apis mellifera M evolutionary branch. Apidologie. 2011; 42(2):150–161.https://doi.org/10.1051/apido/2010048
42. Cornuet J, Garnery L, Solignac M. Putative origin and function of the intergenic region between COI and COII of Apis mellifera L. mitochondrial DNA. Genetics; 128(2):393–403. PMID:1649072
43. Evans J, Schwarz R, Chen Y, Budge G, Cornman R, De la Rua P, et al. Standard methods for molecular research in Apis mellifera. Journal of Apicultural Research. 2013; 52(4):1–54.https://doi.org/10.3896/ IBRA.1.52.4.11
44. Solignac M, Vautrin D, Loiseau A, Mougel F, Baudry E, Estoup A, et al. Five hundred and fifty microsat-ellite markers for the study of the honeybee (Apis mellifera L.) genome. Molecular Ecology Notes. 2003; 3(2): 307–311.https://doi.org/10.1046/j.1471-8286.2003.00436.x
45. Smith D, Crespi B, Bookstein F. Fluctuating asymmetry in the honey bee, Apis mellifera: effects of ploidy and hybridization. Journal of Evolutionary Biology. 1997; 10(4):551–574.https://doi.org/10.1046/ j.1420-9101.1997.10040551.x
46. Schneider C, Rasband W, Eliceiri K. NIH Image to ImageJ: 25 years of image analysis. Nature Methods. 2012; 9(7):671–675.https://doi.org/10.1038/nmeth.2089PMID:22930834
47. The´venaz P. Point Picker an interactive ImageJ plugin that allows storage and retrieval of a collection of landmarks. Biomedical Imaging Group, Swiss Federal Institute of Technology Lausanne. 2012.http:// bigwww.epfl.ch/thevenaz/pointpicker/
48. Rohlf F, Slice D. Extensions of the Procrustes Method for the Optimal Superimposition of Landmarks. Systematic Zoology. 1990; 39(1):40.https://doi.org/10.2307/2992207
49. Klingenberg C, Barluenga M, Meyer A. Shape analysis of symmetric structures: quantifying variation among individuals and asymmetry. Evolution. 2002; 56(10):1909–1920. https://doi.org/10.1111/j.0014-3820.2002.tb00117.xPMID:12449478
50. Palmer A, Strobeck C. Fluctuating Asymmetry: Measurement, Analysis, Patterns. Annual Review of Ecology and Systematics. 1986; 17(1):391–421.
51. Palmer A. Fluctuating asymmetry analyses: a primer. Developmental Instability: Its Origins and Evolu-tionary Implications. 1994;:335–364.
52. Klingenberg C, McIntyre G. Geometric morphometrics of developmental instability: analyzing patterns of fluctuating asymmetry with Procrustes methods. Evolution. 1998; 52(5):1363.https://doi.org/10. 1111/j.1558-5646.1998.tb02018.xPMID:28565401
53. Goodall C. Procrustes Methods in the Statistical Analysis of Shape. Journal of the Royal Statistical Soci-ety: Series B (Methodological). 1991; 53(2):285–321.https://doi.org/10.1111/j.2517-6161.1991. tb01825.x
54. Klingenberg C. MorphoJ: an integrated software package for geometric morphometrics. Molecular Ecol-ogy Resources. 2011; 11(2):353–357.https://doi.org/10.1111/j.1755-0998.2010.02924.xPMID: 21429143
55. Rohlf F, Corti M. Use of Two-Block Partial Least-Squares to study covariation in shape. Systematic Biol-ogy. 2000; 49(4):740–753.https://doi.org/10.1080/106351500750049806PMID:12116437
56. Zelditch M, Swiderski D, Sheets H. Geometric morphometrics for biologists: a primer. 2nd ed. Amster-dam: Elsevier- Academic Press; 2012.
57. Escoufier Y. Le Traitement des variables vectorielles. Biometrics. 1973; 29(4):751.https://doi.org/10. 2307/2529140
58. Klingenberg C, Maruga´ n-Lobo´n J. Evolutionary covariation in geometric morphometric data: analyzing integration, modularity, and allometry in a phylogenetic context. Systematic Biology. 2013; 62(4):591– 610.https://doi.org/10.1093/sysbio/syt025PMID:23589497
59. Va¨ha¨ J, Primmer C. Efficiency of model-based Bayesian methods for detecting hybrid individuals under different hybridization scenarios and with different numbers of loci. Molecular Ecology. 2006; 15(1):63– 72.https://doi.org/10.1111/j.1365-294X.2005.02773.xPMID:16367830
60. Chavez A, Saltzberg C, Kenagy G. Genetic and phenotypic variation across a hybrid zone between eco-logically divergent tree squirrels (Tamiasciurus). Molecular Ecology. 2011; 20(16):3350–3366.https:// doi.org/10.1111/j.1365-294X.2011.05184.xPMID:21771139
61. Mitteroecker P, Bookstein F. Linear Discrimination, Ordination, and the Visualization of Selection Gradi-ents in Modern Morphometrics. Evolutionary Biology. 2011; 38(1):100–114.https://doi.org/10.1007/ s11692-011-9109-8
62. Team RC. A language and environment for statistical computing. R Foundation for Statistical Comput-ing. Vienna, Austria; 2016.
63. Collyer M, Adams D. Phenotypic trajectory analysis: comparison of shape change patterns in evolution and ecology. Hystrix. 2013; 40(1).https://doi.org/10.4404/hystrix-24.1-6298
64. Adams D, Ota´rola-Castillo E. Geomorph: an R package for the collection and analysis of geometric mor-phometric shape data. Methods in Ecology and Evolution. 2013; 4(4):393–399.https://doi.org/10.1111/ 2041-210x.12035
65. Klingenberg C, Monteiro L. Distances and directions in multidimensional shape spaces: implications for morphometric applications. Systematic Biology. 2005; 54(4):678–688.https://doi.org/10.1080/ 10635150590947258PMID:16126663
66. Shrout P, Fleiss J. Intraclass correlations: Uses in assessing rater reliability. Psychological Bulletin. 1979; 86(2):420–428.https://doi.org/10.1037//0033-2909.86.2.420PMID:18839484
67. Koo T, Li M. A Guideline of Selecting and Reporting Intraclass Correlation Coefficients for Reliability Research. Journal of Chiropractic Medicine. 2016; 15(2):155–163.https://doi.org/10.1016/j.jcm.2016. 02.012PMID:27330520
68. Altman D, Royston P. The cost of dichotomising continuous variables. BMJ. 2006; 332(7549):1080. https://doi.org/10.1136/bmj.332.7549.1080PMID:16675816
69. Lazic S. Why we should use simpler models if the data allow this: relevance for ANOVA designs in experimental biology. BMC Physiology. 2008; 8(1):16.https://doi.org/10.1186/1472-6793-8-16PMID: 18644134
70. Mikula O, Auffray J-C, Macholan M. Asymmetric size and shape variation in the Central European tran-sect across the house mouse hybrid zone. Biological Journal of the Linnean Society. 2010; 101(1):13– 27.https://doi.org/10.1111/j.1095-8312.2010.01490.x
71. Klingenberg C. Analyzing Fluctuating Asymmetry with Geometric Morphometrics: Concepts, Methods, and Applications. Symmetry. 2015; 7(2): 887.https://doi.org/10.3390/sym7020843
72. Klingenberg C. Visualizations in geometric morphometrics: how to read and how to make graphs show-ing shape changes. Hystrix, the Italian Journal of Mammalogy. 2013; 24(1):15–24.https://doi.org/10. 4404/hystrix-24.1–7691
73. Rinderer T, Sylvester H, Brown M, Villa J, Pesante D, Collins A, et al. Field and simplified techniques for identifying Africanized and European honey bees. Apidologie. 1986; 17(1):33–48.https://doi.org/10. 1051/apido:19860104
74. Buco S, Rinderer T, Sylvester H, Collins A, Lancaster V, Crewe R, et al. Morphometric differences between South American africanized and South African (Apis mellifera scutellata) honey bees. Apidolo-gie. 1987; 18(3):217–222.https://doi.org/10.1051/apido:19870301
75. Rinderer T, Sylvester H, Buco S, Lancaster V, Herbert E, Collins A, et al. Improved simple techniques for identifying Africanized and European honey bees. Apidologie. 1987; 18(2):179–196.https://doi.org/ 10.1051/apido:19870208
76. Lobo J. Morphometric isozymic and mitochondrial variability of Africanized honeybees in Costa Rica. Heredity. 1995; 75(2):133–141.https://doi.org/10.1038/hdy.1995.116
77. Quezada-Eua´n J, Medina L. Hybridization between European and Africanized honeybees (Apis
melli-fera L.) in tropical Yucatan, Mexico. I. Morphometric changes in melli-feral and managed colonies.