HAL Id: hal-00485151
https://hal.univ-brest.fr/hal-00485151
Submitted on 20 May 2010
HAL is a multi-disciplinary open access
archive for the deposit and dissemination of sci-entific research documents, whether they are pub-lished or not. The documents may come from teaching and research institutions in France or abroad, or from public or private research centers.
L’archive ouverte pluridisciplinaire HAL, est destinée au dépôt et à la diffusion de documents scientifiques de niveau recherche, publiés ou non, émanant des établissements d’enseignement et de recherche français ou étrangers, des laboratoires publics ou privés.
Experimental shift of diet and DIC stable carbon
isotopes: influence on shell δ13C values in the Manila
clam Ruditapes philippinarum
Céline Poulain, Anne Lorrain, Remy Mas, David Paul Gillikin, F. Dehairs,
Rene Robert, Yves-Marie Paulet
To cite this version:
Céline Poulain, Anne Lorrain, Remy Mas, David Paul Gillikin, F. Dehairs, et al.. Experimental shift of diet and DIC stable carbon isotopes: influence on shell δ13C values in the Manila clam Ruditapes philippinarum. Chemical Geology, Elsevier, 2010, 272 (1-4), pp.75. �10.1016/j.chemgeo.2010.02.006�. �hal-00485151�
1
Experimental shift of diet and DIC stable carbon isotopes: influence
1
on shell δ
13C values in the Manila clam Ruditapes philippinarum
2 3 4
Poulain C.a, Lorrain A.a, Mas R.b, Gillikin D.P.c, Dehairs F.b, Robert R.d, Paulet Y-M.a 5
6
a
LEMAR, UMR CNRS/UBO/IRD 6539, Institut Universitaire Européen de la Mer, Place 7
Nicolas Copernic, 29280 Plouzané, France 8
b
Earth System Sciences Research Group and Dept. of Analytical and Environmental 9
Chemistry, Vrije Universiteit Brussel, Pleinlaan 2, 1050 Brussels, Belgium 10
c
Department of Earth Science and Geography, Vassar College, Poughkeepsie, New York 11
12604, USA 12
d
IFREMER, UMR Laboratoire de Physiologie des Invertébrés, Station Expérimentale 13
d’Argenton, Presqu’ile du vivier, 29840 Argenton, France 14 15 16 Corresponding Author: 17 Céline Poulain 18
LEMAR, UMR CNRS/UBO/IRD 6539, Institut Universitaire Européen de la Mer, 19
Technopole Brest-Iroise, Place Nicolas Copernic, 29280 Plouzané, France 20 Email: celine.poulain@univ-brest.fr 21 Phone number : + 33 2 98 49 88 38 22 Fax number : + 33 2 98 49 86 45 23 24 25
2
Abstract
26
The influences of diet and seawater dissolved inorganic carbon (DIC) on the carbon isotope 27
composition of shell aragonite (δ13Cshell) in the Manila clam Ruditapes philippinarum reared
28
under laboratory conditions were investigated. Clams were exposed to two successive 29
negative carbon isotope shifts: a first shift in diet (δ13Cphytoplankton) and a second shift, 35 days
30
later, in DIC (δ13CDIC). Both successive shifts induced a decrease in δ13Cshell. These results are
31
the first to experimentally confirm an incorporation of respired carbon derived from food and 32
carbon from DIC into shell carbonate of adult bivalves. Skeletal δ13C responded to changes in 33
the δ13C of both diet and DIC in less than 7 days. Consequently, proxies based on δ13Cshell
34
may be used with high temporal resolution. Using δ13Cphytoplankton as a proxy for the carbon
35
isotope composition of respired carbon (δ13CR) resulted in a rather constant percentage of
36
metabolic carbon (CM) into the shell carbonate over time (close to 12 %). However, an
37
accurate estimation of δ13CR is required in order to precisely estimate the percentage of
38
metabolic carbon incorporated into the shell. Despite the significant incorporation of 39
metabolic carbon into shell carbonate, our experimental results revealed that δ13Cshell was
40
highly correlated with δ13CDIC (r² = 0.77, p < 0.0001). Thus it seems that δ13Cshell is a
41
promising proxy of large scale variations in δ13CDIC and therefore of salinity in estuarine
42
water. 43
44 45
Keywords: δ13Cshell, DIC, salinity, metabolic carbon, Ruditapes philippinarum, estuarine
46
water, proxy 47
48 49
3 50
1 Introduction
51
Bivalves record environmental information in the form of chemical or structural messages 52
archived in their calcareous exoskeleton during growth. For this reason, they are widely used 53
for paleo-climatic and paleo-oceanographic reconstructions (e.g. Davenport, 1938, Weidman 54
et al., 1994 , Tripati et al., 2001, Dutton et al., 2002 , Schöne et al., 2003, Lazareth et al., 55
2006, Ivany et al., 2008, Goewert and Surge, 2008, Wanamaker et al., 2008). Epstein et al. 56
(1953) showed that oxygen isotope composition of mollusk shells (δ18Oshell) reflect the
57
temperature and oxygen isotope composition of the water (δ18Ow) in which they were formed.
58
This allows the use of shell carbonate δ18O as a temperature proxy at least in cases where 59
δ18Ow remains constant and is known (e.g. Weidman et al., 1994, Chauvaud et al., 2005,
60
Andrus and Rich, 2008). However, δ18Ow is often strongly dependant on salinity (Epstein and
61
Mayeda, 1953, Craig and Gordon, 1965, Mook and Tan, 1991, Dettman et al., 2004). 62
Therefore, the estimation of δ18Ow is difficult without an independent salinity proxy in
63
environments displaying large salinity variations such as estuaries. In well flushed estuaries 64
with short residence times, stable carbon isotope composition of dissolved inorganic carbon 65
(δ13CDIC) is well correlated with salinity year round, especially when salinity is higher than 25
66
(Mook, 1971, Surge et al., 2001, Fry, 2002, Gillikin et al., 2006). As carbon precipitating 67
during shell mineralization is known to originate mainly from dissolved inorganic carbon 68
(DIC) of seawater (Mook and Vogel, 1968, McConnaughey et al., 1997 , Gillikin et al., 2006, 69
McConnaughey and Gillikin, 2008, Owen et al., 2008), the carbon isotope composition of 70
bivalve shells (δ13Cshell) living in estuaries may possibly be used for reconstructing past
71
variations of salinity. A salinity proxy would also be useful for correcting paleo-72
temperature based on δ18O of estuarine bivalve shells (see Gillikin et al., 2006). 73
The carbon isotope composition of bivalve shell carbonates is, however, not only affected by 74
δ13CDIC, but also by the physiology of the bivalve (Dillaman and Ford, 1982, Tanaka et al.,
75
1986, McConnaughey et al., 1997, Lorrain et al., 2004, Gillikin et al., 2006, 2007, 2009, 76
McConnaughey and Gillikin, 2008). Previous studies have shown that isotopically light 77
metabolic carbon, derived from food, is incorporated into shell carbonate (e.g. Tanaka et al., 78
1986, McConnaughey et al., 1997, Wanamaker et al., 2007, Owen et al., 2008, Gillikin et al., 79
2006, 2007, 2009). However, the processes of metabolic carbon incorporation into the shell 80
remain poorly known and the estimation of metabolic carbon contribution to the shell appears 81
highly variable between studies. McConnaughey et al. (1997), Lorrain et al. (2004) and 82
4 Gillikin et al. (2006) estimated the percentage of metabolic carbon integrated into the shell to 83
be lower than 10 % in deep-sea mollusks, Pecten maximus and Mytilus edulis, whereas 84
Gillikin et al. (2007, 2009) found values between 25 and 40 % in marine Mercenaria 85
mercenaria and freshwater Unionid shells, respectively. Consequently, development of
86
environmental proxies based on δ13Cshell requires a better understanding of the processes
87
involved in the incorporation of metabolic carbon into the bivalve shell. 88
In the present study we performed a laboratory experiment using the Manila clam, Ruditapes 89
philippinarum (Adams and Reeve, 1850). This bivalve species, which has an aragonitic shell,
90
was chosen for several reasons. First, it is an euryhaline bivalve living mainly at salinity 91
levels ranging from 16 to 36 (Nie, 1991), buried a few centimeters in sandy and muddy 92
sediments in intertidal to subtidal zones. Because of its importance for aquaculture and 93
fisheries this species is well studied regarding its biology and physiology (e.g. Goulletquer et 94
al., 1989, Kim et al., 2001, Richardson, 1987, Marin et al., 2003, Flye-Sainte-Marie et al., 95
2007). Moreover, clams, and particularly Ruditapes genus, are frequently found in shell-96
middens, and are therefore suitable candidates as archives of past coastal human settlements 97
(Dupont and Marchand, 2008). 98
During this laboratory experiment, clams were reared under controlled values of 99
δ13Cphytoplankton which were more depleted than those encountered in the field. Moreover, after
100
35 days of experiment, three salinity conditions and therefore three δ13CDIC were tested. The
101
aims of this study are (1) to demonstrate the incorporation of the two carbon sources (DIC 102
from surrounding seawater and DIC originating from respiration) into adult bivalve shells, 103
which, to our knowledge, has never been demonstrated experimentally, (2) to study the 104
response time of these carbon incorporations into the shell, and (3) to investigate the potential 105
use of δ13Cshell as a proxy of high δ13CDIC variations and therefore of salinity in estuarine
106
water. In parallel, this experiment was designed to assess the effect of salinity variations on 107
clam physiology (i.e. condition index, shell growth rate and incorporation of carbon into soft 108
tissues) which has potential impacts on shell mineralization processes. 109
110
2 Material and methods
111
2.1 Biological material
112
A total of 250 Manila clams (R. philippinarum; two to three-years old; average length 27 mm; 113
1 σ = 2mm) were collected by hand at low tide in an estuary located in the Gulf of Morbihan 114
5 (Bay of Kerdréan, 47°37’N, 2°56’W; Brittany; France; semidiurnal tidal regime) on the 18th 115
of August 2008. Clams were transferred to French Research Institute for Exploitation of the 116
Sea (IFREMER) Argenton Shellfish Laboratory (North Finistère, France). 117
118
2.2 Experimental conditions
119
Clams were randomly divided into three batches of 80 individuals and each batch was placed 120
into a 25 L tank without sediment. Water within the tanks was homogenized with an aquarium 121
pump. Each tank was supplied with UV sterilized water from a 300 L buffer tank allowing 122
renewal rate of 25% h-1 and complete water changes were made once a week. The 300 L 123
buffer tanks were filled every 2 to 3 days with 1 µm filtered, UV sterilized water at room 124
temperature. The experimental system is illustrated in Fig. 1. 125
Water flowing into the 25 L tanks was supplemented continuously during the entire 126
experiment with cultured microalgae (50% Isochrysis affinis galbana (Tahitian strain T.iso) 127
and 50% Chaetoceros calcitrans) depleted in 13C (δ13C = - 58 ‰; 1 σ = 4 ‰). 13C depleted 128
microalgae were obtained by bubbling 13C-depleted industrial CO2 into the culture medium
129
(see Paulet et al., 2006 for elaboration). Algae were cultured at a salinity of 35. The 130
experiment was performed over 64 days, during which temperature (20°C) and photoperiod 131
(12/12) were kept constant. 132
133
During the first 35 days, salinity of the three tanks was maintained constant at 35. From days 134
35 to 64, one tank was kept at 35, while salinity was modified to 28 and 20 in the other two 135
tanks. Salinities of 20 and 28 were obtained by mixing seawater and tap water within the 300 136
L buffer tanks, and salinity was checked and adjusted using a conductivity meter (WTW, LF 137
197-S). Salinity was recorded every five minutes in the three tanks using an autonomous data 138
logger (YSI-600 OMS) from day 7 (t7) to the end of the experiment (t64).
139 140
2.3 Sampling
141 2.3.1 Biological sampling 142Soft tissue sampling
143
During the first 35 days, while salinity was similar in all three tanks, two clams per tank were 144
collected each week. After the salinity change, five clams were randomly collected from each 145
tank weekly. Adductor and posterior muscle, digestive gland (without purging the digestive 146
6 tract) and mantle (without siphon) were dissected from each individual and were frozen at -147
20°C. In order to determine initial isotope composition of tissues at the beginning of the 148
experiment (t0), five clams from the field were processed in the same way. In addition, five
149
clams per tank were collected at t35 and t64, and total soft tissues from each individual were
150
frozen at -20°C. At the end of the experiment, tissues were freeze-dried (48h) and shells were 151
air-dried. Tissues and shell were weighed in order to estimate the condition index (CI), 152
following Lucas and Beninger, (1985) : 153
CI = (Soft Tissues Dry Weight / Shell Dry Weight) × 100. 154
155
Calcein marking and shell sampling
156
Two calcein markings were used to establish a temporal scale in the shells. Clams in each 157
salinity treatment were exposed to a 150 mg L-1 calcein solution during 4 hours (Rowley and 158
Mackinnon, 1995, Thébault et al., 2005) at days 15 (t15) and 35 (t35). At the end of the
159
experiment (t64), 30 clams from each salinity were sacrificed and their shells were used for
160
growth rate determination and calcium carbonate sampling. 161
162
2.3.2 Food and DIC sampling
163
In order to determine the carbon isotope composition of the diet during the experiment, 15 mL 164
of the algal mix was filtered on a precombusted Whatman GF/F filter every week. Following 165
Lorrain et al. (2003), filters were immediately dried for 12h at 60°C and stored until analysis. 166
When the clams were collected, water was sampled in the field and 200 mL was filtered on a 167
precombusted Whatman GF/F filter to determine the carbon isotope composition of 168
particulate organic matter (δ13CPOM) using the method described above. The suspended POM
169
pool is a mixture of different sources of carbon (e.g. phytoplankton, microphytobenthos, 170
resuspended sediment, terrestrial carbon, marine micro-algae detritus). However, δ13CPOM
171
may be used as a proxy for δ13Cphytoplankton (see Gillikin et al., 2006). Following Gillikin and
172
Bouillon (2007), water from the field and water within the 25 L clam tanks were sampled at t0
173
and weekly respectively using 12 mL glass vials and poisoned with 20 µ L of saturated 174
mercuric chloride (HgCl2) solution until analysis of the DIC isotope composition.
175 176
2.4 Shell preparation and calcium carbonate sampling
177
For the purposes of calcium carbonate sampling, 30 shells were collected from each tank at 178
day 64 (end of experiment). A 8×10 mm piece of the shell, including the new shell material 179
7 formed during the experiment, was cut from the shell edge along the major growth axis and 180
embedded in epoxy resin (Araldite 2020, DIL, France). A cross-section (800 µm thick) was 181
then cut using a low speed diamond saw and glued on a glass slide with epoxy resin. Thick 182
sections were then ground with wet sandpaper (1200, 2400 and 4000 µm grit size) and 183
polished with a suspended diamond solution (3 µm). Shell sections were observed under a 184
fluorescence microscope (OLYMPUS BX41) equipped with a 50 W high-pressure Hg lamp 185
and a calcein filter. Photographs were acquired using a Hamamatsu C4742-95 digital camera 186
fitted on the microscope. The R. philippinarum shell consists of two aragonitic layers, an 187
inner homogeneous layer and an outer prismatic layer. Four evident marks in the outer layer 188
allowed assigning calendar dates on the shell sections: a cleft presumably due to the shell 189
growth stop induced by clam’s collection in the field, the two calcein marks and the ventral 190
margin which sets the date the experiment was ended. For the 30 clams per tank collected on 191
the final day, growth between the four growth checks was measured on the shell section 192
photograph using the software Visilog 6.6. Five of the 30 shells (per batch) were selected 193
based on age (two-year old clams were selected to avoid any effect of ontogeny) and on high 194
shell growth rate to obtain sufficient material for carbon isotopic analysis. Since the tidal 195
periodicity of shell growth increment formation at intertidal flats is not lost in R. 196
philippinarum even after several months in constant laboratory conditions without emersion
197
(Richardson, 1987), it was possible to assign a calendar date to each growth increment (with 198
a precision of 3 days due to the behavioral disturbance induced by handling). Calcium 199
carbonates samples (average weight = 70 µg) were drilled to a depth of 350 µm in the middle 200
of the prismatic layer using a MicroMill (Merchantek) fitted with a 300 µm diameter drill bit. 201
One carbonate sample was drilled just before the cleft induced by clam collection in order to 202
measure the field isotopic value (t0), one sample was drilled between the cleft and the first
203
calcein mark, two samples were drilled between the first and the second calcein mark and 204
three samples were drilled after the second calcein mark (see Fig. 2). Aragonite powder 205
samples were stored in glass vials until analysis. 206
207
2.5 Isotopic analyses
208
Freeze-dried tissues were ground to a homogeneous fine powder. 500 µ g of the powder was 209
packed into 5×9 mm precombusted silver cups. Carbon stable isotope analysis was performed 210
at the Earth System Sciences laboratory (Vrije Universiteit Brussel) using an Elemental 211
Analyzer (Flash 1112 EA Thermo Finnigan) coupled via a CONFLO III to a Thermo Delta V 212
8 Plus isotope ratio mass spectrometer (IRMS). A total of 42 samples of the international 213
isotopic reference standard IAEA-CH-6 (-10.45 ± 0.030 ‰) were analyzed with the samples 214
and yielded a reproducibility (1 σ) of 0.36 ‰ for δ13C. 215
Filters were decarbonated via a 4-h exposure to HCl fumes in a dessicator (Lorrain et al., 216
2003) and were packed into 5×9 mm tin cups. Isotopic analysis was performed as described 217
for the tissues. 218
The δ13C of the total DIC was analyzed according to the protocol of Gillikin and Bouillon, 219
(2007). Briefly, 9.5 mL of water sample were acidified with 200 µ L of pure orthophosphoric 220
acid in a 12 mL helium-flushed headspace vial, followed by overnight equilibration and 221
injection of 500 µ L headspace into the carrier gas stream of the continuous flow EA-IRMS 222
(same instrument used for tissues and diet). The Miyajima et al. (1995) algorithm was used to 223
correct for the partitioning of CO2 between headspace and water phase and to calculate the
224
δ13CDIC. Along with the headspace injections a CO2 house standard was injected (n = 28, 1 σ
225
= 0.2 ‰). Based on this and an average reproducibility of DIC sample measurements of 0.11 226
‰, a precision of the δ13CDIC better than 0.2 ‰ (1 σ) can be expected (also see Gillikin and
227
Bouillon, 2007). 228
All carbonate isotopic analyses were performed on a Finningan MAT 252 IRMS equipped 229
with a Kiel III automated sampling device at the University of Arizona, USA. Samples were 230
reacted with > 100 % orthophosphoric acid at 70°C. The standard deviation of replicate 231
carbonate standards was 0.08‰ (1 σ). All carbon isotopic results are reported relative to 232
VPDB (Vienna Pee Dee Belemnite) by calibration to the NBS-19 reference standard (δ13C = 233 +1.95 ‰). 234 235
2.6 Data analysis
236All statistical analyses were performed using the software Statgraphics. Homoscedasticity was 237
tested using Bartlett’s test (α=0.05). ANOVAs were performed to check: (1) the differences in 238
mean shell growth of clams for the three salinity conditions between t35 and t64, and (2) the
239
differences in carbon isotope composition between the different salinity conditions for each 240
organ at each sampling date. The differences in condition index between the three salinity 241
conditions were tested by performing non-parametric Kruskal-Wallis test. 242
9
3 Results
244
3.1 Animal growth and condition during the experiment
245
All clams exhibited significant growth during the experiment with shell growth between the 246
1st calcein marking (t15) and the shell edge (t64) of 1986 µm (1σ = 1037 µm ; n = 90; see Fig.
247
2). The two bright calcein marks and the cleft induced by clam collection from the field were 248
readily identifiable in all shells. The three salinity treatments tested between day 35 (2nd 249
calcein marking) and the end of the experiment (shell edge) induced no significant differences 250
on shell growth (ANOVA, p = 0.32) with a mean shell growth of 1402 µm (1σ = 752 µm; n = 251
30), 1368 µm (1σ = 598 µm; n = 30) and 1135 µm (1σ = 663 µm; n = 30) at salinities 35, 28 252
and 20, respectively. 253
The condition index was almost constant during the entire experiment (average value = 8.80; 254
1 σ = 1.85). Between days 35 and 64, at each sampling date, there were no significant 255
differences in average values of condition index between the three salinities conditions 256
(Kruskal-Wallis, p > 0.05). 257
258
3.2 Salinity and
δ
13C
DIC259
During the first 35 days, salinity of the three tanks was 35.42 (1σ = 0.21), 35.77 (1σ = 0.11) 260
and 35.36 (1σ = 0.10) respectively. From days 35 to 64, the first tank was maintained at 35.28 261
(1σ = 0.16), while salinity was changed to 28.02 (1σ = 0.14) and 20.76 (1σ = 0.13) in the two 262
other tanks. 263
The carbon isotopic DIC values in the experimental tanks ranged between -1.28 ‰ and -3.34 264
‰ at salinity 35, between -4.97 ‰ and -5.90 ‰ at salinity 28 and between -8.33 ‰ and -9.52 265
‰ at salinity 20 (Fig. 3A). There was a high positive correlation between δ13CDIC and salinity
266
(δ13CDIC = 0.424 × salinity – 17.04, r² = 0.95, p < 0.0001, n = 16) as shown in Fig. 3B.
267 268
3.3
δ
13C
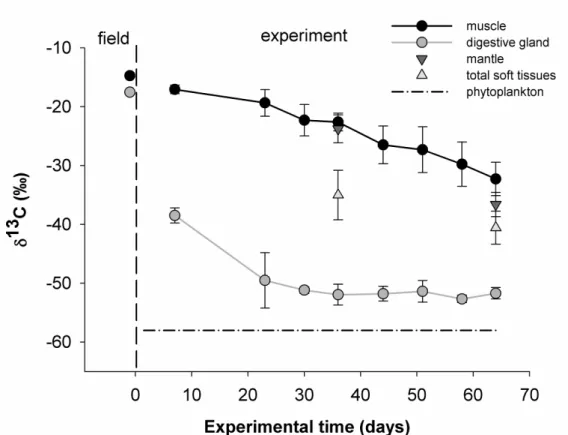
tissues269
From days 35 to 64, there was no significant effect of salinity on δ13C values for digestive 270
gland and muscle at each sample date (ANOVA, p > 0.05). Therefore, values were pooled per 271
date as shown in Fig. 4. The δ13C trend was similar for the different tissues (muscle, digestive 272
gland, mantle and total soft tissue) with a decrease over time. However, δ13Cmuscle decreased
273
from -14.7 to -32.6 ‰ in 64 days whereas δ13Cdigestive gland decreased from -17.5 to -38.5 ‰ in
10 only 7 days. Mantle δ13C values were not significantly different than the muscle δ13C value 275
(ANOVA, p > 0.05) at t35. Total soft tissues δ13C values were between muscle and digestive
276 gland δ13C values. 277 278
3.4
δ
13C
shell 279Shell carbonate sampled before the cleft in the shell, which represents three to four days of 280
growth in the field just before collection, had mean δ13Cshell values equal to -0.83 ‰ (1σ =
281
0.26 ‰) as shown in Fig. 5. At day 7, shell material formed in experimental tanks showed a 282
decreased in δ13Cshell values in comparison to the field, with a mean value of -6.48 ‰ (1σ =
283
0.80 ‰ ; i.e., a 5.65 ‰ decrease on average). After the salinity changes, mean δ13Cshell values
284
ranged from -5.03 to -6.64 ‰ for clams at salinity 35, from -8.35 to -9.82 ‰ for clams at 285
salinity 28 and from -10.39 to -12.11 ‰ for clams at salinity 20 (Fig. 5). These shell δ13C 286
values were significantly different between the three salinities at t40, t52 and t62 (ANOVA, p <
287
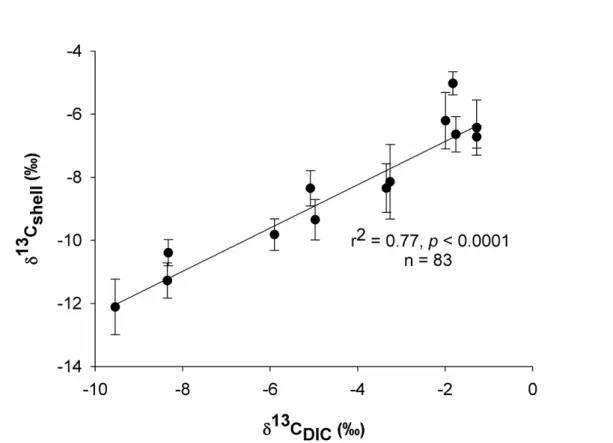
0.0001). There was a significant positive linear relationship between δ13Cshell and δ13CDIC (r² =
288 0.77, p < 0.0001, n = 83) as shown in Fig. 6. 289 290
4 Discussion
291At the beginning of the experiment, clams were transferred from the field where the δ13CPOM
292
value was -18 ‰ to laboratory conditions where δ13Cphytoplankton was -58 ‰. This shift in δ13C
293
of the clams diet led to a decrease in δ13C in all tissues analyzed (muscle, digestive gland, 294
mantle and total soft tissues). This indicates a successful and quick incorporation of the 295
isotopically light dietary carbon from phytoplankton into clam tissues. In agreement with the 296
observation of Paulet et al. (2006) on Pecten maximus and Crassostrea gigas and Malet et al. 297
(2007) on Crassostrea gigas, our results indicate that the incorporation of dietary carbon is 298
faster in the digestive gland than in the muscle. This illustrates that the tissue turnover rate is 299
higher in the digestive gland than in the muscle. 300
In our study, there was no significant effect of salinity on the clams physiology as indicated 301
by the incorporation of carbon into the tissues, the condition index and shell growth rates. 302
These observations are in agreement with the results of Kim et al. (2001), who showed that 303
reasonable changes in salinity (35 to 20) have a small effect on activity rhythm and oxygen 304
consumption. Kim et al. (2001) report that Manila clams cannot maintain a normal metabolic 305
11 activity at salinities lower than 15 and all clams died after an exposure at a salinity of 5 for 7 306
days. 307
308
Our results showed that the transfer from field to experimental conditions was followed by a 309
decrease from -0.83 to -6.48 ‰ in δ13Cshell in just 7 days (Fig. 5). Since the difference
310
between field and laboratory δ13CDIC was less than 1 ‰, the change in δ13Cshell was most likely
311
due to the diet δ13C shift. This strongly suggests an incorporation of carbon derived from food 312
into the shell. After 35 days, three salinity conditions were tested (20, 28 and 35). As 313
expected, shifts in salinity resulted in shifts in δ13CDIC (as we mixed waters with different
314
δ13CDIC values), which was followed by significant changes of δ13Cshell values. These results
315
experimentally confirmed an integration into the shell of both carbon from seawater DIC and 316
metabolic DIC derived from food as suggested by number of authors (e.g. Tanaka et al., 1986, 317
McConnaughey et al., 1997, Lorrain et al., 2004, Wanamaker et al., 2007, McConnaughey 318
and Gillikin, 2008, Owen et al., 2008, Gillikin et al., 2006, 2007, 2009). 319
320
For both successive shifts (δ13Cphytoplankton shift at t0 and δ13CDIC shift at t35), the incorporation
321
of carbon into the shell was very rapid: the first carbonate samples following both switches, 322
which correspond to an average of nearly 7 days, had significantly different δ13Cshell than
323
carbonate samples before the shifts. Because seawater DIC is presumed to be supplied in 324
extrapallial fluids directly from the surrounding seawater through mantle epithelium and 325
periostracum (see McConnaughey and Gillikin, 2008), a short incorporation time is expected. 326
Interestingly the incorporation of carbon from food was also very rapid, which is not 327
necessarily expected because assimilation and metabolic processes may occur at a longer time 328
scale. This result suggests that during this experiment most respired C used in shell 329
construction is derived from the direct oxidation of food and is not from stored C sources. 330
331
During this experiment, δ13CDIC was not as constant as expected over time for the three
332
salinities (Fig. 3A). As salinity was constant during this experiment (except the voluntary shift 333
at t35), δ13CDIC fluctuations are not explained by salinity variations. Two other hypotheses may
334
be considered. (1) Clam respiration and calcification will modify the CO2 fluxes and then
335
δ13CDIC, however, aquaria water was continuously renewed at a rate of 25% h-1 (see Materials
336
and methods), which would greatly reduce or even eliminate this effect on δ13CDIC.
337
Nevertheless, future studies should consider this and analyze pH, total DIC, pCO2 and even
12 O2 levels as all these parameters have been proposed to influence shell δ13C (see
339
McConnaughey and Gillikin, 2008 for a review); (2) Variable quantities of food supplied to 340
the clams is a more probable cause of these δ13CDIC fluctuations. In order to obtain the
341
appropriate phytoplankton concentration within the clam tanks, the flow of algae culture 342
supplied was adjusted daily as a function of algae culture concentration and the number of 343
clams in the tank. The δ13CDIC value in this algae culture was -22 ‰ during this experiment.
344
Therefore, when variable quantities of algae solutions are supplied to the clams, 345
corresponding variable 13C-depleted DIC in the culture medium might induce differential 346
δ13CDIC values within the clam tanks. Despite the relative instability of δ13CDIC, δ13Cshell
347
followed the same variations as δ13CDIC. There was a positive linear relationship between
348
δ13CDIC and δ13Cshell during the experiment with a high correlation coefficient value (r² = 0.77,
349
p < 0.0001, n = 83, Fig. 6). It seems that, in this species, δ13Cshell may be a promising proxy of
350
large scale variations in δ13CDIC and therefore of salinity in estuarine water.
351 352
In order to estimate the percentage of metabolic carbon in the shell carbonate (CM), previous
353
studies used the classical two end-member mixing equation proposed by McConnaughey et al. 354
(1997): CM = 100 × (δ13Cshell – εar-b – δ13CDIC) / (δ13CR – δ13CDIC) where εar-b is the enrichment
355
factor between bicarbonate and aragonite (+ 2.7 ‰; Romanek et al., 1992) and δ13CR is the
356
carbon isotope composition of respired carbon which has never been measured in bivalves. 357
According to Tanaka et al. (1986) and McConnaughey et al. (1997), δ13Ctissues values provide
358
a good approximation of δ13CR. Nevertheless, there is no consensus on the tissue used to
359
estimate δ13CR; consequently we performed this estimation with all potential δ13CR values
360
(δ13C of muscle, digestive gland, mantle, total soft tissues and cultured phytoplankton). There 361
was no significant difference between CM values calculated for the three salinity conditions
362
with all potential δ13CR values and at any sampling date (Kruskal-Wallis, p > 0.05). The
363
similarity between CM values at the three salinities seems to reject a strong impact of carbonic
364
anhydrase (CA) activity on shell δ13C. Low salinity could result in decreased carbonic 365
anhydrase (CA) activity in the animal, as has been described for some bivalves (Henry and 366
Saintsing, 1983). In addition, CA activity has also been shown to be inhibited by Cl- ions 367
(Pocker and Tanaka, 1978) and therefore by salinity levels. Gillikin et al. (2006) hypothesized 368
that CA, which catalyses the reaction of bicarbonate to CO2, thereby facilitating diffusion of
369
DIC through membranes (Paneth and O'Leary, 1985), may add or remove carbon species 370
from the internal calcifying fluids. A reduction in CA activity due to low salinity could cause 371
a reduction in environmental DIC entering the animal, resulting in a larger relative 372
13 contribution of metabolic DIC and more negative δ13C in the calcifying fluid and shell. Since 373
there was no significant difference between CM values calculated for the three salinity
374
conditions, it appears that the salinity effect on CA activity and the ability of the animal to 375
move environmental DIC into their calcification space is small or non-existent. The similarity 376
between CM values at the three salinities also seems to reject a strong impact of possible
377
varying O2 and CO2 levels on shell δ13C (see McConnaughey and Gillikin, 2008) that could
378
arise with changing salinities. However, future studies should measure these parameters to 379
estimate their role. 380
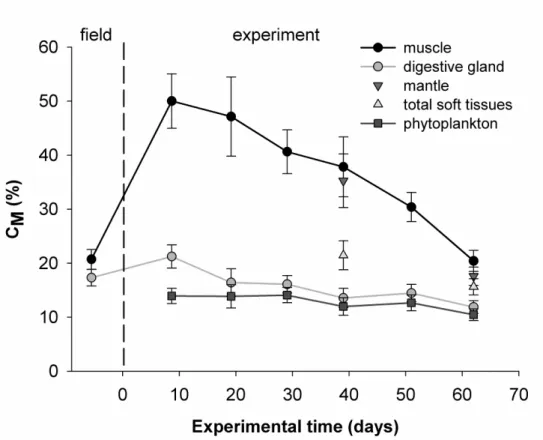
The estimated values of CM shown in Fig. 7 were highly sensitive to the type of tissue used
381
for calculation and, at t7, CM values ranged from 21 % using digestive gland to 50 % using
382
muscle (note that we calculated CM for each date based on δ13Ctissues values pooled from all
383
salinities as there was no salinity effect on CM). The estimations using δ13Cmantle and δ13Ctotal
384
soft tissues resulted in intermediate values that ranged between the estimations made using
385
muscle and digestive gland δ13C values. At the end of this experiment, these differences were 386
reduced (12 % using digestive gland to 20 % using muscle). Interestingly CM values
387
calculated with digestive gland or muscle, as a proxy for respired carbon δ13C, between the 388
clams collected at the end of the experiment and clams collected in the field, did not greatly 389
differ (see Fig. 7, 17 vs 12 % or 21 vs 20 % using the digestive gland and muscle 390
respectively). As clams in the laboratory were growing without sediments, this would suggest 391
that 13C depleted porewater plays little to no role in biomineralization (see McConnaughey 392
and Gillikin, 2008). Indeed, incorporation of 13C depleted porewater in the field would lead to 393
more negative shell δ13C and then an overestimation of CM in the field. In our lab experiment,
394
without such depleted porewaters, CM values should have been much smaller than the field if
395
carbon from these waters was strongly incorporated into the shells. 396
The CM fluctuations through time were higher using δ13Cmuscle as δ13CR than using δ13Cdigestive
397
gland (50 to 20 % using muscle; 21 to 12 % using digestive gland). Interestingly, the estimation
398
using δ13Cphytoplankton (which is lower than δ13Ctissues, especially at the beginning of the
399
experiment) results in an even more constant estimation of CM over time than using δ13Cdigestive
400
gland, with a value close to 12 %. Since salinity variations didn’t affect the clams physiology
401
and other experimental conditions such as temperature and food quantity were constant during 402
this experiment, such a constant value can be expected. Moreover, a CM value of 12 % is near
403
the typical value of 10 % recorded for most aquatic mollusks (see McConnaughey and 404
Gillikin, 2008). Assuming that δ13CR is close to δ13Cphytoplankton during this experiment
405
illustrates that metabolic CO2 originates from very reactive tissues or directly from food
14 oxidation when animals are fed continuously, and that muscle tissues were not appropriate to 407
estimate CM.
408
In the field, availability of energy (food) and energy allocation within bivalves is highly 409
variable throughout the year (Paulet et al., 2006). During phytoplankton blooms, when 410
metabolism is generally high, more of the carbon used for shell mineralization may be derived 411
from metabolic CO2 which mainly results from oxidation of food. In such a case, δ13CR may
412
be closer to δ13C values of phytoplankton. During less productive periods, carbon contribution 413
may mainly come from DIC and because metabolism is mainly fuelled from reserves, δ13CR
414
should be closer to δ13C values of storage organs (e.g. muscle). Thus, in bivalves, both 415
proportion and carbon isotope value of metabolic carbon may be variable over the year. If this 416
hypothesis is true, then studies investigating high frequency variations in δ13Cshell should use
417
different tissues to estimate δ13CR according to the time period studied (digestive gland or
418
phytoplankton during productive periods and muscle during less productive period). Studies 419
that average more time (e.g. annual) can use tissues with a slower turnover rate, such as the 420
muscle. However, under natural conditions the effect would be much smaller than in this 421
study as in the field food items are not likely to vary as much as the 40 ‰ shift imposed in 422
this study, and muscle and digestive gland δ13C values would not be so isotopically different 423
(e.g. Lorrain et al., 2002). 424
425
Our study highlights that δ13C values of respired carbon are necessary to accurately determine 426
the percentage of metabolic carbon integrated into bivalve shells. This respired CO2 is
427
however very difficult to sample and has never been measured in bivalves. 428
429 430
Conclusion
431
This study experimentally highlights the incorporation of two carbon sources into shell 432
carbonate: dissolved inorganic carbon from seawater and respired carbon derived from food. 433
The incorporation time of both carbon sources into the shell is very short (less than 7 days). 434
These short incorporation times indicate that proxies based on δ13Cshell may be used with high
435
temporal resolution. Our experimental results also demonstrate that (1) the physiology of this 436
euryhaline clam was not affected by the salinity treatments ranging between 20 and 35 during 437
this experiment; (2) salinity does not seem to affect carbon cycling within the clam; and (3) 438
δ13Cshell is highly correlated to δ13CDIC. Consequently, δ13Cshell of R. philippinarum is a
15 promising proxy of large scale variations in δ13CDIC and therefore of salinity in estuarine
440 water. 441 442 443 444 Acknowledgements 445
This work is a contribution to the PaleoSalt project funded by the European Science 446
Fondation (ESF) under the EUROCORES Program EUROCLIMATE. The authors thank all 447
the staff of the IFREMER shellfish laboratory at Argenton, particularly Pierrick Le Souchu, 448
Christian Mingant, Luc Lebrun and Isabelle Queau; Jérémy Querné, Antoine Carlier and 449
Jean-Marie Munaron for clam collection, technical assistance in clam dissection and water 450
filtration; Mickael Korntheuer for technical support with the EA-IRMS and David Dettman 451
for the carbonate isotopic analysis. This manuscript was greatly improved by comments from 452
Jonathan Flye-Sainte-Marie and Julien Thébault and by reviews from Ted McConnaughey 453
and Alan Wanamaker. We also thank the GDR IRD and IFREMER ACOMAR “Analyse, 454
Compréhension et Modélisation des Archives biologiques marines” for funding. Support for 455
this work was obtained also from the Science for Sustainable Development Program, Brussels 456
via contract SD/CS/02A. 457
458 459
References
460
Andrus, C.F.T. and Rich, K.W., 2008. A preliminary assessment of oxygen isotope 461
fractionation and growth increment periodicity in the estuarine clam Rangia cuneata. 462
Geo-Mar. Lett 28 (5-6), 301-308. 463
Chauvaud, L., Lorrain, A., Dunbar, R.B., Paulet, Y.-M., Thouzeau, G., Jean, F., Guarini, J.-464
M. and Mucciarone, D., 2005. Shell of the Great Scallop Pecten maximus as a high-465
frequency archive of paleoenvironmental changes. Geochem. Geophys. Geosyst. 6 466
(Q08001), doi:10.1029/2004GC000890. 467
Craig, H. and Gordon, L.I., 1965. Deuterium and oxygen 18 variations in the ocean and 468
marine atmosphere. In: E. Tongiorgi (Editor), Stable Isotopes in Oceanographic 469
Studies and Paleotemperatures Consiglio Nazionale delle Ricerche, Laboratorio di 470
Geologia Nucleare, Pisa, pp. 9-130. 471
Davenport, C., 1938. Growth lines in fossil pectens indicators of past climates. J. Paleontol. 472
12 (5), 514-515. 473
Dettman, D.L., Flessa, K.W., Roopnarine, P.D., Schone, B.R. and Goodwin, D.H., 2004. The 474
use of oxygen isotopic variation in shells of estuarine mollusks as a quantitative record 475
of seasonal and annual Colorado River discharge. Geochim. Cosmochim. Acta 68 (6), 476
1253-1263. 477
Dillaman, R.M. and Ford, S.E., 1982. Measurement of calcium-carbonate deposition in 478
mollusks by controlled etching of radioactively labeled shells. Mar. Biol. 66, 133-143. 479
16 Dupont, C. and Marchand, G., 2008. Coastal exploitation on the neolithic of Western France: 480
La pointe Saint-Gildas (Préfailles). Environmental archeology 13 (2), 143-152. 481
Dutton, A.L., Lohmann, K.C. and Zinsmeister, W.J., 2002. Stable isotope and minor element 482
proxies for Eocene climate of Seymour Island, Antarctica. Paleoceanography 17 (2), 483
doi: 1016, 10.1029/2000PA000593. 484
Epstein, S., Buchsbaum, R., Lowenstam, H.A. and Urey, H.C., 1953. Revised carbonate-water 485
isotopic temperature scale. Geol. Soc. Am. Bull. 64, 1315-1326. 486
Epstein, S. and Mayeda, T., 1953. Variations of 18O content of waters from natural sources. 487
Geochim. Cosmochim. Acta 4, 213-224. 488
Flye-Sainte-Marie, J., Jean, F., Paillard, C., Ford, S., Powell, E., Hofmann, E. and Klinck, J., 489
2007. Ecophysiological dynamic model of individual growth of Ruditapes 490
philippinarum. Aquaculture 266, 130-143.
491
Fry, B., 2002. Conservative mixing of stable isotopes across estuarine salinity gradients: a 492
conceptual framework for monitoring watershed influences on downstream fisheries 493
production. Estuaries Coasts 25 (2), 264-271. 494
Gillikin, D.P. and Bouillon, S., 2007. Determination of δ18O of water and δ13C of dissolved 495
inorganic carbon using a simple modification of an elemental analyzer – isotope ratio 496
mass spectrometer (EA-IRMS): an evaluation. Rapid Commun. Mass Spectrom. 21, 497
1475-1478. 498
Gillikin, D.P., Hutchinson, K.A. and Kumai, Y., 2009. Ontogenic increase of metabolic 499
carbon in freshwater mussel shells. J. Geophys. Res. -Biogeosciences 114 (G01007), 500
doi:10.1029/2008JG000829. 501
Gillikin, D.P., Lorrain, A., Bouillon, S., Willenz, P. and Dehairs, F., 2006. Stable carbon 502
isotopic composition of Mytilus edulis shells: relation to metabolism, salinity, δ13
CDIC
503
and phytoplankton. Org. Geochem. 37, 1371-1382. 504
Gillikin, D.P., Lorrain, A., Meng, L. and Dehairs, F., 2007. A large metabolic carbon 505
contribution to the δ13C record in marine aragonitic bivalve shells. Geochim. 506
Cosmochim. Acta 71, 2936-2946. 507
Goewert, A. and Surge, D., 2008. Seasonality and growth patterns using isotope 508
sclerochronology in shells of the Pliocene scallop Chesapecten madisonius. Geo-Mar. 509
Lett. 28, 327-338. 510
Goulletquer, P., Heral, M., Deslous-Paoli, J.M., Prou, J., Garnier, J., Razet, D. and 511
Boromthanarat, W., 1989. Ecophysiology and energy balance of the Japanese clam 512
Ruditapes philippinarum. J. Exp. Mar. Biol. Ecol. 132, 85-108.
513
Henry, R.P. and Saintsing, D.G., 1983. Carbonic-anhydrase activity and ion regulation in 3 514
species of osmoregulating bivalve mollusks. Physiol. Zool. 56 (2), 274-280. 515
Ivany, L.C., Lohmann, K.C., Hasiuk, F., Blake, D.B., Glass, A., Aronson, R.B. and Moody, 516
R.M., 2008. Eocene climate record of a high southern latitude continental shelf: 517
Seymour Island, Antarctica. Geol. Soc. Am. Bull. 120, 659-678. 518
Kim, W.S., Huh, H.T., Huh, S.H. and Lee, T.W., 2001. Effects of salinity on endogenous 519
rhythm of the Manila clam, Ruditapes philippinarum (Bivalvia: Veneridae). Mar. Biol. 520
138 (1), 157-162. 521
Lazareth, C.E., Lasne, G. and Ortlieb, L., 2006. Growth anomalies in Protothaca thaca 522
(Mollusca, Veneridae) shells as markers of ENSO conditions. Clim. Res. 30 (3), 263-523
269. 524
Lorrain, A., Paulet, Y.-M., Chauvaud, L., Dunbar, R.B., Mucciarone, D. and Fontugne, M., 525
2004. δ13C variation in scallop shells: Increasing metabolic carbon contribution with 526
body size? Geochim. Cosmochim. Acta 68 (17), 3509-3519. 527
17 Lorrain, A., Paulet, Y.-M., Chauvaud, L., Savoye, N., Donval, A. and Saout, C., 2002. 528
Differential δ13C and δ15N signatures among scallop tissues: implications for ecology 529
and physiology. J. Exp. Mar. Biol. Ecol. 275 (1), 47-61. 530
Lorrain, A., Savoye, N., Chauvaud, L., Paulet, Y.M. and Naulet, N., 2003. Decarbonation and 531
preservation method for the analysis of organic C and N contents and stable isotope 532
ratios of low-carbonated suspended particulate material. Anal. Chim. Acta 491 (2), 533
125-133. 534
Lucas, A. and Beninger, P.G., 1985. The use of physiological indices in marine bivalve 535
aquaculture. Aquaculture 44, 187-200. 536
Malet, N., Sauriau, P.-G., Faury, N., Soletchnik, P. and Guillou, G., 2007. Effect of seasonal 537
variation in trophic conditions and the gametogenic cycle on δ13C and δ15N levels of 538
diploid and triploid Pacific oysters Crassostrea gigas. Mar. Ecol.-Prog. Ser. 346, 203-539
217. 540
Marin, M.G., Moschino, V., Deppieri, M. and Lucchetta, L., 2003. Variations in gross 541
biochemical composition, energy value and condition index of T. philippinarum from 542
the Lagoon of Venice. Aquaculture 219, 858-871. 543
McConnaughey, T.A., Burdett, J., Whelan, J.F. and Paull, C.K., 1997. Carbon isotopes in 544
biological carbonates: respiration and photosynthesis. Geochim. Cosmochim. Acta 61 545
(3), 611-622. 546
McConnaughey, T.A. and Gillikin, D.P., 2008. Carbon isotopes in mollusk shell carbonates. 547
Geo-Mar. Lett. 28, 287-299. 548
Miyajima, T., Yamada, Y., Hanba, Y.T., Yoshii, K., Koitabashi, T. and Wada, E., 1995. 549
Determining the stable isotope ratio of total dissolved inorganic carbon in lake water 550
by GC/C/IRMS. Limnol. Oceanogr. 40 (5), 994-1000. 551
Mook, W.G., 1971. Paleotemperature and chlorinities from stable carbon and oxygen isotopes 552
in shell carbonate. Palaeogeogr. Palaeoclimatol. Palaeoecol. 9, 245-263. 553
Mook, W.G. and Tan, F.C., 1991. Stable carbon isotopes in rivers and estuaries. In: E.T. 554
Degens, S. Kempe and J.E. Richey (Editors), Biogeochemistry of Major World Rivers. 555
John Wiley and Sons Ltd, pp. 245-264. 556
Mook, W.G. and Vogel, J.C., 1968. Isotopic equilibrium between shells and their 557
environment. Science 159 (3817), 874-875. 558
Nie, Z.Q., 1991. The culture of marine bivalve mollusks in China. In: W. Menzel (Editor), 559
Estuarine and marine bivalve mollusk culture. CRC Press, Boston, pp. 261-276. 560
Owen, E.F., Wanamaker, A.D., Feindel, S.C., Schöne, B.R. and Rawson, P.D., 2008. Stable 561
carbon and oxygen isotope fractionation in bivalve (Placopecten magellanicus) larval 562
aragonite. Geochim. Cosmochim. Acta 72, 4687-4698. 563
Paneth, P. and O'Leary, M.H., 1985. Carbon isotope effect on dehydration of bicarbonate ion 564
catalyzed by carbonic-anhydrase. Biochemistry 24, 5143-5147. 565
Paulet, Y.M., Lorrain, A., Richard, J. and Pouvreau, S., 2006. Experimental shift in diet δ13
C: 566
A potential tool for ecophysiological studies in marine bivalves. Org. Geochem. 37 567
(10), 1359-1370. 568
Pocker, Y. and Tanaka, N., 1978. Inhibition of carbonic-anhydrase by anions in carbon 569
dioxide-bicarbonte system. Science 199, 907-909. 570
Richardson, C.A., 1987. Tidal bands in the shell of the clam Tapes philippinarum. Proc. R. 571
Soc. Lond. B 230, 367-387. 572
Romanek, C.S., Grossman, E.L. and Morse, J.W., 1992. Carbon isotopic fractionation in 573
synthetic aragonite and calcite: effects of temperature and precipitation rate. Geochim. 574
Cosmochim. Acta 56 (1), 419-430. 575
18 Rowley, R.J. and Mackinnon, D.I., 1995. Use of the fluorescent marker calcein in 576
biomineralisation studies of brachiopods and other marine organisms. Bulletin de 577
l'Institut Oceanographique, Monaco 14, 111-120. 578
Schöne, B.R., Oschmann, W., Rössler, J., Castro, A.D.F., Houk, S.D., Kröncke, I., Dreyer, 579
W., Janssen, R., Rumohr, H. and Dunca, E., 2003. North Atlantic Oscillation 580
dynamics recorded in shells of a long-lived bivalve mollusk. Geology 31 (12), 1037-581
1040. 582
Surge, D., Lohmann, K.C. and Dettman, D.L., 2001. Controls on isotopic chemistry of the 583
American oyster, Crassostrea virginica: implication for growth patterns. Palaeogeogr. 584
Palaeoclimatol. Palaeoecol. 172, 283-296. 585
Tanaka, N., Monaghan, M.C. and Rye, D.M., 1986. Contribution of metabolic carbon to 586
mollusk and barnacle shell carbonate. Nature 320, 520-523. 587
Thébault, J., Chauvaud, L., Clavier, J., Fichez, R. and Morize, E., 2005. Evidence of a 2-day 588
periodicity of striae formation in the tropical scallop Comptopallium radula using 589
calcein marking. Mar. Biol. 149 (2), 257-267. 590
Tripati, A., Zachos, J.C., Marincovich, L. and Bice, K., 2001. Late Paleocene Arctic coastal 591
climate inferred from molluscan stable and radiogenic isotope ratios. Palaeogeogr. 592
Palaeoclimatol. Palaeoecol. 70, 101-113. 593
Wanamaker, A.D., Kreutz, K.J., Borns, H.W., Introne, D.S., Feindel, S., Funder, S., Rawson, 594
P.D. and Barber, B.J., 2007. Experimental determination of salinity, temperature, 595
growth, and metabolic effects on shell isotope chemistry of Mytilus edulis collected 596
from Maine and Greenland. Paleoceanography 22 (2). 597
Wanamaker, A.D., Kreutz, K.J., Schöne, B.R., Pettigrew, N., Borns, H.W., Introne, D.S., 598
Belknap, D., Maasch, K.A. and Feindel, S., 2008. Coupled North Atlantic slope water 599
forcing on Gulf of Maine temperature over the past millennium. Clim. Dyn. 31 (2), 600
183-194. 601
Weidman, C.R., Jones, G.A. and Lohmann, K.C., 1994. The long-lived mollusk Artica 602
islandica - a new paleaoceanographic tool for the reconstruction of bottom
603
temperature for the continental shelves of the northern North-Atlantic Ocean. J. 604 Geophys. Res. 99 (C9 ), 18305-18314. 605 606 607 608
19
Figures
609 610
611
Fig. 1. Schematic diagram of the experimental system. The complete experimental system 612
consisted of three clam and buffer tanks, one for each clam batch. The same algae culture was 613
used for the three clam batches. 614
615
616
Fig. 2. Photographs of shell transversal section. Growth direction is left to right, the outside of 617
the shell is toward the top of picture. A: The cleft corresponds to a growth stop due to clam 618
harvesting in the field on the 18th of August 2008. Clams were kept in laboratory for 64 days. 619
The two calcein stains at t15 and t35 are visible. Shell edge corresponds to the end of the
620
experiment. B: Drill holes (300 µm diameter; 350 µm depth) made in the middle of the outer 621
layer. Scale bar = 500 µm. 622
20 623
624
625
Fig. 3. A: DIC stable carbon isotope values (δ13CDIC) during the experiment. Three salinity
626
conditions (20, 28 and 35) were tested from days 35 to 64. B: δ13CDIC as a function of salinity
627
during the experiment. Error bars represent the analytical precision (1 σ). 628
21 630
Fig. 4. Evolution of stable carbon isotope values (δ13C) of Manila clam tissues (muscle, 631
digestive gland, mantle and total soft tissues) and phytoplankton during the experiment. 632
Values are expressed as means and error bars represent standard deviations, n = 5 during the 633
first 35 days; n = 15 from day 35 to 64 because the results for the three different salinities 634
were pooled. 635
22 637
Fig. 5. Evolution of stable carbon isotope values (δ13Cshell) in R. philippinarum shells during
638
the experiment for the three salinity conditions (20, 28 and 35). Values are expressed as 639
means and error bars represent standard deviations, n = 15 during the first 35 days; n = 5 from 640
day 35 to 64 for each point. 641
23 643
644
Fig. 6. δ13Cshell vs δ13CDIC in clam tanks for samples taken over the experiment. Error bars
645
represents standard deviations. The solid line shows the linear least squares regression 646
calculated with all data obtained during this experiment (r² = 0.77, p < 0.0001, n = 83). 647
24 649
650
Fig. 7. Estimates of the proportions of metabolic carbon (CM) incorporated into shell
651
carbonates using the equation of McConnaughey et al. (1997). Muscle, digestive gland, 652
mantle, total soft tissues and phytoplankton carbon isotope composition were used to 653
approximate δ13CR. Values are expressed as means and error bars represent standard
654
deviations. Different patterns are observed depending on the tissue used for the approximation 655
of δ13CR.