Digitized
by
the
Internet
Archive
in
2011
with
funding
from
Boston
Library
Consortium
Member
Libraries
DEWEV]
Massachusetts
Institute
ot
Technology
Department
ot
Econonnics
Working
Paper
Series
100
YEARS
OF
COMMERCIAL
REAL
ESTATE
PRICES
IN
MANHATTAN
William
C.
Wlieaton
Mark
S.Baranski
Cesarina
A.
Templeton
Working
Paper
08-02
December
10,2007
Room
E52-251
50
Memorial
Drive
Cambridge,
MA
021
42
This
paper can be
downloaded
witfnoutcharge from
theSocial
Science
Research
Network
Paper
Collection athttp;//ssrn.com/abstract=1
107535
HB31
Draft:December
10, 2007.100 years
of
Commercial
Real
Estate
prices
in
Manhattan
William
C,Wheaton
Department
ofEconomics
CenterforRealEstate
E52-252B,
MIT
Cambridge, Mass. 02139
[email protected]
Mark
S. BaranskiOverland
Development
Group,LLC
Boston,Mass.
CesarinaA.
Templeton
Overland
Realty Capital,LLC
Boston,
Mass.
ABSTRACT
This paperis abletoputtogether a database of
86
repeatsalestransactions for officeproperties inlower
and
mid town
Manhattan
spanning theyearsfrom 1899
through 1999.Using
thisvery limited data base, decade-interval changesinreal property pricesareestimated- with varying degrees ofprecision.
Our
conclusionsaretwo.First, adjustingfor inflation,
commercial
officepropertyvalues are30%
lowerin1999
than theywere
in1899. Secondly,within
any
decadevalues oftenriseand
fallby 20-50%
in realtemis.With
theseresults, thelong termhistoric returntoNew
York
commercial
propertymust
be
mostly becomprised
ofyieldwith capitalgains limitedtogeneral inflation. OtherI. Introduction.
Recentlytherehas
been
renewed
interestthe longtermappreciationof
real estate assets-both thoseoccupied
by
households aswellthatusedby
firms. Earlystudies, suchas thatby Hoyt
[1933]and
laterMills [1969] focusedon
land valuesand
showed
thatwhile theaggregate assessed value
of urban
landsoars during periodsof
rapidurban
growth, landvalue per capitain
Chicago
was
almostthesame
in1930
as in 1845
-
when
adjusted forinflation. This is consistentwith therecent
work
ofAtack
and
Margo
[1998].Using
actual landparcel transactions
from
New
York
Citythey determinethatany
pricelevelincreases firom
1835
to1900
aremainly
due
tothe CivilWar
decade's general priceinflation. Factoringthat out, Manliattanland prices in
1900
were
quite similarinreal dollars to 1835. Studiesofland valuesinthe20*
century,suchas thatby
Edeland
Sclar[1975] again
showed
little gaininassessed residentialpricesbeyond
inflation inBoston
overthe period
from 1900
to 1970.A
1997
paperby
Eicholtzhowever,
has causedmany
researcherstopause. Consistentwiththe
work
justdiscussed Echoltzshows
thatthere hasbeen
littlerealgrowth
inAmsterdam
house
prices since1628
-
almostthreecenturies.Despite
no
longtermtrend,therearesustained swings in realpricesoverparticularperiodsranging
from
asshortas adecade
to aslong as 50 years.Studies
of
commercial
property values (e.g. Fisher,Geltner,Webb
[1994]) all arebasedon
more
contemporary
dataand have
tended also to findlittleappreciationbeyond
inflation
-
atleastsince the late 1970s. Similarly, several authorshave
notedthatcommercial
propertyrents tendtobe
stationary inrealdollars (e.g.Wheaton
and
Tortoexamining
100years ofcommercial
office values inManhattan
-
creatingarepeatsalespriceindex withactual transactionsdata.
We
findthatsince 1899
ouroffice indexsuggests values inManliattan
have
actually fallen slightly-
adjustedfor inflation.We
alsofindthatduring
many
individual decades, priceshave
risen orfallenasmuch
as50%
on
top ofinflation-
butthesedecadal estimates arevery imprecise.We
devisea test forwhether
the cumulative(real)appreciationoverthisperiodis significantfrom
zero-
and
ourfindings areupheldat
wide
confidencelevels.Thus
the longterm
returntoowning
commercial
realestateinNew
York
iscomposed
mostly ofyield plus appreciationthatequalsonlyinflation.
We
reviewsome
other studies ofreal estateinvestmentreturnsthatsuggestthe yield
from
real estate historicallymay
in facthave
been
highenough
to coverboththe considerablerisk
and
lower appreciationthatisestimated inourwork
here.Our
paper
is organizedas follows. In thenextsectionwe
brieflyreview
some
theoreticalarguments
and
empirical factsabout long term propertyvaluesand
assetpricing-
to tryand
reconcile thefindings todate. SectionIIIthen describesour efforts tocollectrepeatedsales transactions for a setof
Manhattan
officebuildings. SectionIV
reviews ourestimation
methodology and
sectionV
presentsourresults. In SectionVI
we
illustratesome
corroborating evidence,while inSectionVII
we
draw
some
concludingobservations.
II. Theoretical
Models
ofReal
EstateAsset Prices.Realestate assetpricetheory starts withthe Ricardian
Monocentric
rentmodel
(e.g.Muth
income)
acrossurbanlocations.The
comparativestaticresultsofthismodel
(asshown
by
Wheaton
[1974]) areunambiguous.
Populationgrowth
aloneis sufficient to generatesignificant realincreasesinland orhousing rent
-
iftransportationtechnologyremainsthe same.
The
problem
isthatoverthelasttwo hundred
yearsthishas notbeen
the case.Infact relative to
walking
(thepreferredmode
in 1800) early streetcars,subway
railtransit
and
then automobileshave
allincreased the speedoftravelby
afactorofasmuch
as 10.
Even
allowingforthe greatermonetary
costs ofthesenewer
modes
oftravel,itcould easilybe arguedthat such
improvements have
offsetthe impactof populationgrowth
-
leadingto theempiricalresults ofEicholtzand
others.While
populationgrowth
and
spatial expansion shiftthe rentgradientupward,
transportationimprovements
"flatten" itfrom
theedge
inward. Virtuallyallstudiesof long term changes in landgradients, suchas Mills, or
Atack and
Margo
find strong evidenceof"flattening"-
inmost
cases sufficient togenerate littlechange
in average overallvalues.Gin and
Sonstelie[1992] demonstrate
how
specifictransportationimprovements
(thedevelopment
ofthestreetcar)are directlyresponsibleforthe decliningland rent gradientinthe latterhalfof
the 19"" century.
Muth's
version ofthe monocentricmodel
alsopoints outthat instudyingurban
history,we
must
considerthe roleand
costofhousing capital aswellasthe elasticity ofsubstitution
between
capitaland
land.We
know
of onlyone
systematic studyon
longerterm changes in
US
construction costs(Wheaton
[2006]}and
thisshows
thattheyhave
grown
justwithinflation-
atleastsince 1967.If thisholdsaswellover longer spans ofAdded
totheevidenceon
landrent-
itwould seem
thatboth "factors of production"might
notgrow
fasterthaninflation. Inshort, giventhehistoric changes intheparametersofamonocentricmodel, itisnotalall clearthat
we
should expectthe annualrentforrealestate to
have
grown
fasterthaninflationoverthelastcentury ortwo.In aseminalpaper,
Capozza
and
Helsley [1990] comiect urban rentmodels
withmodern
assetpricing theory.
These
authorsallow populationortravel costs tochange
over timewithuncertainty
and
this then generates landrents thatgrow
and
fluctuateaccordingly.Capozza
and
Helsley then deriveassetpricesfor landateachlocationand
theoption-basedrule fordeveloping
new
landatthe urbanedge.The
ratio ofassetprices tocurrentland rent varies across location exactly asFinance
Theory
would
suggest-
being higheratlocations
where
rentisgrowing
fasterand
lower atlocationswhere
there ismore
uncertaintyaboutthisgrowth.
Recently, themonocentric
model
itselfhasbeen
modified.Ogawa
and
Fujita [1980],Anas
[1996],and
Wlieaton [2005] all arguethat as citiesgrow, the resultantincrease incongestion costsgenerates incentives forjobs todisperse.
Such
jobdispersal leadstoshorter
commuting
and
toland rent gradientsthatmay
have
little orno
slope.Hence
even
withconstant transporttechnologyurban population
growth
may
leadtolittle increaseinlandrent.
McMillen
and Smith
[2003] findempirical supportfortheargument
that aseconomic growth
beginsto congest the transportationnetwork, firms disperse spatiallyand
in thatprocess thisdispersal significantlyameliorates the congestioninducedby
Inshort, thejuryis clearly stillout
on whether
we
should expectland orreal estate renttogrow
above and
beyond
inflation. Historically,major
technological advances intransportation construction costs
may
have been
sufficient to offsetrapidurban
growth.Going
forward, thereis theprospectthatemployment
dispersalmay
do likewise.Whatever
rentgrov^h
patterstechnologydictates shouldbe capitalizedintovalueswithappropriaterisk
premiums.
III. Collectingtransaction datafor
Manhattan
OfficeProperty.We
began
thepresent study withan inventory ofcurrently standing officebuildings inManhattan
courtesyof
theCostarGroup,and
TortoWheaton
Research. Inboth ofthesedatabasesthere isinformation only
on
building age, storiesand
square feet-
nothingon
"quality", "prestige"orarchitecturalvalue.
We
restricted ourselvesto institutional gradeproperties, 10 or
more
stories, withelevatorsand
whose
total square feetis at least250,000. This initial filterruled out
most
ofthetruly older properties in Manliattan(builtpriorto 1880).
The
resultingsample
contained253
propertiesin"Midtown"
Manhattan
and
82"Downtown"
office buildings.The
Costar databasecontainsan estimate ofthe datethatthe buildingwas
originallyconstmcted.
These
dateswere
mostlyclustered intwo
distinctperiods1890-1929 and
1960-1989. For each propertythebuilding address
was
matched
withthe building databaseinthe
New
York
CityConstructionRecord
Guide and
theNew
York
City BuildingRecords
Office.These
databasescontainall original constructiondocuments and
and
we
were
able toobtain a firm estimateofalloriginal tenderedconstruction costs forthe building.
These
costswere
inthe rangeof
$10-$20
per squarefoot forthefirst clusterof
properties(1910-1929)and S60-$240
forthemore
recent period.To
determine"total"development
costs,we
useda conservative "rule ofthumb"
inthe industrythatlandand
softcosts constitute slightly
more
thanhalfofthe totaldevelopment
ofa property.Thus
increasing the original construction costs
by
afactorof1.2provided anestimate oftheproperty's initial"value"-at the time of development.
With
this inifial"transacfion",we
thensearchedthe salesand
transfers containedin thedatabase ofthe
New
York
City Real Estate Board. Thisdatabaseis organizedby
addressand
contains ahuge
number
of"exchanges"
and
"transfersofinterest"(total orpartial) inadditionto full titletransfers. For each transaction, in additionto a date, there isa dollar
valuebased
on
the transfer taxrate thatwas
thenineffect.These
dollarvalueswere
theninflated into
1999
(constantdollar)values. Inordertobe surethatwe
were examining
true"arms
length" transactions,we
restricted ourdefinitionofa"sale"toinclude onlytransfers that
met
allofthe followingcriteria.-
The
buyer
and
sellerhad
differentlastnames
orwere
differententities.-
Bank
orother"foreclosures"were
excluded.-
A
fiallpropertytitlewas
transferredwithno
residual claims orpartial interests.Another
consideration iswhether
thepropertywas
significantly alteredorrenovated.Of
course overthis timespan,
many
properties builtinthe earlyperiodswould
have
had
property redevelopments.
Such
changes areoftennotedinthe Costardatabase (alongwith adate).
Hence
any
pairoftransactions thatspanned
a Costar"redeveloped"datewas
excluded.
With
all ofthese variousfilters,the finaldatabase contained only 86transactionpairs.
32
pairsoccurredin 17downtown
propertiesand 54
pairswere
observed in
28
midtown
properties. Several propertieshad numerous
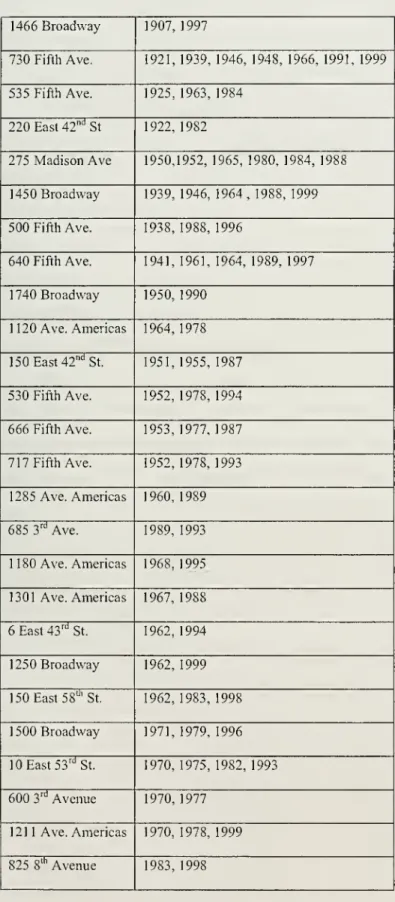
"sales". Table 1contains a hstofthe
45
propertiesand
theirsale dates.[Table 1]
As
afinal filterwe
removed
5 observationsinwhich
propertieschanged
hands within2-years atpricesthat
were
more
thantwiceorless than halfofthatatthefirst date.Most
reported indicesarethus constructedwith 81 sale pairs.
IV,
Survivorship
and
otherBiases.The
procedureused
to createthe repeatsales doeshave
the possibilityof aninterestingbias to it
-
itprecludes selectingpropertiesthathave
not survived.There
is a longliterature
on
survivor bias inthe analysisof
stocksand
mutualfiinds (e.g. Elton, Giubber,Blake
[1996]), butinthe caseofreal estateproperties,we
show
thebias (a)tendstobe
very,very small
and
(b) can runin eitherof
two
directions-
hence
possiblynone.The
company
Emporis
(emporis.com) maintains ahistoricalbuilding inventory forthemajor
cifiesoftheworld. InNew
York
they listauniverse of "highrise"buildingswhich
contains
5579
properties (ofall uses)."High
rise" isdefinedslightlymore
broadly than ourfilter:10+
stories, butwithout aminimum
size.A
littlemore
than4000
ofthe listeddemolished.
Only
178 "highrise"propertiesbuilt since1899 have
everbeen
demolished.Hence
any
survivorship bias issimply ofno
consequence. Surviving "highrise"propertiesrepresent
more
than96%
of
allsuchproperties ever constructed.The
investment
performance
of
asample
of suchproperties willbe
virtuallyidentical to thatofthepropertyuniverse atlarge.
In addition, asdiscussed in
Wheaton
[1982], there aretwo
conditionsunder
which urban
re-development can occur.First, buildings are
more
likely tobedemolished
and
replaced (andhence
notshow
up
inthe sample)when
thelandunderneaththem becomes
more
valuable overtime. This could
mean
thatsurviving propertieshad
lower land value growth. Second,properties are alsomore
likely tobe demolished
when
theircapitalhasbecome outmoded
or depreciated. Thiswould
mean
thatsurviving propertieshad
increasedcapitalvaluerelative to non-surviving.
On
netthen itisjustimpossibleto saywhich
way
theverytiny survivorship bias operates-
ifit existsatall.Finally, allrepeatsaleindexes suffer
from
amore
troublingset of problems, recentlyresearched
by
Harding, Rosenthal,Sirmans
(2007). Ifproperties deteriorate over timeintrinsicallywithage,then the indiceswillunderestimate"true"price appreciation. If
improvements and
renovationsaremade
tothepropertybetween
saledates then theapproach
overestimates "true" price appreciation.The
bestthatwe
coulddo
was
to dropthose properties
from
oursample
thatwere
listedby
Costar ashavingundergone
IV,
Estimating
Decade
Inflation rateswith
aRepeat
SalesModel.
Itisclearthatwiththe limited
number
ofclean transaction pairs (86 or 81)we
would
notbe ableto
measure
price appreciationwithmuch
precision. Yearlyappreciationrateswould
be impossible,and
using longintervalsruns theriskofviolating the assumptionthatappreciationwithin the interval is constant.
As
acompromise
we
decidedtousedecades
-
which
would
involve 10 degrees of freedom.The
approachworks
as follows.Following Bailey,
Muth
and
Nourse, considerthemodel
of propertypricing(P) inequation (1).
The
vectorsX
and
B
representproperty attributesand
"Hedonic"
coefficients therefore.
Then
there are"fixed effect"variables foreachdecade
Dj, along with correspondingcoefficients Oj.We
observetheproperty first during decadeT',and
we
define Sjt' as equalto 1 ifdecadej isprior tothe transactiondecade
T'and
equal tothe fraction
of
decadeT' thathas passed beforethe actual observedpricedatewhen
j=T'.When
j> T'we
set Sjt- equal to zero. Inthismodel
ratherthanhave
a single fixedeffectfortheyear(or in this case decade) thatthe propertyis observed
we
have
thesum
oftheyearlyeffects (decades)leading
up
totheobserved yearfrom
some
base year 0=1)-Thus
theestimatedvalues ofaj representthatdecade's inferredpriceappreciationraterather
than itspricelevel.
Z',,
=^'Zexp(X«,^,^,r)
(1)Ifthis
same
property thensells at alatertime period (T>T')we
have
anew
setP,
=^'A^exp(^«^Z)^.5,,)
(2)Taking
theratioand
thenlogswe
get:log(P,)
-
log(P,,)=
«,,Z),,(1-
S,.,.)+ Y.ajD^Sj,
(3)j=r+\
Out
particularapplicationofrepeatsalesmethodology
has aunique shortcoming (inadditionto allthe
normal
criticisms as discussedby Goetzman, Case
andPoUakowski
[1992]).
As
createditis basedon
the assumptionthatpriceappreciation isrelativelyuniform
duringthe intervalsrepresentedby
the fixed effects. Inmodels
with quarterly oryearly fixedeffects, thisassumption is probably nottoo faroff, butwith decadeintervals
itis clearlyabit
of
a stretch. Unfortunatelythatisallthatispossible with ourlimitedsample
size.V. Results.
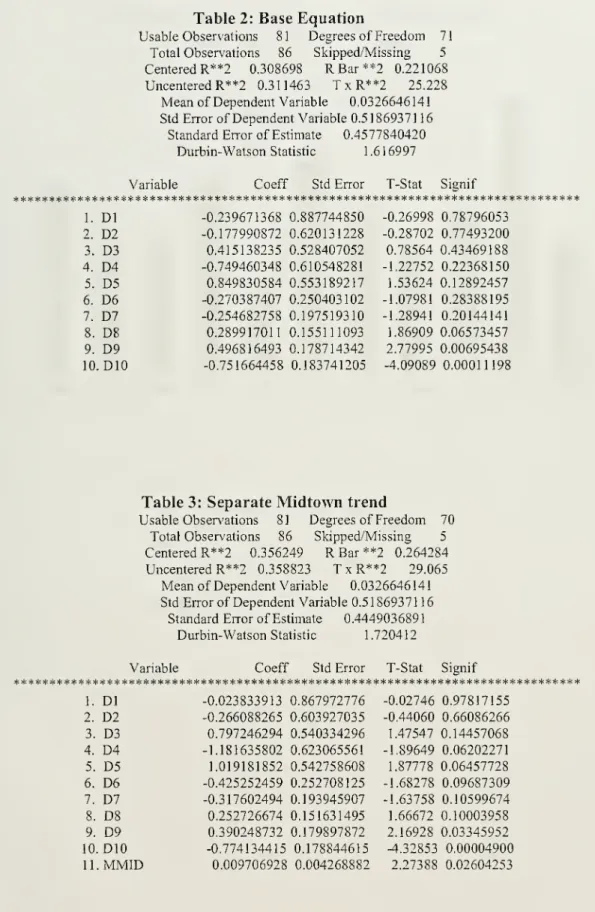
The
primary equation estimateduses 81 sale-pairs ofobservationsand
includesno
otherdatathanthe 10 decadal
dummy
variables. This isshown
in Table2. Itis clearthatthereisvery littleprecisiontothe estimates
of
appreciationfrom 1899
through1929.During
the depression,
WWII
yearsand
the early postwar
boom
the estimateshave
abitofprecision, butstandarderrorsarestill almostas large asthe coefficientitself It is only the
effects forthe lastthree decades thataretruly statistically significant. It
must
beremembered
thatallestimates areof decadeappreciationinrealterms-
afterCPI
InTable 3
we
explorethe issue ofwhether
midtown
and
downtown
Manhattan might
have
had
systematicallydifferent overall (100year) appreciation.To
do
thiswithtwo
setsof
dummy
variableswould
clearly stretchthesample
-
particularlydowntown
where
there
were
only32 observations. Instead,we
constructeda variablewhich
was
theproductofa
midtown
(location) fixedeffectand
the#
yearsthatspanned
eachsalepair(thevariable
MMID
inTable 3).We
interpretthe coefficientof
this variable as theaverage 100 year annual differencein appreciation
between
midtown -
relative todowntown.
Its significancesuggeststhat yearly appreciationwas
on
average slightly lessthan apercentper yeargreaterin
midtown
thandowntown -
overthe lastcentury.[Tables2, 3]
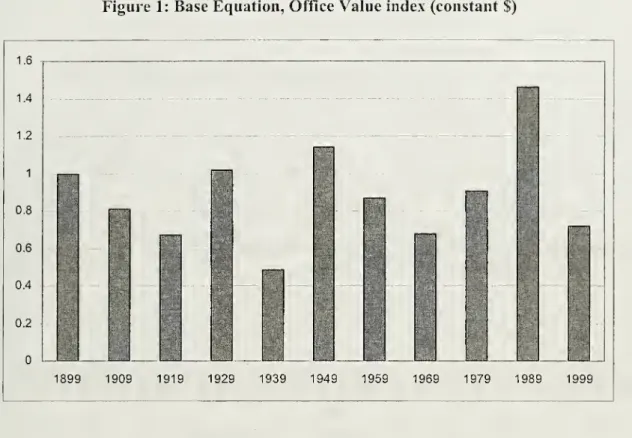
InFigure 1
we
takethe estimatedcoefficients inthe basemodel
(Table2)and
reconstructfrom
equation(1) an index ofPricelevels.From
1899
to 1919,real pricesdecHne
a littlelessthan
1%
yearly.Then
during the 1920sthey rosealmost3%
yearlyin real terms.The
depression
saw
realpricesdrop in half, aiadthe 1940ssaw them
slightlymore
thanfullyrecover. Real prices
dropped
about2%
yearlyfrom 1949
to1969
and
thenrose3%
yearlyfrom 1969
tothefamous
peak
inpropertyvalues of1989.From
1989
to1999
pricesdropped
inhalf-
againadjusted for inflation.Our
datadoesnotcoverthe widelyheraldedresurgencein
New
York
prices ofthe last7-8 years.The
conclusionsfrom
Figure 1 arequite clear. Just likehousesin theEicholtz study,Manhattan
officespace did notoutpaceinflationoverthe previouscentury. Similarly,over
any
given 10-30 year periodprices canriseorfallquite considerably in realterms.Real estatethenhas lots ofriskover reasonableinvestorhorizons.
The
imprecision withwhich most
decade inflation ratesare estimatedis a cause ofconcern.
However,
itis actuallypossible toconstruct amuch
more
precisetestforthecumulative
change
inthe price index overthe 10 decadalintervals. Insome
sensethis isthe questionof
most
interest.The
test forwhether
thesum
ofthe decadaleffectsisdifferent
from
zero is distributed"F",althoughitsvalueinvolvesa complicatedcalculationusingthe full
VCV
mati-ix ofthe individualdecadeeffects.We
findthattheF
value forthe
models
inTables 2-3 rangesfrom
.51 to .96.With
theappropriate degrees of freedom, the nullhypothesis ofno
cumulativechange
inrealpricelevels canbe rejectedonlyata .53 to .67 confidencelevel
-
nowhere
nearnormal
test limits.Hence
whilewe
are
somwhat
unsure about each decade'sinflation,we
are quite firmground
asserting thatoverthis century cumulativerealprice
growth
was
not significantly differentfrom
zero.VI.
Corroborating Evidence:
theReturn
toReal
Estate.The
conclusionthat inthe lastcentury,New
York
real estatehasnotoutpaced inflation interms ofappreciation is fully supportedin
two
othersourcesofdata.The
first is directdata
from
thelong-termBLS
surveyof urban apartmentrents-
asurveyconducted sincebasis. Currentlyalmost 80
MSA
arepartofthe survey,which
was
startedjust afterWWI.
Originallyonlyahandful ofcities
were
surveyed-
includingNew
York.The
BLS
survey is a repeatsample.Each
period, units areresurveyedtoassesany change
inthe rentthatthe currenttenantispaying.
When
tenants change,the landlordiscontacted,
and
thenew
rent(andtenant) isobtainedfor futuresurveying.Recent
work
hascriticizedthe construction
of
suchrepeat-surveyhousing indexes.Nakurma
(2007)argues thatthe
BLS
missesmany
rent increases thatoccurastenants change,and
that inadditionthey failto correctforthe inJierent
downward
biasthat exists in suchindicesdue
to depreciation.
As
discussedpreviously, there isalsoconsiderableupward
biasinrepeattransaction indices
due
toimprovements and
actualmaintenance
expenses.The
debateon
whether
thesetwo
longmn
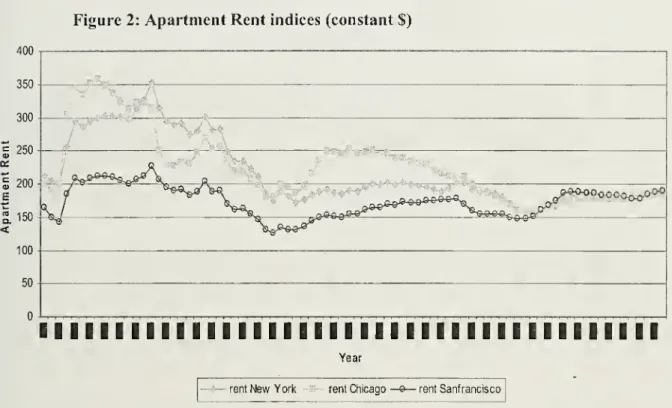
biases cancel outis stillopen.InFigure2
we
present theCPI
rent series fortliree cities since 1918, includingNew
York.
The
indexes aredeflatedto constantdollars tobe
consistentwith Figure 1.The
conclusionis thatrents are
no
higherin1999
than 1918when
adjusted for inflation.Some
ofthe cyclicmovements
inFigure2 are also consistentwiththe findingsdisplayedinFigure 1.
Between
1918
and 1930
bothmarkets experiencesignificant realappreciation,
and
between 1930 and
the early 1940s bothshow
significant realdepreciation.
Both have
increases followingWWII,
and
there iscommon
realpricegrowth
duringtheboom
ofthe 1980s.What
emerges
from
both ourstudyand
theGovermnent's
CPI
datais that realestate is anasset
whose
income and
valuekeep
pace with inflationoverthelongrun.At
thesame
time, itexperiences considerableriskat
decade
orhigherfrequency.An
importantquestionthenis
whether
theyieldfrom
realestateprovides areasonablereturntoinvestors. Forthis to
be
the casereal estateyieldsmust be
equivalenttothemarket
risk-freereal return plus a
commensurate
riskpremium.
The
realinterest rateon
treasuries(ex post)tendsinthe long runto be closetothereal rate of
economic growth (2-5%) and
the
Moody's
riskpremium
forBAA
bonds
has rangedfrom
1%
to3%
sinceWWII. As
discussed
by
Blanchard
(1993), the equityriskpremium
hasbeen
much
higherhistorically, although ithasdeclined shaiplyinrecentdecades.
Thus
ifrealestateappreciateswithinflation
we
might
expectyieldstobe
inthe5%-10%
range.A
second
supportingstudyisby
Kaiser(1997),who
creates along termserieson
thetotal investmentreturn
from
officebuildings.From
1977
forward,the study uses wellknown
NCREIF
nationaloffice data-
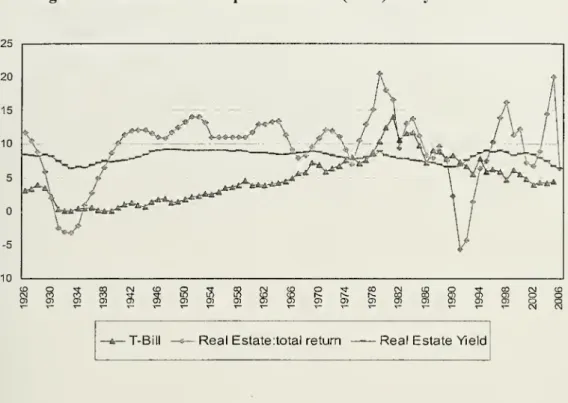
which
inFigure 3 hasbeen
updated through 2006.From
1926
to 1977, Kaiserdevelopsatotalreturnseriesfrom
private portfohosand
priorstudies
of urban
officebuildings.From
1977
to2006
theNCREIF
databreaksouttotalreturn intoappreciation versus yield,
and
duringthistimemuch
ofthe returnhasbeen
yieldwith appreciationin factbarelykeeping
up
withinflation.We
have been
quitesuccessfulat
modeling
the share oftotal returnthat isyield-
overtheNCREIF
period-as afunction ofinterestrates
and
officemarket
vacancy.During
periodsof high vacancy,appreciation isnegative
and
yieldstendtorise (and vice-versa).We
applythismodel
vacancy
inthelargestUS
cities. Thisproducesthe estimatedofficeyield series (forpriorto 1977)thatis
shown
inFigure3.Figure3 reveal
two
features aboutoffice investmentreturns. First,yieldstendtobestable,
and
wellabove
risk free real interestrates.From
1940
to1980
for example,theestimatedyieldsrange
between
8%-9%
whilereal treasuriesaveraged2%-3%
(exceptingtheperiodof highinflationinthe late 1970s).
Such
yieldswould seem
toprovideanample
riskpremium
(500bps+). Secondly,the appreciationcomponent
(thedifferencebetween
totalreturnand
yield)cumulatively aggregatesup
tobeingslightly lessthanCPI
inflation. Appreciationis also
more
volatileand
itstiming is similartothatof Figure 2:the
two major
episodesof
price deflation occurinthe 1930sand
thenearly 1990s inbothseries.
[Figure 3]
VII.
Why
doesReal
estatenot appreciatemore?
The
results ofthis analysis arecompletely consistentwithanumber
of
stylizedfacts. Forexample
itis widelyknown
thattheEmpire
statebuildingwas
constnictedfor about$22
asquarefoot
from between
1928-1930. Itis alsoacknowledged
thatthe 1920'ssaw
rampant
land inflation(ourdatashow
this aswell)and
sowe
might
boost our estimate ofthenon-construction share
from
1.2 tosay 1.5 times constructioncosts. Thisgivestotalbetween
1929and
2000 and
one arrives atan
estimateforcurrent priceof about$500
persquare foot.This is reasonably closetotransactions prices inManliattan inthe late 1990s
for
prime
properties.The
results canalsobe consistentwiththecombination ofhistoricalpopulationgrowth
and
transportationimprovements
thatcharacterizedNew
York
sincethe early 1800s.From
1830
to 1900,New
York
Citygrew
from
a populationof300
thousandto 1.8million
and began
to spillbeyond
Manhattan.With
atriplingof average density, suchgrowth
would
have
necessitated adoubling ofthe city'sradius-
orequivalently ofaverage
commuting
distances. Itis easytoimagine
thatthe introductionofeven
theinefficientstreetcar
doubled
averagecommuting
speedleavingtotalcommute
timestothe
urban
"edge"thesame.From
1899
to 1999,the City'spopulationgrew
roughly fourfold again,
and
expanded
intothe fulltri-state area.During
thisperioddensity actuallybegan
to decline.Even
ifthedistance toNew
York's urbanedge
had
increased four fold-the
commensurate
greater speedsofunderground
subways, trainsand
automobilescould stillleave average
commute
timesto theedge
constant-
and hence
realland valuesaswell! Ifconstruction costs
grew
only withgeneralinflationduringthis century-
asthey
have
since the 1960s-
thenassetpriceswould
alsonot increasein realterms.Going
foi-wardtheenormous improvements
intransportationthatcharacterized thelast centuryarejustnotapparent. Fortunately,New
York's
populationis expectedtogrow
only very slowlyif atall
-
nothing like the6%
yearlyratesofthe 1800s-
or4%
rates oftobe theincreased suburbanizationofjobs. Sliilton, lias
shown
that inmost major
US
metropolitanareas, corporateheadquarters
have
completelymoved
to suburban"edge
cities".
As
aresult,metropolitanareas arebecoming
more
and
more
"polycentric"(Guilliano
and
Small). Inmetropolitanareaswith dispersedemployment,
populationgrowth
isaccommodated
notby
longercommutes
and
risingdensity,butby
thecreationof
more
and
newer
"edge
cities" (Helseleyand
Sullivan). If thisprocess continues, theneven
in fastergrowing
metropolitanareas, averagecommuting
timesand
landvaluesneed
notrise inthe future.Thus
Historymay
in factrepeat itself-albeit for differentREFERENCES
J.
Atack and
R.Margo,
"Location, Location, Location".The
PriceGradient forUrban
Land, Journalof Real
EstateFinance
and
Economics,
16, 2,(1998)135-151.
A.
Anas
and
I.Kim,
"General EquilibriumModels
ofPolycentricLand
Use",Journal of
Urban
Economics,
40, (1996) 232-256.M.J.Baily,R.F.Muth, H.O.Nourse,
"A
RegressionMethod
forRealEstate Price IndexConstruction",JournaloftheAmericanStatisticalAssociation,58 (1963) 933-942.
Blanchard, OlivierJ,
"Movements
intheEquityPremium," Brookings
Papers
on
Economic
Activity,(1993)No
2, 75-138.Dennis
Capozza,and
RobertHelsley."The
Stochastic City,"Journal of
Urban
^co77omzc5, 28, 3 (1990) 187-203.
Dennis
Capozza, PatricHendershott,and
CharlotteMack.
"An Anatomy
ofPriceDynamics
in IlliquidMarkets: Analysisand Evidence
from
LocalHousing
MdiT\iQis,"Real
EstateEconomics,
32 (2004) 1-21.Bradford Case,
Hemy
O. Pollakowski, and SusanM.
Wachter."On
Choosingamong
HousingPriceIndexMQihoAologits,"
AREUE
A
Journal, 19 (1991),286-307.M.
Edeland
E. Sclar,"The
DistributionofResidentialValue
Changes:Metro
Boston, 1870-1970", Journal
of
Urban
Economics,
2,1, (1975) 366-387.Piet Eicholtz,
"A
long run house price index: the Herengracht Index 1628-1973", RealEstateEconomics, 25, 2 (1997) 175-192.
E. Elton,
M.
Gioibber, C. Blake, "SurvivorshipBiasand
thePerformance
ofMutual
Funds",The
Review of
FinancialStudies, 9,4, (1996) 1907-1120.J.Fisher, D. GeltnerandR.B.
Webb,
"ValueIndicesofCommercialRealEstate: aComparisonof IndexConstmctionMethods", JournalofRealEstateFinance
and
Economics, 9 (1994) 137-164.
A.
Gin and
J. SonsteHe,"The
StreetcarandResidentialLocationin 19* CentuiyPhiladelphia",
Journal of
Urban
Economics,
42, 1, (1992) 92-107.WilliamN. Goetzman, "The Accuracyof RealEstate Indices: RepeatSales Estimators",
Journal ofRealEstateFinance
and
Economics, 5 (1992), 5-54.G. Guiliano
and
K. Small, SubcentersintheLos Angeles
Region,Regional
J.Harding, S.Rosenthal, C.F. Simians, "Depreciation of
Housing
Capital,Maintenance,
and
House
PriceInflation",Journalof
Urban
Economics,
61,2,(2007), 567-587.
R. Helseley
and
A. Sullivan,"Urban
subcenterformation".Regional
Scienceand
Urban
Economics,
21, 2, (1991) 255-275.Homer
Hoyt,One
Hundred
Years ofLand
Value
in Chicago,University ofChicago
Press,Chicago
III. (1933).Ronald
Kaiser,"The
Long
Cycle in RealEstate",Journal ofReal
EstateResearch, 14, 3, (1997) 233-256.
McMillen,
D.and
S. Smith,"The
Number
of Subcenters inlargeUrban
Areas"
Journal of
Urban
Economics,
53, 3, (2003), pp. 321-339.E.S. Mills,
"The
Measurement
and Detenninants of Suburbanization",Journal of
Urban
Economics,
32,3, (1992) 311-1,'&1.E.S. Mills,
"The Value of
Urban
Land", inH. Perloff(editor).The
Qualityof
theUrban
Environment, (1969),Bahimore,
JohnsHopkins
UniversityPress.RichardMuth,Cities andHousing,University ofChicagoPress,Chicago(1969).
L.
Nakamura,
"Gimme
Shelter, Rentshave
Risen, notfallen, sinceWWII",
Business Review,
2Q, 2007
(FederalReserve
Bank
ofPhiladelphia).H.
Ogawa
and
M.
Fujita, "Equilibrium landusepatterns inanon-monocentric
city".Journalof Regional
Science, 20,(1980) 455-475.Leon
Shilton, Craig Stanley, "Spatial Patterns ofHeadquarters", Journal of RealEstateResearch, 17, 3 (1999) 341-364.
WilliamWheaton, "TheSecularandCyclicBehavior of'True' ConstructionCosts",
Journal ofRealEstateResearch,29,1 (2007) 1-26.
William
Wheaton,
Raymond
Torto, "OfficeRent
Indicesand
TheirBehavior
Over
Time",Journal of
Urban
Economics,
35:2, (1994), 99-999.WilliamWheaton,
"A
comparativeStaticAnalysis ofUrbanSpatial Structure",Journalof
Economic
Theoiy, 12(1974) 223-239.William Wheaton, "Urban Spatial Development with Durable but Replaceable
Capital", Journalof Urban Economics, 12,3(1982)53-67.
WilliamWheaton,"Commuting, Congestionand
Employment
DispersalinCitieswithTable
1:Property Transactions
1466Broadway 1907, 1997 730FifthAve. 1921, 1939, 1946, 1948, 1966, 1991, 1999 535Fifth Ave. 1925,1963,1984 220East42"''St 1922, 1982 275MadisonAve 1950,1952, 1965, 1980, 1984, 1988 1450Broadway 1939, 1946, 1964, 1988, 1999 500FifthAve. 1938, 1988, 1996 640FifthAve. 1941, 1961, 1964, 1989, 1997 1740Broadway 1950, 1990 1120Ave.Americas 1964, 1978 150 East42""St. 1951,1955,1987 530FifthAve. 1952, 1978, 1994 666FifthAve. 1953,1977, 1987 717FifthAve. 1952,1978, 1993 1285Ave.Americas 1960,1989 685 3'''Ave. 1989, 1993 1180 Ave.Americas 1968, 1995 1301 Ave.Americas 1967, 1988 6East43^' St. 1962,1994 1250Broadway 1962, 1999 150 East58'" St. 1962, 1983, 1998 1500Broadway 1971, 1979, 1996 10 East53'"St. 1970, 1975, 1982, 1993 6003'"Avenue 1970, 1977 1211 Ave.Americas 1970, 1978, 1999 825 8'"Avenue 1983, 1998750Lexington Ave. 1984, 1997 1177 Ave.Americas 1988, 1991 100Broadway 1968, 1981 37WallSt. 1904, 1956, 1968, 1984 90WestSt. 1905, 1981, 1984 115Broadway 1907, 1960, 1986, 1988, 1994, 1997, 1999 14WallSt. 1912, 1987, 1999 233 Broadway 1903, 1998 61 Broadway 1916,1973,1988,1997 25Broadway 1928, 1962 110WilliamSt. 1952, 1970, 1981 222Broadway 1968,1984,1988,1997 59Maiden Lane 1965,1981, 1999 140Broadway 1966, 1998 95WallSt 1968,1999 100WallSt. 1969,1997 100GoldSt. 1970,1983 100WilliamSt 1977,1999 40Broad St. 1987, 1998
Table
2:Base Equation
Usable Observations 81 Degrees ofFreedom 71 TotalObservations 86 Skipped/Missing 5
CenteredR**2 0.308698
RBar**2
0.221068UncenteredR**2 0.311463
TxR**2
25.228Mean
ofDependentVariable 0.0326646141StdErrorofDependentVariable0.518693711
6
StandardErrorof Estimate 0.4577840420
Durbin-Watson Statistic 1.616997
Variable Coeff Std Error T-Stat Signif 1. Dl 2.
D2
3.D3
4.D4
5.D5
6.D6
7.D7
8.D8
9.D9
10.DIG
-0.239671368 -0.177990872 0.415138235 -0.749460348 0.849830584 -0.270387407 -0.254682758 0.289917011 0.496816493 -0.751664458 0.887744850 0.620131228 0.528407052 0.610548281 0.553189217 0,250403102 0.197519310 0.155111093 0.178714342 0.183741205 -0.26998 -0.28702 0.78564 -1.22752 1.53624 -1.07981 -1.28941 1.86909 2.77995 -4.09089 0.78796053 0.77493200 0.43469188 0.22368150 0.12892457 0.28388195 0.20144141 0.06573457 0.00695438 0.00011198Table
3:Separate
Midtown
trendUsable Observations 81 Degrees ofFreedom 70
TotalObservations 86 Skipped/Missing 5
CenteredR**2 0.356249
RBar**2
0.264284UncenteredR**2 0.358823
TxR**2
29.065Mean
ofDependentVariable 0.0326646141Std ErrorofDependentVariable0.518693711
6
StandardErrorof Estimate 0.4449036891
Durbin-WatsonStatistic 1.720412
Variable Coeff Std Error T-Stat Signif 1. Dl 2.
D2
3.D3
4.D4
5.D5
6.D6
7.D7
8.D8
9.D9
10.DIO
11.MMID
-0.023833913 -0.266088265 0.797246294 -1.181635802 1.019181852 -0.425252459 -0.317602494 0.252726674 0.390248732 -0.774134415 0.009706928 0.867972776 0.603927035 0.540334296 0.623065561 0.542758608 0.252708125 0.193945907 0.151631495 0.179897872 0.178844615 0.004268882 -0.02746 -0.44060 1.47547 -1.89649 1.87778 -1.68278 -1.63758 1.66672 2.16928 -4.32853 2.27388 0.97817155 0.66086266 0.14457068 0.06202271 0.06457728 0.09687309 0.10599674 0.10003958 0.03345952 0.00004900 0.02604253Figure
2:Apartment
Rent
indices (constant$)II
nil nil
III
nil nil
III
nil nil
nil
III
II
Year