Practice-induced functional plasticity in inhibitory control interacts with
aging
Lea Hartmann
a, Laura Wachtl
a, Marzia de Lucia
b,1, Lucas Spierer
a,⁎,1aNeurology Unit, Medicine Section, Faculty of Sciences and Medicine, University of Fribourg, Fribourg, Switzerland
bLaboratoire de Recherche en Neuroimagerie (LREN), Department of Clinical Neurosciences, Lausanne University Hospital and University of Lausanne, Lausanne,
Switzerland A R T I C L E I N F O Keywords: Inhibitory control Plasticity Aging ERP Topography Source estimations A B S T R A C T
Inhibitory control deficits represent a key aspect of the cognitive declines associated with aging. Practicing inhibitory control has thus been advanced as a potential approach to compensate for age-induced neurocognitive impairments. Yet, the functional brain changes associated with practicing inhibitory control tasks in older adults and whether they differ from those observed in young populations remains unresolved.
We compared electrical neuroimaging analyses of ERPs recorded during a Go/NoGo practice session with a Group (Young; Older adults) by Session (Beginning; End of the practice) design to identify whether the practice of an inhibition task in older adults reinforces already implemented compensatory activity or reduce it by en-hancing the functioning of the brain networks primarily involved in the tasks.
We observed an equivalent small effect of practice on performance in the two age-groups. The topographic ERP analyses and source estimations revealed qualitatively different effects of the practice over the N2 and P3 ERP components, respectively driven by a decrease in supplementary motor area activity and an increase in left ventrolateral prefrontal activity in the older but not in the young adults with practice.
Our results thus indicate that inhibition task practice in older adults increases age-related divergences in the underlying functional processes.
1. Introduction
Deficits in inhibitory control (IC), the ability to suppress irrelevant motor or cognitive processes, constitute one of the major factors ac-counting for the cognitive declines observed in normal aging (e.g. Nielson, Langenecker, & Garavan, 2002). Cognitive training interven-tions targeting IC have thus been advanced as potential approaches to slow down the deleterious effects of aging on cognition. However, current functional literature on inhibitory control task practice focused mostly on young adults population (for a review, seeSpierer, Chavan, & Manuel, 2013), leaving largely unresolved whether and how aging in-teracts with training-induced plasticity in IC.
In young adults, behavioral improvements in IC are typically asso-ciated with decreases in right ventrolateral prefrontal activity (e.g. Berkman, Kahn, & Merchant, 2014; Chavan, Mouthon, Draganski, van der Zwaag, & Spierer, 2015; Hartmann, Sallard, & Spierer, 2016; Manuel, Grivel, Bernasconi, Murray, & Spierer, 2010; Spierer et al.,
2013), a pattern interpreted as reflecting an enhancement in the func-tioning of the core task areas via the exclusion of the task-irrelevant neural activity (e.g.Hartmann et al., 2016).
However, because of baseline differences in inhibitory control per-formance and in functional organization between young and older adults populations (e.g.Beason-Held, Kraut, & Resnick, 2008), different practice-induced plastic modifications can be hypothesized between these two age groups (Noack, Lovden, Schmiedek, & Lindenberger, 2009).
During inhibition tasks, older adults typically show longer response times (e.g.Heilbronner & Münte, 2013; Hong, Sun, Bengson, & Tong, 2014; Nielson et al., 2002; Vallesi, McIntosh, & Stuss, 2011) and more inhibition failures than young adults (e.g.Langenecker & Nielson, 2003; Nielson et al., 2002). Functionally, older adults show (i) local decreases in activity within the core inhibitory right VLPFC areas, putatively re-flecting less efficient processing with aging; and (ii) a recruitment of additional contralateral homotopic left VLPFC areas (Cabeza, 2002;
⁎Corresponding author at: Neurology Unit, Medicine Section, Faculty of Science and Medicine, University of Fribourg, PER 09, Chemin du Musée 5, 1700 Fribourg,
Switzerland.
E-mail address:[email protected](L. Spierer).
1Equal contribution.
http://doc.rero.ch
Published in "Brain and Cognition 132(): 22–32, 2019"
which should be cited to refer to this work.
Cappell, Gmeindl, & Reuter-Lorenz, 2010; Coxon et al., 2016; Hsieh & Fang, 2012) interpreted as compensating for the functional deficits in the areas primarily involved in the inhibition tasks (e.g.Reuter-Lorenz & Park, 2014; Sebastian et al., 2013).
Such baseline differences in neurocognitive states have been shown to influence both the type and amplitude of the plastic changes induced by practicing executive function tasks. For example, Dahlin, Neely, Larsson, Backman, and Nyberg (2008) found larger improvement in performance and striatal function after working memory training in young than older adults and interpreted this pattern as resulting from differences in baseline performance.Noack et al. (2009)further sug-gested that while in young adults training could improve the intrinsic neural capacities of task-related regions, neurobiological‘brakes’ in the older adults’ capacity to engage such plastic mechanisms may rather lead them to changes their cognitive strategies; in turn, qualitative modulations in the recruited networks would be observed with practice (Park & Bischof, 2013for discussion).
Based on the literature reviewed above, two main hypotheses can be formulated on how aging could interact with the effects of inhibitory control training.
First, practice of IC task in older adults may as in the young adults result in a functional enhancement of the brain areas primarily involved in the tasks. Consequently, compensatory activity would be less re-quired and thus reduced (Anguera et al., 2013; Heinzel et al., 2014). This hypothesis predicts that with task practice the older adults will show a decrease in both primary and compensatory inhibition-related activity (Brehmer et al., 2011; Erickson et al., 2007), i.e. bilaterally within the pre-SMA and ventrolateral cortices (Aron, 2007) during the inhibition initiation and implementation phases at ca. 200–400 ms post-stimulus onset (N2/P3 inhibition ERP components;Bokura, Yamaguchi, & Kobayashi, 2001; Pires, Leitão, Guerrini, & Simões, 2014).
Second, the practice may increase the compensatory activity adopted by the older adults to cope with inhibition demands, with the practice resulting in an increase in (mostly left) ventrolateral prefrontal cortices during the inhibition phases (e.g. Mozolic, Hayasaka, & Laurienti, 2010; Nyberg et al., 2003).
We tested these two models with electrical neuroimaging analyses of event-related potentials recorded during a practice session with the same inhibitory control task in a group of young adults (19–40 years old) and of older adults (60–76 years old). We focused on the interac-tion term of a multifactorial Group (Young; Older adults) × Session (Beginning; End) mixed ANOVA design applied on the NoGo trials, allowing us to reveal the plastic modifications specific to the older adults’ inhibition processes.
The electrical neuroimaging analyses of the ERPs consisted in ap-plying data-driven, time-frame-wise, robust randomization statistics on the globalfield power and on the topography of the ERPs. As compared to local analyses of the amplitude of ERP components at specific elec-trodes, analyses of the strength and shape of the scalpfield potentials enable deeper neurophysiological interpretations of the ERP by iden-tifying if the observed modulations follow from change in responses gain and/or change in the configuration of the active brain networks between conditions: differences in ERP topography indeed necessarily follow from changes in the configuration of the underlying neural generators (Lehmann, 1987), while differences in global field power follow from changes in the strength of the same brain generators (Michel & Murray, 2012; Murray, Brunet, & Michel, 2008; Tzovara, Murray, Michel, & De Lucia, 2012). As a second step, distributed source estimations were computed and statistically compared over the periods of global ERP modulations to localize the origin of the effects observed at the scalp.
In addition to the confirmatory analyses within the N2/P3 inhibi-tion-related time windows, we report the results of exploratory analyses over earlier ERP latencies. Previous IC training studies indeed suggest that earlier latency processes may likewise be modified by training: An automatization of the task completion may results in modifications of
the processing stages when stimulus-response mapping is implemented (i.e. in parietal areas at 100 ms;Manuel et al., 2010) and similarly, a change in task difficulty with practice could modify attention allocation and the processing of stimulus feature (N1 amplitude; Benikos, Johnstone, & Roodenrys, 2013).
2. Materials and methods
Except the addition of specific questionnaires assessing the integrity of basic cognitive functions in older adults to control potential con-founds related to healthy aging, we used in the older adults the same procedure and task as inHartmann et al. (2016), and the data for the young adult group used in the present paper are those fromHartmann et al. (2016). While the recording of the two groups were separated in time, the same experimenters conducted the study and the same devices were used for the data collection in each group.
2.1. Participants
Forty-one right-handed (Edinburgh Handedness Inventory;Oldfield, 1971) male volunteers were recruited for this study. Our sample size was calculated a priori based on previous ERP literature on inhibitory control training (e.g. Hartmann et al., 2016; Manuel, Bernasconi, & Spierer, 2013; Manuel et al., 2010; Paul et al., 2007) reporting medium to large effect size; for a power of 0.8 to detect effect of d = 0.8 or f = 0.3–0.4 for α = 0.5 with one-tailed independent-sample t-tests or a within-between subject interaction, a sample of n = 15–20 per group was necessary.
All the participants had normal or corrected to normal vision. None reported any history of neurological or psychiatric disorders. We con-trolled that all participants had a university degree to minimize be-tween-group differences in education level. We included only male participant to facilitate the comparison with previous studies on the topic and to prevent any sex-related confound. Older adults’ scores were within the limit of the norm for the Mini-Mental State Examination (M.M.S.E.;Folstein, Folstein, & McHugh, 1975), excluding any clinical signs of cognitive impairment (M.M.S.E. mean ± SD (max = 30) = 27.95 ± 0.78) and within the limit of the norm for the Frontal Assessment Battery (FAB;Dubois, Slachevsky, Litvan, & Pillon, 2000; mean ± SD (max = 18) = 17.68 ± 0.48 ), indicating no clini-cally relevant frontal impairments. Three participants were excluded from the analyses due to artifacted EEG recording (n = 1); improper calibration phase (n = 1; see the“Procedure and task” section); and part of the task performed with the left hand (n = 1). A total of 38 participants (mean age ± SD for the Young = 25.4 ± 4.8 years (range 19–40 years old); Older adults = 65.9 ± 4.8 years (60–76 years old)) were thus eventually included in the data analyses. All procedures were approved by our local ethics committee.
2.2. Stimuli
Visual stimuli were colored letter (blue, cyan, green, red, white or yellow‘A’, ‘E’, ‘M’, ‘O’, ‘S’ or ‘T’) presented in the center of a black screen. Each possible combination of the letter and color were used, for a total of 36 different stimuli. In a given block, NoGo stimuli were ei-ther all letters of a given color or all colors of a given letter (total 12 different NoGo stimuli); Go trials were all the remaining stimuli. For example, in a block where the letter“M” was the NoGo stimulus, a total of 30“M” were presented, 5 in each of the 6 possible colors (5 red “M”, 5 yellow “M”, 5 blue “M”, etc.) and the 30 Go stimuli were the 30 remaining color/letter combinations: 5“A” (one of each color), 5 “E”, 5 “O”, etc., so that in a block, the letter M was presented 5 times more than the other letters, while each colors were equally represented (Hartmann et al., 2016; De Pretto et al., 2017).
2.3. Procedure and task
Participants were seated in a sound-attenuated booth and completed a visual Go/NoGo task (Fig. 1). They were asked to respond as fast as possible to Go stimuli by pressing a button on a response box with their right indexfinger, while withholding their responses to NoGo stimuli. The E-Prime 2.0 software (Psychology Software Tools, Inc., Sharpsburg, PA) was used for stimulus presentation and response recording. A total of 12 blocks of 60 trials were completed by each participant, separated by 2 min breaks. Each block consisted of 30 Go and 30 NoGo trials presented randomly. The NoGo stimuli (i.e., a given letter or color) were pseudorandomly chosen across participants so that the same NoGo was never used two times and the order of the NoGo used in each block was different for each participant.
Before the beginning of each block, participants were presented with spoken and written instructions on which was the NoGo stimulus for that block. Participants then completed a calibration block of 12 trials (6 Go; 6 NoGo) during which the mean response time (RT) to Go trials was measured. This averaged RT (RT threshold, RTt) was then used as a threshold to provide a feedback on response speed during the subsequent experimental block: if the RT to a Go trial was below 90% of the mean RTt, a feedback‘Too late!’ was presented on the screen at the end of the trial (no feedback was given on performance during the calibration phase and participants were kept naive to the aim of the calibration phase). This procedure enabled maintaining the same level of time pressure across participants and blocks, i.e., independently of any initial inter-individual differences in Go/NoGo performance and on performance improvement with practice (for similar procedures: Manuel et al., 2010; Vocat, Pourtois, & Vuilleumier, 2008). Such pressure on response time was also necessary to increase response prepotency in our task because to control for biases related to a dif-ferential exposure to Go and NoGo trial during the practice we had to present the same number of Go and NoGo trials. The feedback on re-sponse time thus enabled increasing the tendency to respond when a stimulus was presented and thus the need for inhibition to NoGo trials. Our result for 10–15% rate of commission error as in typical Go/NoGo tasks with 0.3 NoGo probability, together with the presence of clear N2 and P3 component (seeSection 3), confirmed that our paradigm ade-quately involved inhibition.
Each experimental trial consisted in the presentation of a grey fixation cross during 1500–1900 ms, followed by the stimulus (500 ms) and a response window (1000 ms) terminating as soon as the partici-pant responded, but with a minimal duration of 250 ms. Then, a feed-back on the performance was given for 500 ms: a happy smiley icon after hits (response after a Go stimulus); a feedback“Too late!” replaced the happy smiley after hits with a RT > RTt; a happy smiley after correct rejections (no response after a NoGo stimulus); and an unhappy smiley after misses (no response after a Go stimulus) or false alarms (response after a NoGo trial).
2.4. Behavioral analysis
Response times (RT) to Go stimuli and accuracy to NoGo stimuli (as indexed by the false alarm rate (FA): the percentage of inaccurately responded NoGo trials) were recorded in the young and older groups. Response times were averaged for each block separately after having excluded RT higher or lower than two standard deviations from the individual’s mean. In order to enable comparisons between the beha-vioral and EEG results, RT and FA rate were averaged for the threefirst blocks (condition “beginning”, BEG) and the three last blocks of the session separately (condition “end”, END). The RT and FA were sta-tistically compared based on a Group (Young; Older) × Session (BEG; END) mixed ANOVA. Kolmogorov-Smirnov tests revealed that the as-sumption of normality was violated for two variables (FA Older BEG; FA Older END), and Levene’s test for homogeneity of variance that the error variance of the dependent variables was unequal between the young and the older adults group for the response times (RT) and the false alarms (FA). To control for the influence of these assumption violations on the parametric ANOVA and for potentially skewed dis-tribution of percentages and response time, we reconducted the same Group × Session analyses but with non-parametric statistics and found that the results did not change (see the Supplementary Table 1 & 2 for the test of parametric ANOVA’s assumptions and the p-value of the non-parametric statistics). We thus report in the results section the para-metric statistics. Effect sizes are interpreted according to the Cohen’s (1988) guidelines (d (ηp2) = 0.2 (0.01): small; 0.5 (0.06): medium; and
0.8 (0.14): large effect size). 2.5. EEG recording
The 64-channel electroencephalogram (EEG) was recorded at a sampling rate of 1024 Hz with a Biosemi ActiveTwo system referenced to the common mode sense-driven right leg (CMS-DRL) ground placed on each side of the POz electrode. This circuitry consists of a feedback loop driving the average potential across the montage as close as pos-sible to the amplifier zero (cf. the Biosemi website (http://www. biosemi.com/pics/zero_ref1_big.gif for a diagram). For the ERP ana-lyses, offline analyses were performed with the Cartool software (Brunet, Murray, & Michel, 2011), and statistical analyses were per-formed with the open toolboxes RAGU (Koenig, Kottlow, Stein, & Melie-García, 2011) and STEN (http://doi.org/10.5281/zenodo.1164038).
2.6. EEG preprocessing
Second order Butterworth with−12 db/octave roll-off; 0.1 Hz high-pass; 40 Hz low-high-pass; 50 Hz notchfilters were applied on the raw EEG data. Then, we extracted and averaged EEG epochs from 100 ms pre- to 500 ms post-stimulus onset, for the correct Go (Hit) and NoGo stimuli (Correct Rejections, CR), for thefirst three blocks (Beginning condition, BEG) and the three last blocks of the Go/NoGo practice session (End
Fig. 1. Experimental visual Go/NoGo paradigm. Participants had to respond as fast as possible to the Go stimuli while withholding their response to the NoGo stimuli. A feedback was displayed on response speed and accuracy.
condition, END) for each participant. Before the event-related potential (ERP) averaging, epochs with at least one electrode with one time frame at ± 80 μV were automatically rejected to remove eye blinks and other artifacts. After the ERP averaging, data from‘bad’ electrodes from each participant were interpolated using 3D splines before the averaging (mean 0.3% interpolated electrodes;Perrin, Pernier, Bertnard, Giard, & Echallier, 1987), and the ERPs recalculated against the average re-ference and corrected for pre-stimulus baseline. The average number ( ± standard deviation (SD)) of accepted epochs was for the condition (Young Group CR BEG: 68.5 ± 12.5, CR END: 72.0 ± 7.9; Older Group CR BEG: 74.2 ± 11.4, CR END: 74.7 ± 9.0; Young Group HIT BEG: 66.2 ± 13.0, HIT END: 68.9 ± 7.4; Older Group HIT BEG: 70.0 ± 12.6, HIT END: 71.1 ± 10.1). These values did not differ statistically on our main Group (Young; Older) × Session (Beg; End) interaction term of interest (CR: p = .453; HIT: p = .710), ensuring that the observed ERP effects were not confounded by differences in signal-to-noise ratio.
2.7. Event-related potential analyses
2.7.1. General event-related potentials (ERPs) analytical strategy We conducted electrophysiological analyses both on local and global measures of the electricfield at the scalp. Local electrode ana-lyses refer to the comparison between the experimental conditions at the level of the ERP waveform for each electrode separately. In contrast, global analyses of the ERPs compare the power and topography of the whole electricfield at the scalp between conditions. Global analyses of the scalpfield potentials have the advantage of being independent on the choice of the reference electrode and, as detailed below, of enabling to differentiate effects following from modulations in the strength of the responses of statistically indistinguishable brain generators (i.e. mod-ulations in globalfield power but not topography) from alterations in the configuration of these generators (i.e. modulations of the topo-graphy of the electric field at the scalp). These methods have been shown to be useful for analyzing EEG data from large electrode sensor arrays and have been extensively detailed elsewhere (Michel & Murray, 2012; Tzovara et al., 2012for a method tutorial).
The key ERP analyses were conducted on the NoGo ERP because the main aim of the study was to identify how practice modified the in-hibition processes in the young vs the older adults. This question was addressed by the interaction term of a Group (Young; Older) × Session (Beginning (BEG); End of the practice (END)) mixed repeated measure ANOVA on the NoGo ERPs. Yet, we still compared the Go and NoGo ERP as a‘sanity check’ to ensure that the key inhibition ERP compo-nents were present in our data and to identify the periods of interest for the NoGo analyses (Section 2.7.5). We focused on the time period of the N2 and P3 ERP components for our main confirmatory analyses because our hypotheses for an interaction between aging and the effect of IC practice concerned the inhibition processing phases (e.g.Albert, López-Martín, Hinojosa, & Carretié, 2013; Gajewski & Falkenstein, 2013). However, we still conducted and report exploratory analyses of the remaining period of the ERP epoch, during which other effects could not be excluded.
2.7.2. Local electrode ERP analyses
As afirst step, we conducted local electrode analyses by applying the (Young; Older) × Session (Beginning (BEG); End of the practice (END) mixed ANOVA at each peri-stimulus time frame and for each electrode separately. This analysis of the ERP voltage waveform data at the single electrode level aims at identifying the time periods showing the modulation of interest (here the Group*Session interaction). Such local electrode analysis actually corresponds to the canonical ERP analysis approaches comparing voltage amplitudes for specific ERP components of interest (i.e. the ERP voltage at a given electrode and latency), but extended in time to the whole ERP epoch and space to the whole electrode montage. This analysis is important because it allows
comparing our results to those of previous studies based on traditional ERP analyses. For example, our approach could reveal an effect on the classical N2 component by showing an interaction on the typical elec-trodes and latency of the N2: Frontocentral/anterior elecelec-trodes between 250 and 350 ms.
Yet, while this approach is highly sensitive to detect the timing of ERP modulations, it entails a large number of statistical tests and is thus prone to false positive. To (partially) correct for multiple comparisons and for temporal and spatial autocorrelation, we considered in this analysis only the periods showing the interaction of interest lasting longer than 11TF on more than 10% of the electrodes. This threshold is based on a permutation tests assessing the number of continuous sig-nificant data points that would be expected to arise by chance (based on 1000 permutations) in temporally auto-correlated noise data (Guthrie & Buchwald, 1991).
2.7.3. Global ERP analyses
Modulations of the strength of the electricfield at the scalp were analyzed using the globalfield power index (GFP;Koenig et al., 2011; Koenig & Melie-García, 2010; Lehmann & Skrandies, 1980). GFP is calculated as the spatial standard deviation of the electricfield (i.e., the root mean square of the difference between two normalized vectors computed across the entire electrode set). Larger GFP amplitudes in-dicate stronger electric fields; GFP peaks thus indicate highly syn-chronized neural sources underlying the scalp-recorded activity (Michel & Murray, 2012).
Modulations of the topography of the electricfield at the scalp were analyzed using the global map dissimilarity index (GMD;Lehmann & Skrandies, 1980). GMD indexes differences in the configuration be-tween two electricfield and is calculated as the root mean square of the difference between the potentials measured at each electrode for the different experimental conditions normalized by instantaneous GFP. Because changes in topography forcibly follow from changes in the configuration of the underlying active sources (Lehmann & Skrandies, 1980), topographic modulations reveal when distinct brain networks are activated across experimental conditions.
Since the GFP is insensitive to spatial (i.e. topographic) change in the ERP, and that GMD is calculated on GFP-normalized data, the GFP and GMD are orthogonal measures and can thus be interpreted sepa-rately.
GFP and GMD were compared across experimental conditions at each time frame using non-parametric randomization statistics (Monte Carlo bootstrapping): the differences in GFP and GMD between the experimental conditions were compared with a distribution of the dif-ferences derived from permuting 5000 times the conditions’ label of the data for each participant (Koenig et al., 2011; Murray et al., 2008). The probability of obtaining a GMD and GFP value from the permutations higher than the measured value was then determined. The threshold for statistical significance was set at p < 0.05, and to correct for multiple comparison and temporal autocorrelation, differences were only ac-cepted as significant if they were present for > 11 continuous time-frames (Guthrie & Buchwald, 1991).
The ERP analyses were used to identify the periods of interest showing sustained Group × Session interactions over which the ana-lyses of source estimations were conducted to identify the origin of these modulations in the brain.
2.7.4. Electrical source estimations
Brain sources of ERP modulations were estimated using a dis-tributed linear inverse solution model (a minimum norm inverse solu-tion) combined with the local autoregressive average (LAURA) reg-ularization approach, which describes the spatial gradient across neighboring solution points (Grave De Peralta Menendez, Murray, Michel, Martuzzi, & Gonzalez Andino, 2004; Menendez, Andino, Lantz, Michel, & Landis, 2001). LAURA enables investigating multiple si-multaneously active sources and selects the configuration of active
brain networks that better mimics biophysical behavior of neuralfields. LAURA uses a realistic head model, and the solution space included 3005 nodes, selected from a grid equally distributed within the gray matter of the Montreal Neurological Institute's average brain. The head model and leadfield matrix were generated with the Spherical Model with Anatomical Constraints (SMAC;Spinelli, Gonzalez Andino, Lantz, Seeck, & Michel, 2000). As an output, LAURA provides current density measures; their scalar values were evaluated at each node. Assessments of the localization accuracy of this inverse solution by fundamental and clinical research indicate that the estimations and the results of their statistical analyses can be confidently interpreted at the resolution of the grid size (here 6 mm; e.g.Gonzalez Andino, Michel, Thut, Landis, & Grave de Peralta Menendez, 2005; Gonzalez Andino, Murray, Foxe, & Grave de Peralta Menendez, 2005; Grave de Peralta Menendez, Gonzalez Andino, Lantz, & Michel, Landis; Michel et al., 2004).
The ERP were averaged for the period of interest determined by the ERP analyses, their source calculated and then submitted to the same 2 × 2 ANOVA with between-subject factor Group (Young; Older) and within-subject factor Session (BEG; END) as the ERPs. To correct for multiple testing and spatial autocorrelation, we applied a spatial-extent correction (Ke) of≥15 contiguous nodes with a p-value < 0.01. This spatial criterion was determined using the AlphaSim program (avail-able athttp://afni.nimh.nih.gov) and assuming a spatial smoothing of 6 mm FWHM. This program applies a cluster randomization approach. The 10,000 Monte Carlo permutations performed on our lead field matrix revealed a false positive probability of < 0.005 for a cluster greater than 15 nodes.
2.7.5. Identification of the periods of interest for the confirmatory electrical neuroimaging analyses
The periods of the N2 and P3 were determined by the analysis of the Go and NoGo ERP in the Older and Young groups with a cluster-based temporal segmentation approach (supplementary Fig. 1), which was also used to confirm that our task induced the typical inhibitory ERP components. To identify the periods of the N2 and P3 inhibition-related ERP components, we submitted the group-averaged ERP data of the young and the older adults to hierarchical clustering based on an ato-mize and agglomerate analysis (Brunet et al., 2011; Murray et al., 2008). This approach is based on evidence that the ERP map topo-graphy does not vary randomly across time, but remains quasi-stable over 20–100 ms functional microstates – i.e. the ERP components- be-fore rapidly switching to other stable periods (Cacioppo, Weiss, Runesha, & Cacioppo, 2014; Lehmann & Skrandies, 1980; Pascual-Marqui, Michel, & Lehmann, 1995). As in previous literature with the same analysis (e.g. Fargier & Laganaro, 2016; Laganaro, Valente, & Perret, 2012; Maitre et al., 2017), the optimal number of clusters that explained the best the grand-average data sets across conditions was identified using a modified version of the cross-validation criterion combining a cross-validation criterion and the Krzanovski-Lai criterion (Tibshirani & Walther, 2005; see alsoMurray et al., 2008). This analysis enabled identifying the N2 and P3 ERP component in our data in a data-driven manner; itfirst confirmed the presence of a N2 and P3 compo-nents typically observed in visual Go/NoGo task (with negative fronto-central topography ca. 250–350 ms and a positive central topography 350–500 ms, respectively, cf e.g.Falkenstein, Hoormann, & Hohnsbein, 1999).
3. Results
3.1. Behavior
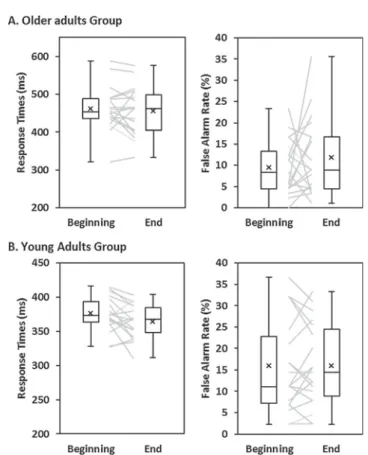
There was a main effect of Group for the RT, driven by longer re-sponse times (RT) in the older than young adults group (F1,36= 38.95;
p < 0.01;ηp2= 0.520). There was no main effect of Group for the false
alarm (FA) rate (F1,36= 4.05; p = .052;ηp2= 0.101; seeTable 1and
Fig. 2).
There was no main effect of Session on RT (RT Practice Main Effect, F1,36= 3.284; p = .078; ηp2= 0.084), nor on FA (F1,36= 0.770;
p = .386;ηp2= 0.021).
There was no interaction between Group and the Session for the RT (RT Interaction Effect, F1,36= 0.307; p = .583;ηp2= 0.008), nor for
the FA (F1,36= 0.627; p = 434;ηp2= 0.017).
Given the limitation of the frequentist approach to provide support for the null hypothesis, we further investigated the Group by Session interaction with a Bayes factors (BF) analysis using the free software JASP (JASP Team, 2018, https://jasp-stats.org/), with the default priors (r scale fixed effects = 0.5; and r scale random effects = 1). Bayes factors express the probability of the data given H0 relative to H1 (Dienes, 2011)). We assessed whether the data supported an absence of interaction by comparing the BF10 of the model with the interaction against the BF10 of the model with only the two main effects. This analysis revealed BF10 of 0.36 for the RT interaction and 0.41 for the FA (Table 1), indicating substantial evidence against the interaction (the data were ca. 3 times more likely observed under the null hy-pothesis).
3.2. Event-related potentials and source estimations
We report in Supplementary Fig. 1the results of the comparison between the Hit and CR condition for the Young and Older groups. These results were used to identify the period of interest (i.e. of typical inhibition process) for the time-frame wise analyses. Importantly, these findings replicate the typical N2 and P3 components and effects found in Go/NoGo task. Together with the behavioral result for ca 10% FA and 400 ms RT, these data confirm that our experimental paradigm adequately measured inhibition processes and generated data inter-pretable in the context of previous literature on inhibitory control.
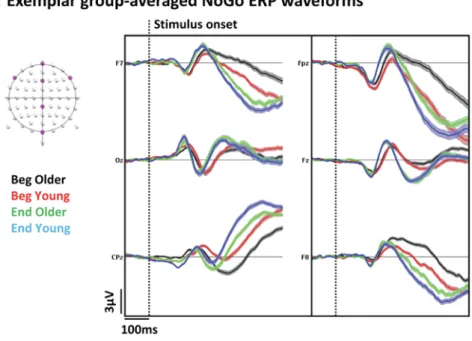
Confirmatory analyses (i.e. during the N2/P3 components, from 250 ms to 500 ms) revealed a sustained p < 0.05, > 11 time frame; > 10% of the electrodes) Group × Session interaction from during the N2 component at 299–322 ms and the P3 component at 333–401 ms (Fig. 3). These modulations followed from modulation in ERP topographic but not strength, indicating changes in the con fig-uration but not response strength of the underlying brain network (Lehmann & Skrandies, 1980; Tzovara et al., 2012).
Statistical analyses of source estimations over this period revealed that this ERP modulation stemmed from a Group × Session interaction (p < 0.01, Ke > 15) driven by a decrease of a SMA-preSMA network and an increase in the left VLPFC activity in response to NoGo stimuli in the Older but not Young group (Fig. 4).
Although our confirmatory analyses focused on the periods of the N2/P3 ERP components, we conducted exploratory analyses of the whole ERP epoch. These analyses revealed a sustained (Group × Session interaction from 139 to 182 ms (Fig. 3). We alsofind a topographic but not a Global Field Power (GFP) ERP modulation over this time period, indicating that the observed ERP interaction resulted from qualitative change in the underlying brain activity
These modulations were respectively within a left ventrolateral prefrontal area centered on inferior frontal cortex. Follow-up t-tests indicate that this interaction was mainly driven by a decrease in re-sponse to NoGo stimuli in the Young group but not Older group within this region with practice (Fig. 4).
Finally our analyses of the baseline difference between the two groups ERP to the NoGo revealed a topographic modulation over the N2 time window and of response strength during the P3 components, re-spectively driven by lower engagement of a right parieto-occipital network and a higher activity of the pre-SMA and right inferior frontal gyrus in the Older than Young group, and by a larger activity of the left posterior prefrontal, bilateral occipital and right parietal area in the Young than the Older (Supplementary Fig. 2).
4. Discussion
We examined how aging interacted with practice-induced changes in inhibitory control (IC), and tested two models on the effect of practice on compensatory functional activity (i.e. whether it would reduce or develop compensatory activity in the older adults). The Go/ NoGo practice had weak positive effects on performance, and Bayesian inferential analyses indicated that these effects were identical across age groups. In contrast, electrical neuroimaging analyses of the ERP revealed robust differences in the effect of practice between the young and older adults: there was topographic but not global field power Group by Session interactions over the periods of the N2 (ca. 300 ms post NoGo onset) and P3 ERP components (450 ms); the practice of the inhibitory control task thus resulted in qualitatively (but not quantita-tively) different functional effects in the young and older adults. Source estimation analyses indicated that these ERP effects were respectively driven by a decrease in the activity of the bilateral (pre) supplementary motor areas and an increase in left ventrolateral prefrontal activity in
the older adults but not young, suggesting differential changes in brain activity between the two age groups at the level of both the preparation and implementation of inhibition processes.
4.1. Go/NoGo inhibition practice has small and equivalent behavioral effect in both age groups
Behaviorally, we replicated previous evidence for slower response times during the inhibitory control task in older than young adults, associated with a tendency for less false alarm rate (Godefroy, Roussel, Despretz, Quaglino, & Boucart, 2010; Woods, Wyma, Yund, Herron, & Reed, 2015). This pattern could be accounted for either by a general slowing or sensori-motor processing incidentally resulting in less com-mission error (e.g.Forstmann et al., 2011; Woods et al., 2015) or by a deliberate choice for more cautious response strategy to favor accuracy over speed in older adults (Kopp, Lange, Howe, & Wessel, 2014; Starns & Ratcliff, 2010). While our data cannot disentangle between these hypotheses, in our task a strong emphasis was put on response speed based on the individually and dynamically adjusted feedback on re-sponse time; hence, it appears unlikely that the participants in-tentionally decreased their response speed.
Regarding the effect of practice on behavioral performance, Bayesian evidence for an absence of Group by Session interaction in-dicate that the 40 min practice session resulted in the same effect be-tween our two age groups, and the main effect of Session suggests a small improvement in response speed with stable FA rate when both groups were considered together. This pattern is typically observed in IC practice studies (e.g. Chavan et al., 2015; Manuel et al., 2013; Benikos et al., 2013) and interpreted as reflecting faster inhibition processes: if the speed of execution processes improves without re-sulting in more false alarms, it means that the speed of the‘intercepting’ inhibition processes also improved. Yet, there was almost no change at the behavioral level in the older adults, afinding that provides limited support to previous claim that inhibitory control training might be beneficial for older adults (Kühn et al., 2017). The present study however focused on a short practice session, and while such practice durations reliably improve performance in young adults (Benikos et al., 2013; Hartmann et al., 2016; Manuel et al., 2013; Spierer et al., 2013), and has been shown to constitute a good model for longer training intervention because it results in corresponding effects (e.g. Allom, Mullan, & Hagger, 2016), longer practice time may still be needed in older populations to improve performance. However, as suggested by the functional results and by previous studies on IC training (e.g. Beauchamp, Kahn, & Berkman, 2016), task practice can modify how participants perform a task without this change manifesting behavio-rally. Further studies with longer practice time are required to de-termine if IC practice with Go/NoGo task results in measurable beha-vioral changes.
Table 1
Scores and statistical analyses of the behavioral performance at the beginning and the end of the Go/NoGo task practice for the two groups of participants.
Older Young Group × Session
Mean ± SD Beginning End Beginning End Group
Main Effect Session Main Effect Group × Session Interaction Go RT (ms) 461.76 ± 58.44 455.38 ± 63.39 375.75 ± 25.20 363.74 ± 24.62 p = .000 ηp2= 0.520 p = .078 ηp2= 0.084 p = .583 ηp2= 0.008 BF10= 0.36 NoGo FA (%) 9.50 ± 6.38 11.78 ± 9.07 15.91 ± 10.91 16.02 ± 9.74 p = .052 ηp2= 0.101 p = .386 ηp2= 0.021 p = .434 ηp2= 0.017 BF10= 0.41
Fig. 2. Behavioral performance during the Go/NoGo task. Older (A) and Young (B) response times and false alarms rate at the beginning and at the end of the Go/NoGo practice. Individual datapoints, means (cross), medians (horizontal bar) and minimal-maximal value (whiskers) are represented.
Fig. 3. Electrical neuroimaging analyses in the sensor space of the interaction between the factors Group (Older; Young) and Session (Beginning; End of the practice). (A) Exemplar group-average event-related potentials (ERPs) for NoGo trials at the beginning and at the end of the practice for both group. (B) Electrode-wise statistical analyses of the ERPs. The graph (1) represents the percen-tage of electrodes showing a significant (p < 0.05) Group × Session interaction. Three periods showed a sustained (> 10 ms for > 10% of the electrodes) interaction. The results of the global map dissimilarity (2) and of the globalfield power (3) interaction revealed topographic but not strength ERP modulations over the 139–182 ms, 299–401 ms and 421–500 ms time periods. In the topographic maps, red dots re-present the electrode sites showing a significant interaction (nasion upward; Old: Older; You; Young)
4.2. Inhibitory control practice influences inhibition preparatory processes in older but not young adults
We found a Group × Session topographic but not globalfield power interaction during the period of the N2 ERP component at 300 ms. Because topographic modulations necessarily follow from a change in the configuration of the underlying intracranial generators (Michel & Murray, 2012), this result first indicates that the inhibitory control practice induced qualitatively (and not merely quantitatively) different changes in the functional IC organization between the older and the young adults. The statistical analyses of source estimations revealed that these modulations stemmed from a decrease in the engagement of the bilateral supplementary motor area (SMA) and preSMA in the older adults, with a smaller change in the opposite direction young adults. We interpret this modulation as reflecting the engagement of fewer re-sources in the preparation and triggering of inhibition in the older adults. The N2 ERP component has indeed been repeatedly associated with response conflict processing (Donkers & van Boxtel, 2004; Enriquez-Geppert, Konrad, Pantev, & Huster, 2010; Gajewski & Falkenstein, 2013; Nieuwenhuis, Yeung, van den Wildenberg, & Ridderinkhof, 2003; Schmajuk, Liotti, Busse, & Woldorff, 2006) and the initiation of inhibition processes (Millner, Jaroszewski, Chamarthi, & Pizzagalli, 2012). Importantly, the N2 has also been advanced to reflect preparatory processes occurring before response inhibition or execu-tion, such as stimulus-driven attenexecu-tion, detection of response conflict or evaluation of the outcome of inhibition (Albert et al., 2013).
Consistently, the preSMA and SMA have been respectively involved in motor inhibition, as well as in movement planning and preparation. Impaired inhibition has indeed been observed after real (Floden &
Stuss, 2006; Picton & Taylor, 2007) or virtual preSMA lesion (Chen, Muggleton, Tzeng, Hung, & Juan, 2009), and activity in the preSMA reported during inhibition processes (Chen et al., 2009; Floden & Stuss, 2006; Mostofsky et al., 2003; Ray Li, Huang, Constable, & Sinha, 2006; Rubia et al., 2001; Simmonds, Pekar, & Mostofsky, 2008; Swick, Ashley, & Turken, 2011; Xue, Aron, & Poldrack, 2008). Importantly, preSMA activity is a determinant of inhibition performance, with evidence for greater preSMA activity in participants with efficient vs slower inhibi-tion (Ray Li et al., 2006). In contrast, the SMA proper is rather involved in motor execution (Nachev, Kennard, & Husain, 2008; Picard & Strick, 2001; Zhang, Ide, & Li, 2012). Our source estimation approach does not have the spatial resolution to differentiate between the functional patterns in these two adjacent regions, but indicates a globally lower engagement of these motor control functional units in the older adults at the end of the practice. Thisfinding is in line with previous evidence for larger preSMA activity in older adults during conflict processing and inhibitory control (Turner & Spreng, 2012for meta-analysis), and the reduction of activity in this region suggests that the practice resulted in a reduction of the compensatory activity related to conflict monitoring and a better coping with task demands (e.g. Anguera et al., 2013; Heinzel et al., 2014).
4.3. With practice, older but not young adults recruit additional left ventrolateral prefrontal cortices to support motor inhibition
During the period of the P3 ERP component, we also found a to-pographic (but not strength) ERP modulation driven by an increase in the left VLPFC responses in the older but not young population.
The P3 ERP component has been typically associated with the
Fig. 4. Electrical Neuroimaging analyses in the source space: Statistical analysis of the distributed electrical source estimations over the three periods of interest defined in the analyses in the sensor space. The bar graphs depict the mean current densities in the clusters showing the interaction for the four conditions. Beg: Beginning; Old: Older; You; Young; lIFG: Left inferior frontal gyrus; SMA: Supplementary motor area; lVPLFC: Left ventrolateral prefrontal cortex; *: < 0.05; **: < 0.01.
implementation of the motor inhibition processes (Albert et al., 2013; Gajewski & Falkenstein, 2013; Smith, Johnstone, & Barry, 2008). During this processing phase, there was an increase in left prefrontal activity in the older but not the young participants. Larger activity in this area during inhibition tasks has been repeatedly reported when comparing older to young populations (Colcombe, Kramer, Erickson, & Scalf, 2005; Langenecker & Nielson, 2003; Nielson et al., 2002; see Cabeza, 2002, for a review), and interpreted as a mechanism to com-pensate for the deficits of the right homotopic IFG area primarily in-volved in the task (Park & Reuter-Lorenz, 2009). Accordingly, our re-sults suggest that the practice further developed this coping strategy in the older group. Similar patterns have been observed following the training of other executive functions in older adults; Carlson et al. (2009) for instance demonstrated training-induced increases in the activity of prefrontal regions in older adults with high risk of cognitive impairments. A study on the effects of eight weeks of cognitive training program also reported increases in resting bloodflow in healthy older adults (Mozolic et al., 2010).
Ourfinding however runs counter previous evidence for a decrease in neurocognitive scaffolding with performance improvements (e.g. Nielson et al., 2002; Langenecker & Nielson, 2003). This discrepancy might follow from the fact that our older adult group did not show a larger engagement of the left PFC at baseline; the absence of an initial engagement of compensatory activity in the area showing the interac-tion may explain why we observed an increase and not a decrease in practice-induced functional scaffolding. Our older participants were possibly too young to already engage important functional compensa-tion of age-related neural deterioracompensa-tion. Alternatively, because of their low temporal resolution, the imaging methods used in previous in-vestigations might have missed the changes during short-lived proces-sing steps in the multiphase inhibition process we have observed here.
4.4. Exploratory analyses of ERP modulation during the pre-inhibition processing phases suggest a decrease in older adults’ proactive inhibition with practice
While our hypotheses focused on the typical inhibition-related periods of inhibition corresponding to the N2/P3 ERP components, we conducted exploratory analyses on the rest of the peri-stimulus EEG epoch. These analyses revealed a topographic ERP modulation at 150 ms post-stimulus onset resulting from a differential engagement of the left IFG. We interpret this effect as reflecting a differential change in proactive inhibition between groups with practice. This latency indeed corresponds to a processing stage overlapping with the phase of re-trieval of stimulus-response mapping rules and decision on the response to the stimuli, but preceding the proper implementation of the inhibi-tion command. Current models of the funcinhibi-tional architecture of in-hibitory control suggest that after the perceptual discrimination of the Go and NoGo stimuli within sensory and associative cortices around 50–150 ms post-stimulus onset, whether inhibition must be engaged is determined based on the retrieval of stimulus-response mapping rules in memory at ca. 150–250 ms (Manuel et al., 2010; Watanabe et al., 2002). Then, at 250–300 ms, when stop stimuli are identified and ac-tion cancellaac-tion decided, response inhibiac-tion is initiated within right inferior frontal a gyrus (rIFG) to eventually stop motor activity via projections to the basal ganglia and thalamus (Chambers, Garavan, & Bellgrove, 2009; Hampshire, Chamberlain, Monti, Duncan, & Owen, 2010; Zhang, Geng, & Lee, 2017). The activity at 150 ms thus entails preparatory processes engaged as soon as a task-relevant stimulus was discriminated, before the decision to actually engage inhibition pro-cesses (Criaud & Boulinguez, 2013).
Together with the behavioral results suggesting more cautious re-sponse strategy in older adults, the timing, location and direction of this modulation suggests that with practice the young tended to rely less on proactive inhibitory control, most likely because of an improvement in their capacity for reactive inhibition (Jaffard, Benraiss, Longcamp,
Velay, & Boulinguez, 2007; Jaffard et al., 2008). In contrast, the older adults showed no change in activity in this area. In older adults, the left IFG has been repeatedly reported as being recruited to compensate for deficits in the core rIFG inhibitory area (Langenecker & Nielson, 2003; Nielson et al., 2002). While our data suggest that the practice in flu-enced differently the Young and the Older during this processing phase, the exploratory nature of this result requires further confirmation. 4.5. Limitations
As mentioned above, the main limitation of our study was the short duration of the practice session; we cannot rule out that longer practice would lead to different effects. However, a recent review on behavioral effect of inhibitory control training byAllom et al. (2016)indicates that there is no direct evidence available at the time that longer practice sessions are more beneficial. Moreover, the functional literature in-dicates that short (e.g.Hartmann et al., 2016; Manuel et al., 2013) and long practice regimen (Berkman et al., 2014; Chavan et al., 2015) result in comparable effects.
4.6. Conclusions
Our collective results suggest that the practice of inhibitory control tasks induces qualitatively different neurophysiological effects in young and older adults. Aging thus interacts with the mechanisms of practice-induced inhibitory control functional plasticity, which emphasizes the state-dependency of the functional effect of cognitive practice and suggests that a normalization of age-related executive deficits with practice could unlikely be achieved. Remediation strategies may rather focus on reinforcing the compensatory neurocognitive strategies man-ifesting spontaneously with aging.
Acknowledgments
This work was supported by a grant from the Swiss National Science Foundation (Grants #32003B_156854, #316030_144998 and #320030_175469 to LS and EUREKA-Eurostars, Grant Number E!373 9361 Com-Alert to MDL). We thank Dr Michael Mouthon and Dr Michael De Pretto for their help with the EEG analyses. The Cartool software (brainmapping.unige.ch/cartool) has been programmed by Denis Brunet, from the Functional Brain Mapping Laboratory, Geneva, Switzerland, and is supported by the Center for Biomedical Imaging (CIBM) of Geneva and Lausanne. The STEN toolbox (http://doi.org/10. 5281/zenodo.1164038) has been programmed by Jean-François Knebel and Michael Notter, from the Laboratory for Investigative Neurophysiology (the LINE), Lausanne, Switzerland, and is supported by the Center for Biomedical Imaging (CIBM) of Geneva and Lausanne and by National Center of Competence in Research project“SYNAPSY – The Synaptic Bases of Mental Disease”; project no. 51AU40_125759. Conflict of interest
The authors have no competing interests to declare.
Appendix A. Supplementary material
Supplementary data to this article can be found online athttps:// doi.org/10.1016/j.bandc.2019.02.004.
References
Albert, J., López-Martín, S., Hinojosa, J. A., & Carretié, L. (2013). Spatiotemporal
char-acterization of response inhibition. Neuroimage, 76, 272–281.https://doi.org/10.
1016/j.neuroimage.2013.03.011.
Allom, V., Mullan, B., & Hagger, M. (2016). Does inhibitory control practice improve
health behaviour? A meta-analysis. Health Psychology Review, 10, 168–186.https://
doi.org/10.1080/17437199.2015.1051078.
Anguera, J.a., Boccanfuso, J., Rintoul, J. L., Al-Hashimi, O., Faraji, F., Janowich, J., ... Gazzaley, A. (2013). Video game practice enhances cognitive control in older adults.
Nature, 501, 97–101.https://doi.org/10.1038/nature12486.
Aron, A. R. (2007). The neural basis of inhibition in cognitive control. Neuroscientist, 13,
214–228.https://doi.org/10.1177/1073858407299288.
Beason-Held, L. L., Kraut, M. A., & Resnick, S. M. (2008). Longitudinal changes in aging
brain function. Neurobiology of Aging, 29, 483–496.https://doi.org/10.1016/j.
neurobiolaging.2006.10.031.
Beauchamp, K. G., Kahn, L. E., & Berkman, E. T. (2016). Does inhibitory control practice transfer?: Behavioral and neural effects on an untrained emotion regulation task.
Social Cognitive and Affective Neuroscience, 11, 1374–1382.https://doi.org/10.1093/
scan/nsw061.
Benikos, N., Johnstone, S. J., & Roodenrys, S. J. (2013). Short-term practice in the Go/ Nogo task: Behavioural and neural changes depend on task demands. International
Journal of Psychophysiology, 87, 301–312.https://doi.org/10.1016/j.ijpsycho.2012.
12.001.
Berkman, E. T., Kahn, L. E., & Merchant, J. S. (2014). Practice-induced changes in
in-hibitory control network activity. Journal of Neuroscience, 34, 149–157.https://doi.
org/10.1523/JNEUROSCI.3564-13.2014.
Bokura, H., Yamaguchi, S., & Kobayashi, S. (2001). Electrophysiological correlates for response inhibition in a Go/NoGo task. Clinical Neurophysiology, 112, 2224–2232.
https://doi.org/10.1016/S1388-2457(01)00691-5.
Brehmer, Y., Rieckmann, A., Bellander, M., Westerberg, H., Fischer, H., & Bäckman, L. (2011). Neural correlates of practice-related working-memory gains in old age.
Neuroimage, 58, 1110–1120.https://doi.org/10.1016/j.neuroimage.2011.06.079.
Brunet, D., Murray, M. M., & Michel, C. M. (2011). Spatiotemporal analysis of multi-channel EEG: CARTOOL. Computational Intelligence and Neuroscience, 2011, 813870.
https://doi.org/10.1155/2011/813870.
Cabeza, R. (2002). Hemispheric asymmetry reduction in older adults: The HAROLD
model. Psychology and Aging, 17, 85–100.https://doi.org/10.1037/0882-7974.17.
1.85.
Cacioppo, S., Weiss, R. M., Runesha, H. B., & Cacioppo, J. T. (2014). Dynamic spatio-temporal brain analyses using high performance electrical neuroimaging: Theoretical
framework and validation. Journal of Neuroscience Methods, 238, 11–34.https://doi.
org/10.1016/j.jneumeth.2014.09.009.
Cappell, K. A., Gmeindl, L., & Reuter-Lorenz, P. A. (2010). Age differences in prefontal recruitment during verbal working memory maintenance depend on memory load.
Cortex, 46, 462–473.https://doi.org/10.1016/j.cortex.2009.11.009.
Carlson, M. C., Erickson, K. I., Kramer, A. F., Voss, M. W., Bolea, N., Mielke, M., ... Fried, L. P. (2009). Evidence for neurocognitive plasticity in at-risk older adults: The ex-perience corps program. Journals of Gerontology Series A: Biomedical Sciences and
Medical Sciences, 64, 1275–1282.https://doi.org/10.1093/gerona/glp117.
Chambers, C. D., Garavan, H., & Bellgrove, M. A. (2009). Insights into the neural basis of response inhibition from cognitive and clinical neuroscience. Neuroscience &
Biobehavioral Reviews, 33, 631–646.https://doi.org/10.1016/j.neubiorev.2008.08.
016.
Chavan, C. F., Mouthon, M., Draganski, B., van der Zwaag, W., & Spierer, L. (2015). Differential patterns of functional and structural plasticity within and between in-ferior frontal gyri support practice-induced improvements in inhibitory control
pro-ficiency. Human Brain Mapping, 36, 2527–2543.https://doi.org/10.1002/hbm.
22789.
Chen, C. Y., Muggleton, N. G., Tzeng, O. J. L., Hung, D. L., & Juan, C. H. (2009). Control of prepotent responses by the superior medial frontal cortex. Neuroimage, 44, 537–545.
https://doi.org/10.1016/j.neuroimage.2008.09.005.
Colcombe, S. J., Kramer, A. F., Erickson, K. I., & Scalf, P. (2005). The implications of cortical recruitment and brain morphology for individual differences in inhibitory
function in aging humans. Psychology and Aging, 20, 363–375.https://doi.org/10.
1037/0882-7974.20.3.363.
Coxon, J. P., Goble, D. J., Leunissen, I., Van Impe, A., Wenderoth, N., & Swinnen, S. P. (2016). Functional brain activation associated with inhibitory control deficits in older
adults. Cerebral Cortex, 26, 12–22.https://doi.org/10.1093/cercor/bhu165.
Criaud, M., & Boulinguez, P. (2013). Have we been asking the right questions when as-sessing response inhibition in go/no-go tasks with fMRI? A meta-analysis and critical
review. Neuroscience & Biobehavioral Reviews, 37, 11–23.https://doi.org/10.1016/j.
neubiorev.2012.11.003.
Dahlin, E., Neely, A. S., Larsson, A., Backman, L., & Nyberg, L. (2008). Transfer of learning after updating practice mediated by the striatum. Science (80-.), 320,
1510–1512.https://doi.org/10.1126/science.1155466.
De Pretto, M., Rochat, L., & Spierer, L. (2017). Spatiotemporal brain dynamics supporting the immediate automatization of inhibitory control by implementation intentions.
Scientific Reports, 7(1), 10821.https://doi.org/10.1038/s41598-017-10832-xPMID:
28883497.
Dienes, Z. (2011). Bayesian versus orthodox statistics: Which side are you on? Perspectives
on Psychological Science, 6, 274–290.https://doi.org/10.1177/1745691611406920.
Donkers, F. C. L., & van Boxtel, G. J. M. (2004). The N2 in go/no-go tasks reflects conflict
monitoring not response inhibition. Brain and Cognition, 56, 165–176.https://doi.
org/10.1016/j.bandc.2004.04.005.
Dubois, B., Slachevsky, a., Litvan, I., & Pillon, B. (2000). The FAB. Neurology, 55,
1621–1626.https://doi.org/10.1212/WNL.57.3.565.
Enriquez-Geppert, S., Konrad, C., Pantev, C., & Huster, R. J. (2010). Conflict and in-hibition differentially affect the N200/P300 complex in a combined go/nogo and
stop-signal task. Neuroimage, 51, 877–887.https://doi.org/10.1016/j.neuroimage.
2010.02.043.
Erickson, K. I., Colcombe, S. J., Wadhwa, R., Bherer, L., Peterson, M. S., Scalf, P. E., ... Kramer, A. F. (2007). Practice-induced plasticity in older adults: Effects of practice on
hemispheric asymmetry. Neurobiology of Aging, 28, 272–283.https://doi.org/10.
1016/j.neurobiolaging.2005.12.012.
Falkenstein, M., Hoormann, J., & Hohnsbein, J. (1999). ERP components in Go/Nogo
tasks and their relation to inhibition. Acta Psychologica, 101, 267–291.https://doi.
org/10.1016/S0001-6918(99)00008-6.
Fargier, R., & Laganaro, M. (2016). Neurophysiological modulations of non-verbal and
verbal dual-tasks interference during word planning. PLoS One, 11, 1–19.https://doi.
org/10.1371/journal.pone.0168358.
Floden, D., & Stuss, D. T. (2006). Inhibitory control is slowed in patients with right su-perior medial frontal damage. Journal of Cognitive Neuroscience, 18, 1843–1849.
https://doi.org/10.1162/jocn.2006.18.11.1843.
Folstein, M. F., Folstein, S. E., & McHugh, P. R. (1975).“Mini-mental state”. A practical
method for grading the cognitive state of patients for the clinician. Journal of
Psychiatric Research, 12, 189–198.https://doi.org/10.1016/0022-3956(75)90026-6.
Forstmann, B. U., Tittgemeyer, M., Wagenmakers, E.-J., Derrfuss, J., Imperati, D., & Brown, S. (2011). The speed-accuracy tradeoff in the elderly brain: A structural
model-based approach. Journal of Neuroscience, 31, 17242–17249.https://doi.org/
10.1523/JNEUROSCI.0309-11.2011.
Gajewski, P. D., & Falkenstein, M. (2013). Effects of task complexity on ERP components
in Go/Nogo tasks. International Journal of Psychophysiology, 87, 273–278.https://doi.
org/10.1016/j.ijpsycho.2012.08.007.
Godefroy, O., Roussel, M., Despretz, P., Quaglino, V., & Boucart, M. (2010). Age-related slowing: perceptuomotor, decision, or attention decline? Experimental Aging Research,
36, 169–189.https://doi.org/10.1080/03610731003613615.
Gonzalez Andino, S. L., Michel, C. M., Thut, G., Landis, T., & Grave de Peralta Menendez, R. (2005). Prediction of response speed by anticipatory high-frequency (gamma
band) oscillations in the human brain. Human Brain Mapping, 24, 50–58.https://doi.
org/10.1002/hbm.20056.
Gonzalez Andino, S. L., Murray, M. M., Foxe, J. J., & Grave de Peralta Menendez, R. (2005). How single-trial electrical neuroimaging contributes to multisensory
re-search. Experimental Brain Research, 166, 298–304.
https://doi.org/10.1007/s00221-005-2371-1.
Grave De Peralta Menendez, R., Gonzalez Andino, S., Lantz, G., Michel, C. M., & Landis, T. (2001). Noninvasive localization of electromagnetic epileptic activity. I. Method descriptions and simulations. Brain Topography, 14(2), 131–137.
Grave De Peralta Menendez, R., Murray, M. M., Michel, C. M., Martuzzi, R., & Gonzalez Andino, S. L. (2004). Electrical neuroimaging based on biophysical constraints.
Neuroimage, 21, 527–539.https://doi.org/10.1016/j.neuroimage.2003.09.051.
Guthrie, D., & Buchwald, J. S. (1991). Significance testing of difference potentials. Psychophysiology, 28, 240–244.
Hampshire, A., Chamberlain, S. R., Monti, M. M., Duncan, J., & Owen, A. M. (2010). The role of the right inferior frontal gyrus: Inhibition and attentional control. Neuroimage,
50, 1313–1319.https://doi.org/10.1016/j.neuroimage.2009.12.109.
Hartmann, L., Sallard, E., & Spierer, L. (2016). Enhancing frontal top-down inhibitory control with Go/NoGo practice. Brain Structure and Function, 221, 3835–3842.
https://doi.org/10.1007/s00429-015-1131-7.
Heilbronner, U., & Münte, T. F. (2013). Rapid event-related near-infrared spectroscopy detects age-related qualitative changes in the neural correlates of response inhibition.
Neuroimage, 65, 408–415.https://doi.org/10.1016/j.neuroimage.2012.09.066.
Heinzel, S., Lorenz, R. C., Brockhaus, W.-R., Wüstenberg, T., Kathmann, N., Heinz, A., & Rapp, M. A. (2014). Working memory load-dependent brain response predicts be-havioral practice gains in older adults. Journal of Neuroscience, 34, 1224–1233.
https://doi.org/10.1523/JNEUROSCI.2463-13.2014.
Hong, X., Sun, J., Bengson, J. J., & Tong, S. (2014). Age-related spatiotemporal re-organization during response inhibition. International Journal of Psychophysiology, 93,
371–380.https://doi.org/10.1016/j.ijpsycho.2014.05.013.
Hsieh, S., & Fang, W. (2012). Elderly adults through compensatory responses can be just
as capable as young adults in inhibiting theflanker influence. Biological Psychology,
90, 113–126.https://doi.org/10.1016/j.biopsycho.2012.03.006.
Jaffard, M., Benraiss, A., Longcamp, M., Velay, J. L., & Boulinguez, P. (2007). Cueing
method biases in visual detection studies. Brain Research, 1179, 106–118.https://doi.
org/10.1016/j.brainres.2007.08.032.
Jaffard, M., Longcamp, M., Velay, J. L., Anton, J. L., Roth, M., Nazarian, B., & Boulinguez, P. (2008). Proactive inhibitory control of movement assessed by event-related fMRI.
Neuroimage, 42, 1196–1206.https://doi.org/10.1016/j.neuroimage.2008.05.041.
Koenig, T., Kottlow, M., Stein, M., & Melie-García, L. (2011). Ragu: A free tool for the
analysis of EEG and MEG event-related scalpfield data using global randomization
statistics. Computational Intelligence and Neuroscience, 2011, 938925.https://doi.org/
10.1155/2011/938925.
Koenig, T., & Melie-García, L. (2010). A method to determine the presence of averaged
event-relatedfields using randomization tests. Brain Topography, 23, 233–242.
https://doi.org/10.1007/s10548-010-0142-1.
Kopp, B., Lange, F., Howe, J., & Wessel, K. (2014). Age-related changes in neural
re-cruitment for cognitive control. Brain and Cognition, 85, 209–219.https://doi.org/10.
1016/j.bandc.2013.12.008.
Kühn, S., Lorenz, R. C., Weichenberger, M., Becker, M., Haesner, M., O’Sullivan, J., ... Gallinat, J. (2017). Taking control! Structural and behavioural plasticity in response
to game-based inhibition practice in older adults. Neuroimage, 156, 199–206.https://
doi.org/10.1016/j.neuroimage.2017.05.026.
Laganaro, M., Valente, A., & Perret, C. (2012). Time course of word production in fast and slow speakers: A high density ERP topographic study. Neuroimage, 59, 3881–3888.
https://doi.org/10.1016/j.neuroimage.2011.10.082.
Langenecker, S. A., & Nielson, K. A. (2003). Frontal recruitment during response
in-hibition in older adults replicated with fMRI. NeuroImage.https://doi.org/10.1016/
S1053-8119(03)00372-0.
Lehmann, D. (1987). Principles of spatial analysis. In A. S. Gevins, & A. Remond (Eds.), Handbook of electroencephalography and clinical neurophysiology. Methods of