Report
T Follicular Helper Cells Promote a Beneficial Gut
Ecosystem for Host Metabolic Homeostasis by
Sensing Microbiota-Derived Extracellular ATP
Graphical Abstract
Highlights
d
P2X7 receptor activity in Tfh cells is important for shaping the
gut microbiota
d
Control of secretory IgA by Tfh cells promotes a healthy gut
ecosystem
d
Lack of P2X7 in Tfh cells results in selection of an obesogenic
microbiota
d
Sensing of extracellular ATP by P2X7 in Tfh cells promotes
host metabolic balance
Authors
Lisa Perruzza, Giorgio Gargari,
Michele Proietti, ..., Kathy D. McCoy,
Simone Guglielmetti, Fabio Grassi
Correspondence
fabio.grassi@irb.usi.ch
In Brief
Gut commensals contribute to host
metabolic homeostasis. ATP released by
bacteria limits IgA secretion in the small
intestine via the P2X7 receptor expressed
in T follicular helper cells. Perruzza et al.
show that this regulatory mechanism is
important for shaping a diverse
microbiota that promote host metabolic
homeostasis.
Perruzza et al., 2017, Cell Reports18, 2566–2575
March 14, 2017ª 2017 The Authors.
Cell Reports
Report
T Follicular Helper Cells Promote a Beneficial
Gut Ecosystem for Host Metabolic Homeostasis
by Sensing Microbiota-Derived Extracellular ATP
Lisa Perruzza,1,2Giorgio Gargari,3Michele Proietti,1,16Bruno Fosso,4Anna Maria D’Erchia,4,5Caterina Elisa Faliti,1,2 Tanja Rezzonico-Jost,1Daniela Scribano,6,7Laura Mauri,8Diego Colombo,8Giovanni Pellegrini,9Annalisa Moregola,10 Catherine Mooser,11Graziano Pesole,4,5Mauro Nicoletti,6Giuseppe Danilo Norata,10,12Markus B. Geuking,11,13 Kathy D. McCoy,11,14Simone Guglielmetti,3and Fabio Grassi1,8,15,17,*
1Institute for Research in Biomedicine, Universita` della Svizzera Italiana, 6500 Bellinzona, Switzerland 2Graduate School for Cellular and Biomedical Sciences, University of Bern, 3001 Bern 9, Switzerland
3Department of Food, Environmental, and Nutritional Sciences (DeFENS), Universita` degli Studi di Milano, 20133 Milan, Italy 4Institute of Biomembranes and Bioenergetics, National Research Council, 70126 Bari, Italy
5Department of Biosciences, Biotechnologies and Biopharmaceutics, University of Bari, 70126 Bari, Italy
6Department of Medical and Oral Sciences and Biotechnologies, University ‘‘Gabriele D’Annunzio’’, 66100 Chieti, Italy 7Departement of Public Health and Infectious Diseases, University ‘‘La Sapienza’’ of Rome, 00185 Rome, Italy
8Department of Medical Biotechnology and Translational Medicine (BIOMETRA), Universita` degli Studi di Milano, 20129 Milan, Italy 9Laboratory for Animal Model Pathology, Institute of Veterinary Pathology, Vetsuisse Faculty, University of Zurich, 8057 Zurich, Switzerland 10Department of Pharmacological and Biomolecular Sciences (DiSFeB), Universita` degli Studi di Milano, 20133 Milan, Italy
11Maurice M€uller Laboratories, Universita¨tsklinik f€ur Viszerale Chirurgie und Medizin (UVCM), University of Bern, 3010 Bern, Switzerland 12School of Biomedical Sciences, Curtin Health Innovation Research Institute, Curtin University, Perth, WA 6845, Australia
13Department of Microbiology, Immunology and Infectious Diseases and Calvin, Phoebe and Joan Snyder Institute for Chronic Diseases,
Cumming School of Medicine, University of Calgary, Calgary, AB T2N 4N1, Canada
14Department of Physiology and Pharmacology and Calvin, Phoebe and Joan Snyder Institute for Chronic Diseases, Cumming School of
Medicine, University of Calgary, Calgary, AB T2N 4N1, Canada
15Istituto Nazionale Genetica Molecolare ‘‘Romeo ed Enrica Invernizzi,’’ 20122 Milan, Italy
16Present address: CCI-Center for Chronic Immunodeficiency, Universita¨tsklinikum Freiburg, 79106 Freiburg, Germany 17Lead Contact
*Correspondence:fabio.grassi@irb.usi.ch http://dx.doi.org/10.1016/j.celrep.2017.02.061
SUMMARY
The ATP-gated ionotropic P2X7 receptor regulates
T follicular helper (Tfh) cell abundance in the Peyer’s
patches (PPs) of the small intestine; deletion of
P2rx7, encoding for P2X7, in Tfh cells results in
enhanced IgA secretion and binding to commensal
bacteria. Here, we show that Tfh cell activity is
impor-tant for generating a diverse bacterial community in
the gut and that sensing of microbiota-derived
extra-cellular ATP via P2X7 promotes the generation of a
proficient gut ecosystem for metabolic homeostasis.
The results of this study indicate that Tfh cells play a
role in host-microbiota mutualism beyond protecting
the intestinal mucosa by induction of affinity-matured
IgA and suggest that extracellular ATP constitutes an
inter-kingdom signaling molecule important for
se-lecting a beneficial microbial community for the host
via P2X7-mediated regulation of B cell help.
INTRODUCTION
The gastrointestinal tract of mammals is colonized by bacteria at birth, and, thereafter, a mutualistic interaction with the evolving
microbiota is established. The microbiota regulates the meta-bolic balance of the organism by generating bioactive molecules that are absorbed through the intestinal epithelium. A compari-son of conventionally reared and germ-free (GF) mice showed that the gut microbiota regulates host fat storage. The transfer of cecal microbiota from conventional to GF mice results in a sig-nificant increase in body fat content and insulin resistance (Ba¨ckhed et al., 2004). A primary role of intestinal commensals in the pathophysiology of metabolism was shown by reproduc-tion of an obese phenotype in GF mice by transplantareproduc-tion of the microbiota isolated from obese animals (Turnbaugh et al., 2006).
Bacteria stimulate the development of gut-associated lymphoid
tissue (GALT) (Macpherson and Harris, 2004). The intestinal
tissue must integrate commensal bacteria and maintain their number and composition without inducing inflammation-medi-ated tissue damage (Littman and Pamer, 2011). Central in this homeostatic relationship is the production of immunoglobulin A (IgA). T follicular helper (Tfh) cells in the Peyer’s patches (PPs) of the small intestine promote germinal center (GC) reactions and affinity maturation of IgA responses that are critical for efficient mucosal defense by limiting the translocation of poten-tially invasive bacteria and microbial inflammatory compounds from the gut lumen into the organism (Fagarasan et al., 2002; Shroff et al., 1995; Wei et al., 2011). Importantly, regulation of high-affinity IgA responses by T follicular regulatory (Tfr) cells
promotes the diversification and influences the composition of the microbiota in the gut (Kawamoto et al., 2014).
In mice deficient for the ATP-gated ionotropic receptor P2X7 (P2rx7 / ), Tfh cells are significantly increased in PPs because of resistance to cell death induced by extracellular ATP. The altered regulation of Tfh cells in these mice results in enhanced secretory IgA responses (Proietti et al., 2014). Here we show that lack of P2X7-mediated control of Tfh cells results in altered microbiota composition that is responsible for impaired glucose homeostasis and enhanced fat deposition.
RESULTS
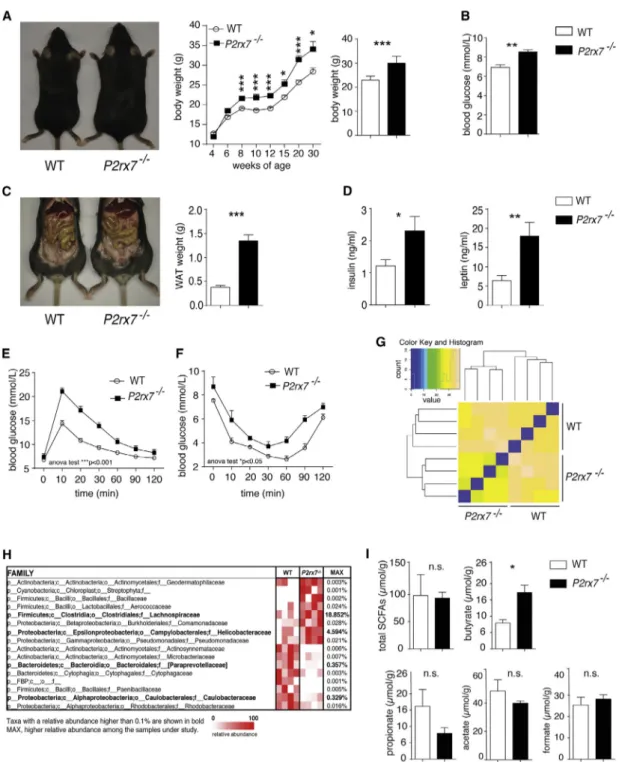
Increased Body Weight and Impaired Glucose Metabolism inP2rx7 / Mice
A characteristic trait of P2rx7 / mice is the increase in body
weight with respect to wild-type (WT) littermates (Beaucage
et al., 2014;Figure 1A). P2rx7 / animals at 8 weeks had a sig-nificant increase in blood glucose, white adipose tissue (WAT) mass, serum insulin, and leptin with respect to WT littermates (Figures 1B–1D). Moreover, P2rx7 / mice showed significant
glucose intolerance and decreased insulin sensitivity, as measured by glucose tolerance test (GTT) and insulin tolerance
test (ITT) (Figures 1E and 1F). Food consumption was not
different between the two strains of mice (data not shown), as were plasma total cholesterol (76.9± 23.1 mg/dL versus 66.5 ±
17.5 mg/dL in 9-week-old WT and P2rx7 / animals,
respec-tively; n = 5) and plasma triglyceride levels (104.2± 25.4 mg/dL
versus 95.4 ± 14.9 mg/dL in WT and P2rx7 / animals,
respectively).
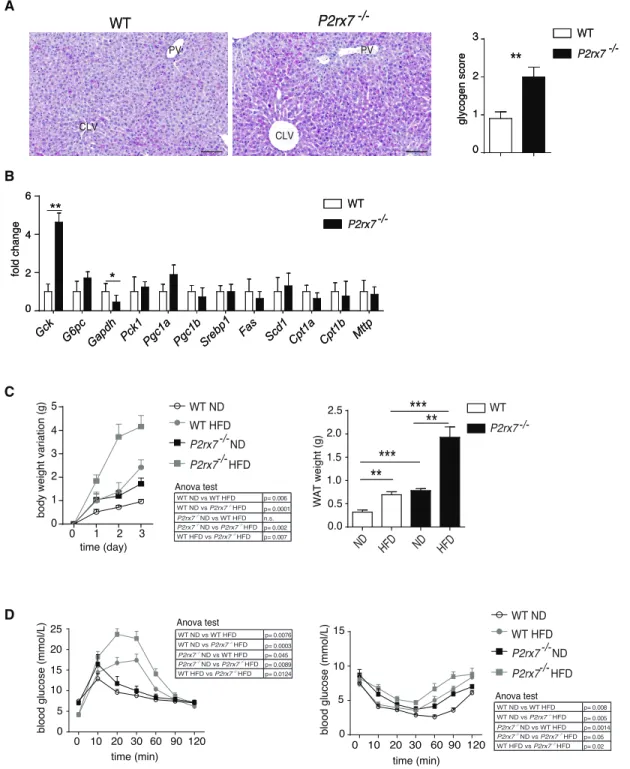
Macroscopic analysis at 9 weeks revealed liver enlargement
(weights, WT: 1.057± 0.04 g; P2rx7 / : 1.346± 0.038 g; n =
10; p = 0.0006) that was associated with significantly elevated
glycogen in fasted P2rx7 / compared with WT mice, which
ex-hibited only minimal, scattered glycogen deposition (Figure S1A). Glucokinase (GCK) mRNA levels were significantly increased
in P2rx7 / mice, suggesting that hyperglycemia could result
in increased glucose flux (Figure S1B). However, intracellular glucose does not appear to enter glycolysis because transcript levels of the key enzyme glyceraldehyde 3-phosphate dehydro-genase (GAPDH), which catabolizes the conversion of glucose 1,3 biphospate to 1,3-bisphosphoglyceric acid and fosters
glycolysis, were reduced (Figure S1B). This implies that
increased intracellular glucose could be accumulated as glycogen and, indeed, could explain the observed phenotype. Other metabolic pathways in the liver did not appear to be affected (Figure S1B). These results suggest that P2X7 activity is important in the regulation of glucose homeostasis. The
altered metabolic control we observed in P2rx7 / mice was
worsened by a high-fat diet, which induced a significant increase in body and WAT weights as well as significantly impaired glucose tolerance and insulin sensitivity with respect to WT
litter-mates (Figures S1C and S1D), suggesting that P2rx7 / mice
are more sensitive to increased caloric intake.
Altered Microbiota Composition inP2rx7 / Mice
Hierarchical clustering of mice for cecal microbiota showed that
P2rx7 / animals clustered together and separately with respect
to WT littermates (Figure 1G). Among the most represented fam-ilies, we detected the increase of Lachnospiraceae and
Helico-bacteraceae in P2rx7 / mice. In contrast, Paraprevotellaceae
and Caulobacteraceae were enriched in WT animals (Figure 1H). The increase of Lachnospiraceae within gut commensals has been associated with obesity (Cho et al., 2012). Many species belonging to this family have been shown to produce butyrate (Duncan et al., 2002; Meehan and Beiko, 2014), the abundance
of which has been associated with obesity (Cho et al., 2012;
Turnbaugh et al., 2006). Quantification of short chain fatty acids
(SCFAs) in cecal content of WT and P2rx7 / mice revealed a
significant increase in butyrate in mutant mice (Figure 1I). These data suggest that variations in selected families of the microbiota might result from deletion of P2rx7 and contribute to the observed altered glucose metabolism.
Cell-Intrinsic Role of Tfh Cells in Glucose Homeostasis
Adoptive transfer of P2rx7 / Tfh cells into lymphopenic mice
results in enhanced expansion in PPs with respect to WT cells (Proietti et al., 2014; Figure S2A). 1 month after transfer into
Cd3e / mice, both WT and P2rx7 / cells maintained the Tfh
phenotype, characterized by CXCR5, Bcl6, PD1, and inducible T-cell costimulator (ICOS) expression, with few cells expressing Foxp3 (Figures S2B–S2D). Transfer of mutant cells resulted in
significantly enhanced GC reactions (Figure S2E), increased
body and WAT weights, and increased blood glucose, insulin, and leptin levels (Figures 2A and 2B). GTT also revealed impaired glucose sensitivity (Figure 2C). Firmicutes were significantly increased, with concomitant reduction of both Bacteroidetes and Proteobacteria (Figure 2D). The analysis of variations in fam-ily abundances showed a significant increase in Lachnospira-ceae, a characteristic feature of P2rx7 / mice (Figure 1H), and of an undetermined family belonging to the order Clostridiales in P2rx7 / chimeric mice (Figure 2E). Moreover, quantification of SCFAs showed a significant increase in butyrate (Figure 2F). Therefore, P2rx7 / Tfh cells appear to be sufficient for deter-mining the modifications in metabolic parameters and
micro-biota composition that were observed in P2rx7 / mice.
Selective Role of Tfh Cells in Regulating Glucose Metabolism
To understand whether Tfh cell activity in P2rx7 / mice played a causative role in the development of metabolic syndrome by
shaping the microbiota, we compared Icos / and Icos /
P2rx7 / double mutant mice, which are devoid of Tfh and GC B cells (Figures S3A and S3B), for microbiota composition and
metabolic parameters. Icos / mice exhibit normal CD4 and
CD8 cell populations in lymph nodes and spleen (Dong et al.,
2001). However, effector/memory CD4 (CD44+CD62L ) as well
as T regulatory and Th17 cells in PPs and mesenteric lymph no-des (MLNs) were significantly reduced (Figures S3C and S3D).
Icos / mice were characterized by an increase in IgA-coated
bacteria in stools with respect to WT mice (Figure S4A), a finding consistent with a predominant T-independent IgA response
to commensals (Bunker et al., 2015) and modulation of the
secretory IgA response by Tfh cells (Kawamoto et al., 2014). Concomitant deletion of P2rx7 did not affect IgA coating in ICOS-deficient mice, indicating that lack of P2X7 in ICOS cells
Figure 1. Alterations of Metabolic Parameters and Microbiota Composition inP2rx7 / Mice (A–F) P2rx7 /
and WT littermates, weight gain in WT and P2rx7 /
mice, and body weight (n = 20) (A) and blood glucose concentration (n = 20) (B) at 9 weeks. Also shown are representative abdomens and statistics of WAT weights (n = 20) (C). Serum insulin and leptin concentrations (n = 20) are shown (D) as well as glucose homeostasis determined by GTT (E) and ITT (F) in WT and P2rx7 /
mice (n = 5).
(G) Similarity in mouse microbiota by Euclidean distances between cecal samples from WT and P2rx7 /
mice based on the taxonomic assignment at family rank. Dendrograms show the Euclidean distances between cecal samples, and the matrix colors are proportional to the observed distances.
(H) Heatmap of bacterial families in cecal microbiota that discriminate WT from P2rx7/
mice. Families were selected according to p < 0.1 with two-tailed unpaired Student’s t test. Each line represents one family, and each column represents an individual mouse. Mean relative abundances of families detected in WT and P2rx7/
mice and the p value for each family are shown. Operational taxonomic units (OTUs) with a relative abundance higher than 0.1% in at least one sample are shown in bold.
(I) SCFA quantification in cecum content of WT and P2rx7 / mice (n = 5).
Figure 2. Cell-Intrinsic Role of Tfh Cells in Regulating Glucose Metabolism
(A–C) Body weight variation and WAT weight (A); blood glucose, insulin, and leptin levels (B); and GTT (C) in Cd3e /
mice reconstituted with WT or P2rx7 /
Tfh cells (n = 5).
(D and E) Phylum (D) and family (E) relative abundances in Cd3e/
mice reconstituted with WT or P2rx7 /
Tfh cells (n = 5). (F) Butyrate quantification in cecum content of Cd3e /
mice reconstituted with WT or P2rx7 /
Tfh cells (n = 5).
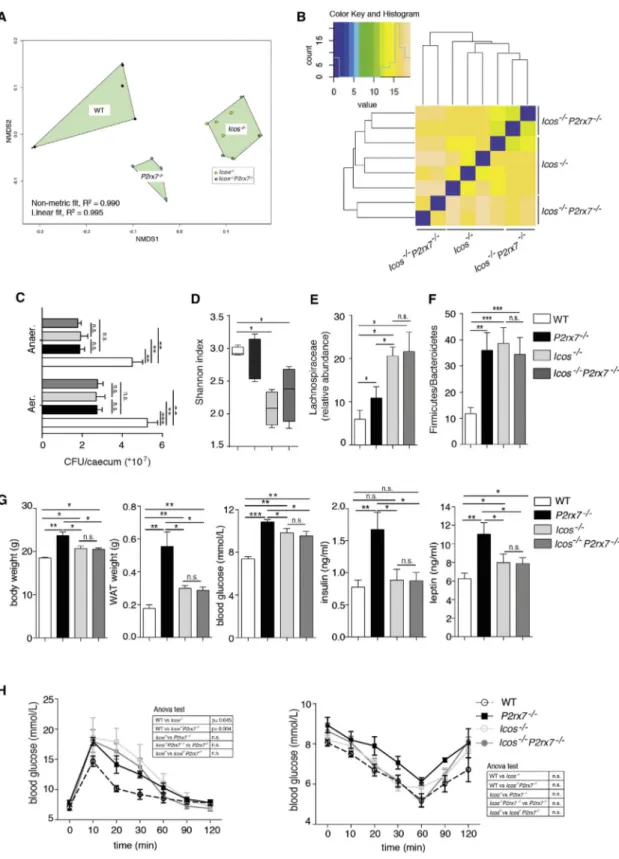
Figure 3. Crucial Role of Tfh Cells in Shaping Commensal Microbiota Composition
(A) Similarity among cecal microbiota through non-metric multidimensional scaling (NMDS) based on an unweighted Unifrac dissimilarity matrix. (B) Euclidean distances inferred on taxonomic assignment at family rank between cecal samples from Icos /
and Icos /
P2rx7 /
mice. (C) Statistical analysis of CFUs of aerobic and anaerobic bacteria recovered from the ceca of WT, P2rx7 /
(n = 10), Icos /
, and Icos /
P2rx7 /
mice (n = 5). (D) Box and whisker plots of the Shannon diversity index at the bacterial family level in WT, P2rx7 /, Icos / , and Icos/ P2rx7 / mouse cecal samples (n = 4). (legend continued on next page)
does not influence the enhanced IgA response (Figure S4A). Notably, culture of aerobic and anaerobic bacteria from the cecum revealed the significant reduction of colony-forming units
(CFUs) in samples from ICOS-deficient and P2rx7 / mice (
Fig-ure 3C), suggesting that deregulated IgA might impair the expan-sion of the cecal microbial community.
The overall microbiota compositions of Icos / mutants
clus-tered together byb-diversity analysis and were well separated
from WT- and P2rx7 / -derived samples (Figure 3A). Icos /
also co-clustered with Icos / P2rx7 / mice for microbiota
composition in a hierarchical clustering analysis (Figure 3B). These data indicate that Icos deletion (i.e., lack of Tfh cells) causes drastic changes in the gut microbial taxonomic
structure. Moreover, a-diversity was significantly reduced in
ICOS-deficient animals, supporting the importance of Tfh cell activity in generating a diverse microbiome (Kawamoto et al., 2014; Figure 3D). The reduction of microbial biodiversity in
Icos / -associated microbiota was reflected by depletion of
microbial functions through phylogenetic investigation of com-munities by reconstruction of unobserved states (PICRUSt) prediction of metabolic potential (Langille et al., 2013;Figure S4B).
In Icos / and Icos / P2rx7 / mice, we observed a significant
increase in the Lachnospiraceae (Figure 3E) and Firmicutes to
Bacteroidetes ratio (Figure 3F) together with significantly
increased body and WAT weights, blood glucose, and leptin ( Fig-ure 3G). Moreover, glucose tolerance was impaired. Different from
P2rx7 / mice, serum insulin and insulin tolerance tests were not altered in both Icos / and Icos / P2rx7 / mice with respect to
WT mice (Figures 3G–3H). Notably, Icos / and Icos / P2rx7 /
mice were characterized by indistinguishable metabolic
parame-ters, ruling out a contribution of P2X7 in ICOS cells to
these phenotypic traits. Altogether, these results underscore the importance of Tfh cells in selecting a proficient microbiota for host glucose homeostasis.
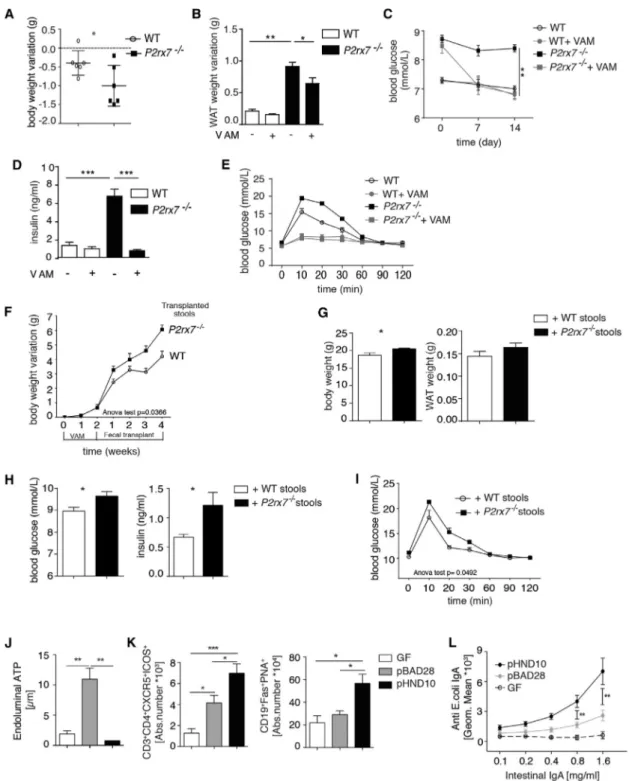
Role of Commensal Microbiota in Altered Glucose Metabolism ofP2rx7 / Mice
We treated WT and P2rx7 / mice with vancomycin, ampicillin,
and metronidazole (VAM) to deplete most bacterial species pre-sent in the gut. As expected, Tfh cells from P2rx7 / mice were relatively resistant to cell death induced by massive release of
bacterial ATP by VAM compared with WT cells (Figure S5A).
Administration of VAM resulted in a significantly enhanced reduction in body and WAT weights as well as blood glucose
in P2rx7 / mice compared with WT littermates (Figures 4A–
4C). In addition, serum concentrations of insulin and GTTs of
VAM-treated P2rx7 / mice became indistinguishable from their
WT counterparts (Figures 4D and 4E). GF P2rx7 / mice at
10 weeks showed analogous body and WAT weights to WT litter-mates and indistinguishable glucose serum levels as well as tolerance to glucose bolus. Some reduction of insulin serum con-centration, albeit not reaching statistical significance, was
de-tected in P2rx7 / mice (Figures S5C and S5D). These data
confirm the role of the microbiota in the metabolic phenotype
of P2rx7 / mice. To understand whether the changes in the
gut microbiota characteristic of P2rx7 / mice were the cause
of the observed metabolic phenotype, we transplanted cecal
content isolated from P2rx7 / mice into VAM-treated WT
ani-mals. Administration of VAM with depletion of the microbiota re-sulted in significant diminution of Tfh cells; fecal transplant restored Tfh cell abundance. Microbiota isolated from P2rx7 / mice induced a significant increase in Tfh cells compared with autochthonous microbiota (Figure S5B), suggesting that micro-biota conditioned by P2rx7 / Tfh cells can amplify the regula-tion of Tfh cells in a feedforward loop. Mice transplanted with
microbiota from P2rx7 / mice gained significantly more weight
compared with mice transplanted with bacteria from WT mice (Figure 4F). Moreover, body and WAT weights and blood glucose and insulin concentrations 4 weeks after transplant were all
increased in mice harboring bacteria isolated from P2rx7 /
mice (Figures 4G and 4H), and tolerance to glucose was signifi-cantly impaired (Figure 4I). These results suggest that the gut
microbiota associated with P2rx7 / mice has the transmissible
capacity to promote the fat deposition and development of metabolic features characteristic of these mutant animals.
ATP Released by Commensals Limits the Secretory IgA Response in the Small Intestine
We directly addressed whether bacterially derived ATP could in-fluence T cell-dependent IgA responses via P2X7. The IgA response to E. coli is dependent on Tfh cells in PPs (Le´cuyer et al., 2014) and is significantly more effective in P2rx7 / mice (Proietti et al., 2014), suggesting that P2X7 activity can affect the T cell-dependent IgA response. We used a recombinant
E. coli K-12 strain carrying the pHND10 plasmid, which encodes phoN2::HA fusion of Shigella flexneri, a periplasmic
ATP-diphos-phohydrolase (apyrase) (Santapaola et al., 2006; Scribano et al.,
2014). Extracellular ATP released concomitantly with E. coli
growth (Hironaka et al., 2013) was undetectable in cultures
of these transformants, indicating that apyrase efficiently abrogated ATP secretion (data not shown). Accordingly, GF mice monocolonized with these bacteria showed significantly reduced ATP in the intestine compared with mice monocolon-ized with bacteria carrying an empty vector (Figure 4J). Consis-tent with a role of endoluminal ATP in regulating Tfh cell number and GC reaction in the PPs of the small intestine (Proietti et al., 2014), both Tfh and GC B cells were increased in animals
colo-nized with apyrase-expressing bacteria (Figure 4K), as was
E. coli-specific IgA in the intestinal fluid (Figure 4L). These data indicate that extracellular ATP released by commensals limits the secretory IgA response in the small intestine.
DISCUSSION
The gut microbiota can affect many aspects of host metabolism, including energy harvesting from nutrients, hepatic lipogenesis,
(E and F) Relative abundance of the Lachnospiraceae family (E) and Firmicutes/Bacteroidetes ratio (F) in the indicated mice (n = 4). (G) Body and WAT weights and blood glucose, insulin, and leptin concentrations (n = 10).
(H) GTT (left) and ITT (right) in WT (white dots), P2rx7 /
(black squares), Icos /
(light gray) and Icos /
P2rx7 /
(dark gray) mice (n = 10). Means± SEM are shown, and Mann-Whitney test (C–G) and two-way ANOVA (H) were used. *p < 0.05, **p < 0.01, ***p < 0.001.
Figure 4. Role of Microbiota ofP2rx7 / Mice in Altering Glucose Metabolism
(A–E) Body (A) and WAT (B) weight variation, blood glucose (C) and insulin levels (D), and GTT (E) in WT and P2rx7 /
mice after 14 days of VAM (n = 5). (F–I) Weight gain (F), body and WAT weights (G), blood glucose and insulin (H), and GTT (I) in WT mice transplanted with WT or P2rx7 /
microbiota (n = 5). (J) Concentrations of ATP in ilea from GF mice either non-colonized (GF) or colonized with pBAD28 or pHND10 bearing E. coli.
(K) Quantification of Tfh and GC B cells in non-colonized or monocolonized animals as indicated.
(L) Intestinal anti-E. coli IgA quantification at fluorescence-activated cell sorting (FACS) (seeExperimental Procedures) in GF mice or mice monocolonized with the indicated E. coli transformants (n = 5).
and adipose tissue development (Ba¨ckhed et al., 2004; Cox and Blaser, 2013; Turnbaugh et al., 2006). Signaling pathways involved in reciprocal regulation of the adaptive immune system and microbiota to ensure the generation and maintenance of a healthy microbial community are poorly defined. We have shown that regulation of Tfh cell activity by the ATP-gated iono-tropic P2X7 receptor contributes to the selection of a beneficial microbiota for glucose metabolism and fat deposition. Interest-ingly, hypo-functioning P2X7 variants were recently associated with impaired glucose homeostasis in both mice and humans (Todd et al., 2015). We observed that changes in the microbiota by enhanced Tfh cell activity were responsible for metabolic ab-normalities and obesity. Previous microbial taxonomy of stool
and mucus from P2rx7 / mice did not reveal significant
modi-fications with respect to the WT counterpart (Proietti et al., 2014). Apart from dissimilarities in accurately assigning ampli-cons to different taxa by the different techniques used for micro-biota profiling (Kang et al., 2014), this apparent discrepancy could be due to selective variation in microbiota composition
in the ceca of P2rx7 / mice, where diversity of the bacterial
ecosystem might be more sensitive to enhanced IgA coating. Bacterial coating by IgA restricts bacterial access to the epithe-lium and can promote the survival of specific bacteria that affect the intestinal as well as general metabolism (Mantis et al., 2011). Moreover, the diversified microbiota resulting from T-dependent secretory IgA pressure has been suggested to play a pivotal role in promoting the ecological adaptability and speciation potential of mammals (Sutherland et al., 2016).
Release of ATP from commensals limits Tfh cell-dependent helper activity, and abrogation of this release (Figure 4J) or signaling via P2X7 in Tfh cells (Proietti et al., 2014) results in enhanced taxon-specific secretory IgA responses. The results obtained with mice adoptively transferred with Tfh cells indicate that sensing of extracellular ATP by Tfh cells via P2X7 is exclu-sively responsible for the metabolic alterations observed in
P2rx7 / mice. Obesity was associated with an increased ratio of Firmicutes to Bacteroidetes (Cho et al., 2012; Ley et al., 2005; Turnbaugh et al., 2006), which was, in turn, associated with increased concentrations of butyrate in the intestine of
obese versus lean mice (Cho et al., 2012; Turnbaugh et al.,
2006). This interrelation with possible metabolic relevance
might be sensitive to manipulation of the ATP/P2X7 axis in Tfh cells.
Tfh cells are regulated in the PPs by Tfr cells. IgA generated and selected in the presence of Tfr cells coated a larger diver-sity of bacterial taxa than in their absence. This coating was hypothesized to directly influence the diversity and phylo-genetic structure of the intestinal bacterial ecosystem by contributing to the maintenance, rather than elimination, of
indigenous bacteria (Kawamoto et al., 2014). We have
previ-ously shown that lack of P2X7 results in an increase
in Tfh, but not Tfr, cell abundance in the PPs (Proietti
et al., 2014). The deregulated activation of Tfh cells in the absence of the concomitant modulation by Tfr cells might result in loss of the controlled diversification of stimulatory bacteria that were hypothesized to promote a
self-regula-tory loop important for host-bacterial mutualism (Kawamoto
et al., 2014). Defective Tfr activity as well as lack of Tfh cells
(Icos / mice) resulted in a higher Firmicutes-to-Bacteroidetes ratio and expansion of bacteria belonging to Lachnospiraceae analogous to mice with P2X7-deficient Tfh cells. These results indicate that regulated GC reaction profoundly af-fects host metabolism by shaping a proficient microbiota. The lack of sensitivity of PP Tfh cells to endoluminal ATP com-promises the host metabolism, thereby suggesting that ATP in the gut acts as an inter-kingdom signaling molecule ensuring the establishment of a healthy relationship between microbiota, the adaptive immune response, and systemic homeostasis.
EXPERIMENTAL PROCEDURES Mice
All animal experiments were performed in accordance with the Swiss Federal Veterinary Office guidelines and as authorized by the Cantonal Veterinary Office. C57BL/6J, P2rx7 /
(B6.129P2-P2rx7tm1Gab
/J), Icos /
, and Cd3e /
mice were bred in the specific pathogen-free (spf) facility at the Institute for Research in Biomedicine Switzerland.
Adoptive Transfer of Tfh Cells CD4+
CD8 CXCR5+
ICOS+
cells from pooled PPs of WT or P2rx7/
mice were sorted on a FACSAria. Eight-week-old Cd3e /
mice were injected intrave-nously (i.v.) with 13 105
Tfh cells. Recipient mice were sacrificed 4 weeks after reconstitution.
Microbiota Transplantation
Eight-week-old C57BL/6J mice were gavaged for 2 weeks with vancomycin (1.25 mg), ampicillin (2.5 mg), and metronidazole (2.5 mg) in 200mL PBS and then gavaged for 3 days with fresh cecal content (200mL) collected from donor mice and resuspended in PBS (0.01 g/mL).
GTT, ITT, Serum Insulin, and Leptin Quantification
Animals were fasted for 12 hr (GTT) or 6 hr (ITT) and then received an intraper-itoneal (i.p.) injection of glucose (2 g/kg of body weight) or insulin (0.6 U/kg). Blood glucose was monitored for 120 min using a glucometer on samples collected from the tip of the tail vein. Insulin and leptin were quantified by ELISA.
Taxonomic Analysis of Microbiota
For the evaluation of intestinal microbiota, the bacterial microbiota of cecal samples from WT, P2rx7 /
, Icos /
, and Icos /
P2rx7 /
mice has been investigated by sequencing the V5–V6 hypervariable regions of the 16S rDNA gene by using the Illumina MiSeq platform. The prokaryotic composition of the tested samples has been assessed by bioinformatic analysis of metagenomic amplicons (BioMaS) on the paired end (PE) reads generated by Illumina MiSeq sequencing. In experiments with adoptive transfer of Tfh cells, microbial V5 and V6 regions were sequenced on the Ion Torrent PGM (personal genome machine) system using a 316v2 chip and analyzed using QIIME V1.8.0. Operational taxonomic units (OTU) were generated using uclust and a 97% identity threshold. Taxonomy assignment was performed by blasting representative OTU sequences against the latest Greengenes database.
Statistical Analysis
The displayed data are representative of at least three independent experi-ments. Results were analyzed using the nonparametric Mann Whitney test, Student’s unpaired t test, and two-way ANOVA with Bonferroni post-test analysis. Results are presented as mean± SEM. Values of p < 0.05 were considered statistically significant. For statistical analyses of microbiota, R statistic software (version 3.1.2) was used. Differences between the effects on microbiota composition were evaluated by analyzing the data with non-parametric Wilcoxon Mann-Whitney test with Benjamini-Hochberg correction, using paired data when possible, with which we could decide whether the
population distributions were identical without assuming them to follow the normal distribution.
ACCESSION NUMBERS
The accession numbers for the sequences reported in this paper are SRA: SRP099819 and ENA: PRJEB19531 (for adoptive transfer of Tfh cells).
SUPPLEMENTAL INFORMATION
Supplemental Information includes Supplemental Experimental Procedures and five figures and can be found with this article online athttp://dx.doi.org/ 10.1016/j.celrep.2017.02.061.
AUTHOR CONTRIBUTIONS
F.G., L.P., and M.P. designed the experiments. L.P. performed most experi-ments. M.P., C.E.F., and T.R.J. performed experiexperi-ments. A.M.D., C.M., and M.G. performed 16S metagenomic sequencing. L.M. and D.C. performed gas chromatography for SCFA quantification, G. Pellegrini performed the histological analysis. A.M. and G.D.N. performed the liver gene expression analysis. G.G., B.F., G. Pesole, M.B.G., and S.G. contributed bioinformatic analyses. M.G. and K.D.M. generated GF mice. D.S. and M.N. contributed
E. coli transformants. F.G. and L.P. analyzed data and wrote the paper with
contributions from G.G. and S.G.
ACKNOWLEDGMENTS
We thank David Jarrossay (Institute for Research in Biomedicine) for cell sort-ing and Teresa De Filippis, Claudia Lionetti (University of Bari), and Caterina Manzari (Institute of Biomembranes and Bioenergetics) for contributing to 16S metagenomic sequencing. The work was supported by grant 310030_159491 and Sinergia CRSII2_127547 of the Swiss National Science Foundation (SNSF), grant 12A09 of the Novartis Stiftung f€ur Medizinisch-Biologische Forschung, Nano-Tera Project 20NA21_128841, Fondazione Ticinese per la Ricerca sul Cancro, and Fondazione per la Ricerca sulla Tras-fusione e sui Trapianti and Converge Biotech (to F.G.). The Ph.D. fellowship of L.P. was supported by Signora Alessandra. C.M. was supported by MD-PhD-Programm SNF323530_158124. K.D.M. is supported by a grant from the SNSF (SNSF310030_134902) and European Research Council (FP/2007-2013) agreement no. 281785. Received: August 8, 2016 Revised: January 24, 2017 Accepted: February 17, 2017 Published: March 14, 2017 REFERENCES
Ba¨ckhed, F., Ding, H., Wang, T., Hooper, L.V., Koh, G.Y., Nagy, A., Semenko-vich, C.F., and Gordon, J.I. (2004). The gut microbiota as an environmental fac-tor that regulates fat sfac-torage. Proc. Natl. Acad. Sci. USA 101, 15718–15723.
Beaucage, K.L., Xiao, A., Pollmann, S.I., Grol, M.W., Beach, R.J., Holdsworth, D.W., Sims, S.M., Darling, M.R., and Dixon, S.J. (2014). Loss of P2X7 nucleo-tide receptor function leads to abnormal fat distribution in mice. Purinergic Signal. 10, 291–304.
Bunker, J.J., Flynn, T.M., Koval, J.C., Shaw, D.G., Meisel, M., McDonald, B.D., Ishizuka, I.E., Dent, A.L., Wilson, P.C., Jabri, B., et al. (2015). Innate and adap-tive humoral responses coat distinct commensal bacteria with immunoglob-ulin A. Immunity 43, 541–553.
Cho, I., Yamanishi, S., Cox, L., Methe´, B.A., Zavadil, J., Li, K., Gao, Z., Mahana, D., Raju, K., Teitler, I., et al. (2012). Antibiotics in early life alter the murine colonic microbiome and adiposity. Nature 488, 621–626.
Cox, L.M., and Blaser, M.J. (2013). Pathways in microbe-induced obesity. Cell Metab. 17, 883–894.
Dong, C., Juedes, A.E., Temann, U.A., Shresta, S., Allison, J.P., Ruddle, N.H., and Flavell, R.A. (2001). ICOS co-stimulatory receptor is essential for T-cell activation and function. Nature 409, 97–101.
Duncan, S.H., Barcenilla, A., Stewart, C.S., Pryde, S.E., and Flint, H.J. (2002). Acetate utilization and butyryl coenzyme A (CoA):acetate-CoA transferase in butyrate-producing bacteria from the human large intestine. Appl. Environ. Mi-crobiol. 68, 5186–5190.
Fagarasan, S., Muramatsu, M., Suzuki, K., Nagaoka, H., Hiai, H., and Honjo, T. (2002). Critical roles of activation-induced cytidine deaminase in the homeo-stasis of gut flora. Science 298, 1424–1427.
Hironaka, I., Iwase, T., Sugimoto, S., Okuda, K., Tajima, A., Yanaga, K., and Mizunoe, Y. (2013). Glucose triggers ATP secretion from bacteria in a growth-phase-dependent manner. Appl. Environ. Microbiol. 79, 2328–2335.
Kang, S.S., Jeraldo, P.R., Kurti, A., Miller, M.E., Cook, M.D., Whitlock, K., Goldenfeld, N., Woods, J.A., White, B.A., Chia, N., and Fryer, J.D. (2014). Diet and exercise orthogonally alter the gut microbiome and reveal indepen-dent associations with anxiety and cognition. Mol. Neurodegener. 9, 36.
Kawamoto, S., Maruya, M., Kato, L.M., Suda, W., Atarashi, K., Doi, Y., Tsutsui, Y., Qin, H., Honda, K., Okada, T., et al. (2014). Foxp3(+) T cells regulate immu-noglobulin a selection and facilitate diversification of bacterial species respon-sible for immune homeostasis. Immunity 41, 152–165.
Langille, M.G., Zaneveld, J., Caporaso, J.G., McDonald, D., Knights, D., Reyes, J.A., Clemente, J.C., Burkepile, D.E., Vega Thurber, R.L., Knight, R., et al. (2013). Predictive functional profiling of microbial communities using 16S rRNA marker gene sequences. Nat. Biotechnol. 31, 814–821.
Le´cuyer, E., Rakotobe, S., Lengline´-Garnier, H., Lebreton, C., Picard, M., Juste, C., Fritzen, R., Eberl, G., McCoy, K.D., Macpherson, A.J., et al. (2014). Segmented filamentous bacterium uses secondary and tertiary lymphoid tissues to induce gut IgA and specific T helper 17 cell responses. Im-munity 40, 608–620.
Ley, R.E., Ba¨ckhed, F., Turnbaugh, P., Lozupone, C.A., Knight, R.D., and Gor-don, J.I. (2005). Obesity alters gut microbial ecology. Proc. Natl. Acad. Sci.
USA 102, 11070–11075.
Littman, D.R., and Pamer, E.G. (2011). Role of the commensal microbiota in normal and pathogenic host immune responses. Cell Host Microbe 10, 311–323.
Macpherson, A.J., and Harris, N.L. (2004). Interactions between commensal intestinal bacteria and the immune system. Nat. Rev. Immunol. 4, 478–485.
Mantis, N.J., Rol, N., and Corthe´sy, B. (2011). Secretory IgA’s complex roles in immunity and mucosal homeostasis in the gut. Mucosal Immunol. 4, 603–611.
Meehan, C.J., and Beiko, R.G. (2014). A phylogenomic view of ecological specialization in the Lachnospiraceae, a family of digestive tract-associated bacteria. Genome Biol. Evol. 6, 703–713.
Proietti, M., Cornacchione, V., Rezzonico Jost, T., Romagnani, A., Faliti, C.E., Perruzza, L., Rigoni, R., Radaelli, E., Caprioli, F., Preziuso, S., et al. (2014). ATP-gated ionotropic P2X7 receptor controls follicular T helper cell numbers in Peyer’s patches to promote host-microbiota mutualism. Immunity 41, 789–801.
Santapaola, D., Del Chierico, F., Petrucca, A., Uzzau, S., Casalino, M., Co-lonna, B., Sessa, R., Berlutti, F., and Nicoletti, M. (2006). Apyrase, the product of the virulence plasmid-encoded phoN2 (apy) gene of Shigella flexneri, is necessary for proper unipolar IcsA localization and for efficient intercellular spread. J. Bacteriol. 188, 1620–1627.
Scribano, D., Petrucca, A., Pompili, M., Ambrosi, C., Bruni, E., Zagaglia, C., Prosseda, G., Nencioni, L., Casalino, M., Polticelli, F., and Nicoletti, M. (2014). Polar localization of PhoN2, a periplasmic virulence-associated factor of Shigella flexneri, is required for proper IcsA exposition at the old bacterial pole. PLoS ONE 9, e90230.
Shroff, K.E., Meslin, K., and Cebra, J.J. (1995). Commensal enteric bacteria engender a self-limiting humoral mucosal immune response while perma-nently colonizing the gut. Infect. Immun. 63, 3904–3913.
Sutherland, D.B., Suzuki, K., and Fagarasan, S. (2016). Fostering of advanced mutualism with gut microbiota by immunoglobulin A. Immunol. Rev. 270, 20–31.
Todd, J.N., Poon, W., Lyssenko, V., Groop, L., Nichols, B., Wilmot, M., Rob-son, S., Enjyoji, K., Herman, M.A., Hu, C., et al. (2015). Variation in glucose ho-meostasis traits associated with P2RX7 polymorphisms in mice and humans. J. Clin. Endocrinol. Metab. 100, E688–E696.
Turnbaugh, P.J., Ley, R.E., Mahowald, M.A., Magrini, V., Mardis, E.R., and Gordon, J.I. (2006). An obesity-associated gut microbiome with increased capacity for energy harvest. Nature 444, 1027–1031.
Wei, M., Shinkura, R., Doi, Y., Maruya, M., Fagarasan, S., and Honjo, T. (2011). Mice carrying a knock-in mutation of Aicda resulting in a defect in somatic hypermutation have impaired gut homeostasis and compromised mucosal defense. Nat. Immunol. 12, 264–270.
Cell Reports, Volume
18
Supplemental Information
T Follicular Helper Cells Promote a Bene
ficial
Gut Ecosystem for Host Metabolic Homeostasis
by Sensing Microbiota-Derived Extracellular ATP
Lisa
Perruzza,
Giorgio
Gargari,
Michele
Proietti,
Bruno
Fosso,
Anna
Maria
D'Erchia, Caterina
Elisa
Faliti,
Tanja
Rezzonico-Jost,
Daniela
Scribano,
Laura
Mauri,
Diego
Colombo,
Giovanni
Pellegrini,
Annalisa
Moregola,
Catherine
Mooser, Graziano Pesole, Mauro Nicoletti, Giuseppe Danilo Norata, Markus B.
Geuking, Kathy D. McCoy, Simone Guglielmetti, and Fabio Grassi
Figure S1. Glycogen accumulation in the liver and enhanced deterioration of glucose metabolism by high-fat
diet in P2rx7
-/-mice, Related to Figure 1 (A) PAS-stained liver sections from P2rx7
-/-and WT littermates and
statistical analysis of glycogen score (see Experimental Procedures). Relative glycogen accumulation is indicated by
presence of magenta staining within the hepatocyte cytoplasm (CLV: centrilobular veins, PV: portal veins, scale bar:
100 µm). (B) Hepatic mRNA levels of genes involved in glycolysis (GK, GAPDH), fatty acid catabolism (CPT1a,
CTP1b, PGC1α, PCGC1β), fatty acids and lipoprotein synthesis (SREBP1, FAS, SCD1, MTTP). (C) Increase in
body weight during 3 weeks of high fat diet (HFD) in WT (grey dot) and P2rx7
-/-(grey square) mice (n=5); control
mice with normal diet (ND) are also shown (left) and WAT weights at 3 wks (right). (D) GTT and ITT after 3 weeks
of HFD. Mean ± SEM are shown, Mann-Whitney (A, B and C) and Two-way ANOVA (C, D) tests were used.
*p < 0.05, **p < 0.01, ***p < 0.001.
Gck G6pcGapdh Pck1Pgc1a Pgc1b Srebp1 Fas Scd1 Cpt1a Cpt1b Mttp
**
*
**
B
A
WT
P2rx7
-/-WT P2rx7 -/-WT P2rx7 -/-CLV CLV PV PV glycogen score fold change 0 2 4 6 0 1 2 3
Gck G6pcGapdh Pck1Pgc1a Pgc1b Srebp1 Fas Scd1 Cpt1a Cpt1b Mttp
**
*
**
WT
P2rx7
-/-WT P2rx7 -/-WT P2rx7 -/-CLV CLV PV PV glycogen score fold change 0 2 4 6 0 1 2 3
Figure S1
C
D
1 3 4 0 2 5 1 3 0 2 0 10 20 30 60 90 120 5 10 15 0 0.0 0.5 1.0 1.5 2.0 2.5 ND HFD ND HFD 5 10 15 20 0 25 0 10 20 30 60 90 120**
***
***
**
WT ND WT HFD P2rx7-/- ND P2rx7-/-HFD time (day)body weight variation (g) W
A
T
weight (g)
time (min)
blood glucose (mmol/L)
time (min)
blood glucose (mmol/L)
WT P2rx7 -/-WT ND WT HFD P2rx7-/- ND P2rx7-/-HFD p= 0.0076 p= 0.0003 p= 0.045 p= 0.0089 p= 0.0124 WT ND vs WT HFD WT ND vs P2rx7 HFD -/-P2rx7 ND vs WT HFD -/-P2rx7 ND vs -/-P2rx7 HFD-/- -/-WT HFD vs P2rx7 HFD -/-p= 0.008 p= 0.005 p= 0.0014 p= 0.05 p= 0.02 WT ND vs WT HFD WT ND vs P2rx7 HFD -/-P2rx7 ND vs WT HFD -/-P2rx7 ND vs -/-P2rx7 HFD-/- -/-WT HFD vs P2rx7 HFD -/-Anova test Anova test p= 0.006 p= 0.0001 n.s. p= 0.002 p= 0.007 WT ND vs WT HFD WT ND vs P2rx7 HFD -/-P2rx7 ND vs WT HFD -/-P2rx7 ND vs -/-P2rx7 HFD-/- -/-WT HFD vs P2rx7 HFD -/-Anova test
Figure S2. Phenotype of Tfh cells
and GC B cells
at one month after transfer into
Cd3e
-/-mice,
Related to
Figure 2. (A) Quantification of Tfh cells in PPs of
Cd3e
-/-mice reconstituted with purified WT or
P2rx7
-/-Tfh cells
.
(B-D)
FACS histograms overlays of gated
WT or
P2rx7
-/-CD4 cells isolated from PPs of reconstituted
Cd3e
-/-mice
for: (B) CXCR5, Bcl6 and PD1; (C) ICOS with statistical analysis of MFI; (D) Foxp3. (E) Representative contour
plots and statistical analysis of Fas
+PNA
+GC B cells in
Cd3e
-/-mice either non-reconstituted or reconstituted with
WT or P2rx7
-/-Tfh cells.
Means ± SEM are shown, Mann-Whitney tests was used. **p < 0.01, ***p < 0.001.
** ICOS (MFI) 4000 3000 2000 1000 0 ICOS % of max WT P2rx7-/-CXCR5 Bcl6 PD1 % of max Gated on CD3+CD4+ Foxp3 % of max WT P2rx7-/-WT P2rx7-/-Tfr WT 2.1% Tfr P2rx7-/- 2% WT P2rx7 -/-Gated on CD3+CD4+ Gated on CD3+CD4+
A
B
C
0.64 7.54 17.5 Fas PNA Gated on CD19 B220+ + rec. WT Tfh rec. P2rx7 Tfh Cd3e-/- -/-0 5 10 15 20 25 * * * * * * rec. WT Cd3e-/-rec. P2rx7 -/-%GC Bcells (gated on CD 19 B220 ) + +D
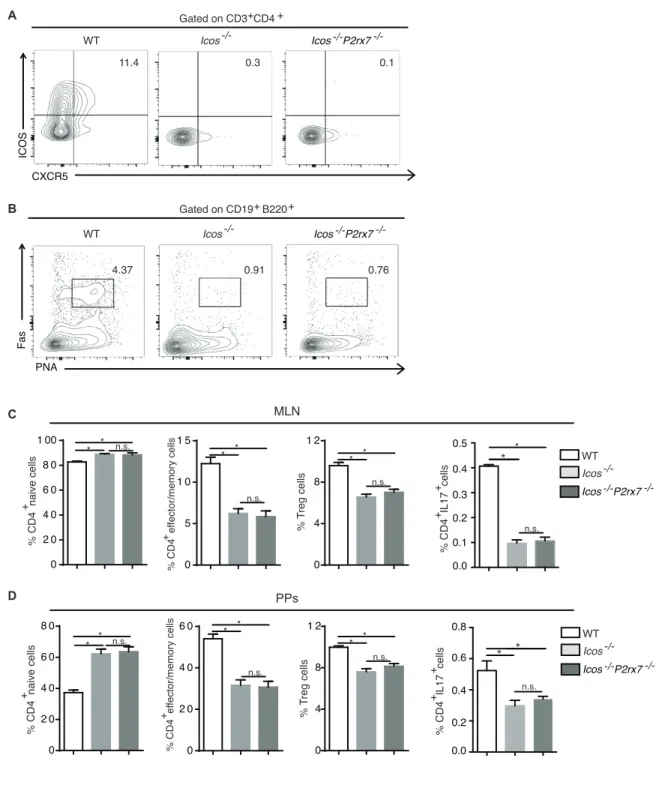
Figure S3. Phenotype of CD4 cells in Icos
-/-and Icos
-/-P2rx7
-/-mice, Related to Figure 3. (A) Contour plots of
CD3
+CD4
+cells from PPs stained for CXCR5 and ICOS. (B) Contour plots of CD19
+B220
+B cells stained for Fas
and PNA.
(C, D) Statistical analysis of naïve, effector/memory, Treg and IL-17 secreting CD4
cells in MLN (C) and
PPs (D). *p < 0.05; n.s., non-significant.
0 5 1 0 1 5 0 2 0 4 0 6 0 8 0 0 2 0 4 0 6 0 0 2 0 4 0 6 0 8 0 1 00 * 0 4 8 1 2 0 4 8 1 2 * * * * * * * * * * * A B C D MLN PPs WT -/-Icos Icos P2rx7-/- -/-11.4 0.3 0.1 CXCR5 ICOS WT Icos-/- Icos P2rx7-/- -/-PNA Fas WT Icos-/- Icos P2rx7-/- -/-Gated on CD3+CD4 + Gated on CD19 B220+ + % CD4 naive cells + % CD4 ef fector/memory cells + % T reg cells % CD4 naive cells + % CD4 ef fector/memory cells + % T reg cells n.s. n.s. n.s. n.s. n.s. n.s. 0.0 0.1 0.2 0.3 0.4 0.5 * 0.0 0.2 0.4 0.6 0.8 * * % CD4 IL17 cells + * n.s. n.s. WT -/-Icos Icos P2rx7-/- -/-4.37 0.91 0.76 + % CD4 IL17 cells + +
Figure S4. IgA coating in fecal bacteria and Phylogenetic Investigation of Communities by Reconstruction of
Unobserved States (PICRUSt), Related to Figure 3. (A) Representative contour plots of IgA coating and forward
scatter at FACS of fecal bacteria isolated from the indicated mice with statistical analysis (Mann-Whitney test,
n=10). Percentages of positive bacteria in the indicated quadrant are shown. Mean values ± SEM. ***p < 0.001, *p <
0.05, n.s., non-significant. (B) Heat map of the predicted metabolic potential of caecal microbiota samples
discriminating WT, P2rx7
-/-, Icos
-/-and Icos
-/-P2rx7
-/-mice. The relative abundances of KEEG categories have been
determined through the PICRUSt software (Langille et al., 2013). Color scale: increasing relative abundance from
white to red. Each column represents an individual mouse.
KEEG WT P2rx7-/- ICOS
-/-ICOS
-/-P2rx7
-/-Cellular Processes; Cell Growth and Death; Apoptosis
Environmental Information Processing; Membrane Transport; ABC transporters Environmental Information Processing; Membrane Transport; Bacterial secretion system Environmental Information Processing; Membrane Transport; Transporters
Environmental Information Processing; Signal Transduction; Phosphatidylinositol signaling system Environmental Information Processing; Signaling Molecules and Interaction; Cellular antigens Genetic Information Processing; Folding, Sorting and Degradation; Chaperones and folding catalysts Genetic Information Processing; Folding, Sorting and Degradation; RNA degradation
Genetic Information Processing; Replication and Repair; DNA replication Genetic Information Processing; Replication and Repair; Homologous recombination Genetic Information Processing; Transcription; Transcription factors
Genetic Information Processing; Transcription; Transcription machinery Genetic Information Processing; Translation; RNA transport Genetic Information Processing; Translation; Translation factors
Metabolism; Amino Acid Metabolism; Valine, leucine and isoleucine degradation
Metabolism; Biosynthesis of Other Sec. Metabolites; Tropane, piperidine and pyridine alkaloid biosynthesis Metabolism; Carbohydrate Metabolism; Citrate cycle (TCA cycle)
Metabolism; Carbohydrate Metabolism; Pentose phosphate pathway Metabolism; Carbohydrate Metabolism; Starch and sucrose metabolism Metabolism; Energy Metabolism; Carbon fixation pathways in prokaryotes Metabolism; Energy Metabolism; Oxidative phosphorylation Metabolism; Glycan Biosynthesis and Metabolism; Glycosyltransferases Metabolism; Glycan Biosynthesis and Metabolism; Lipopolysaccharide biosynthesis Metabolism; Glycan Biosynthesis and Metabolism; Lipopolysaccharide biosynthesis proteins Metabolism; Lipid Metabolism; Arachidonic acid metabolism
Metabolism; Lipid Metabolism; Fatty acid metabolism
Metabolism; Metabolism of Cofactors and Vitamins; Biotin metabolism
Metabolism; Metabolism of Cofactors and Vitamins; Ubiquinone and other terpenoid-quinone biosynthesis Metabolism; Metabolism of Other Amino Acids; Glutathione metabolism
Metabolism; Metabolism of Other Amino Acids; Taurine and hypotaurine metabolism Metabolism; Metabolism of Terpenoids and Polyketides; Biosynthesis of ansamycins Metabolism; Metabolism of Terpenoids and Polyketides; Geraniol degradation Metabolism; Metabolism of Terpenoids and Polyketides; Limonene and pinene degradation Metabolism; Metabolism of Terpenoids and Polyketides; Prenyltransferases
Metabolism; Xenobiotics Biodegradation and Metabolism; Caprolactam degradation Metabolism; Xenobiotics Biodegradation and Metabolism; Dioxin degradation Metabolism; Xenobiotics Biodegradation and Metabolism; Ethylbenzene degradation Metabolism; Xenobiotics Biodegradation and Metabolism; Styrene degradation Metabolism; Xenobiotics Biodegradation and Metabolism; Toluene degradation Metabolism; Xenobiotics Biodegradation and Metabolism; Xylene degradation Organismal Systems; Digestive System; Carbohydrate digestion and absorption Organismal Systems; Digestive System; Protein digestion and absorption Unclassified; Cellular Processes and Signaling; Germination
Unclassified; Cellular Processes and Signaling; Membrane and intracellular structural molecules Unclassified; Cellular Processes and Signaling; Pores ion channels
Unclassified; Genetic Information Processing; Translation proteins Unclassified; Metabolism; Amino acid metabolism
Unclassified; Metabolism; Biosynthesis and biodegradation of secondary metabolites Unclassified; Metabolism; Energy metabolism
Unclassified; Metabolism; Glycan biosynthesis and metabolism Unclassified; Metabolism; Lipid metabolism
0 100 relative abundance
Figure S4
A
B
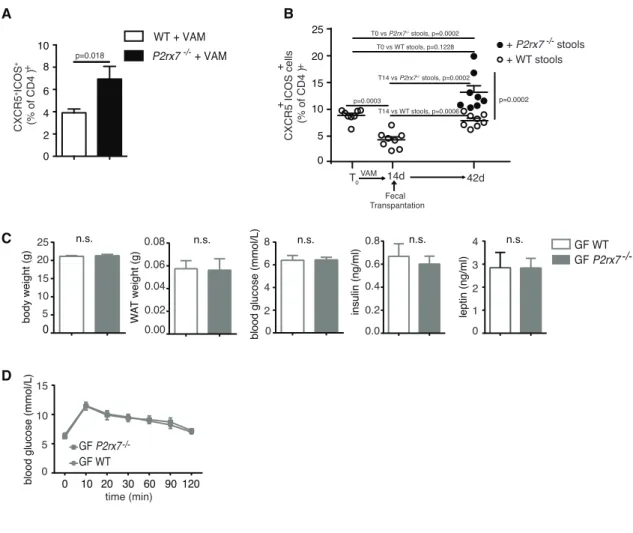
0 10 20 30 40 ****** * Rag1-/- WT P2rx7 -/-Icos-/- Icos P2rx7-/- -/-WT P2rx7 -/-25.2 22.4 0.53 18 27 IgA FSC-A % Ig A coated bacteria -/-Icos Icos P2rx7-/- -/-Rag1 n.s. n.s. n.s.Figure S5. Tfh cells frequency after administration of antibiotics and fecal transplantation, Related to Figure
4. (A) S
tatistical analysis of Tfh cells in PPs from VAM treated WT or
P2rx7
-/-mice
. (B)
Statistical analysis of Tfh
cells from PPs of WT mice 14 d after administration of VAM and 42 d after transplantation of stools isolated from
WT or P2rx7
-/-mice. (C) Body and WAT weights, blood glucose, serum insulin, leptin levels and (D) GTT in
germ-free WT and P2rx7
-/-mice at 9 wk (n=7). Means ± SEM and p values obtained with Mann-Whitney test are shown.
Two-way ANOVA for GTT was not significant.
0 2 4 6 8 10 WT + VAM P2rx7-/- + VAM
A
CXCR5 +ICOS + (% of CD4 ) + p=0.018C
D
W A T weight (g) 0.06 0.04 0.02 0.00 0.08 8 6 4 2 0 blood glucose (mmol/L) 0.6 0.4 0.2 0.0 insulin (ng/ml) 4 3 2 1 0 leptin (ng/ml) 0 10 20 30 60 90 120blood glucose (mmol/L)
GF WT GF P2rx7 -/-time (min) 0 body weight (g) 25 20 15 10 5 n.s. n.s. 15 10 5 0 n.s. 0.8 n.s. n.s. T0 Fecal Transpantation VAM 14d 42d + WT stools + P2rx7 stools p=0.0003 T0 vs P2rx7-/- stools, p=0.0002 T0 vs WT stools, p=0.1228 T14 vs P2rx7-/- stools, p=0.0002 T14 vs WT stools, p=0.0006 p=0.0002 CXCR5 ICOS cells (% of CD4 ) + + + 0 5 10 15 20 25