HAL Id: hal-00299454
https://hal.archives-ouvertes.fr/hal-00299454
Submitted on 15 Oct 2007
HAL is a multi-disciplinary open access
archive for the deposit and dissemination of
sci-entific research documents, whether they are
pub-lished or not. The documents may come from
teaching and research institutions in France or
abroad, or from public or private research centers.
L’archive ouverte pluridisciplinaire HAL, est
destinée au dépôt et à la diffusion de documents
scientifiques de niveau recherche, publiés ou non,
émanant des établissements d’enseignement et de
recherche français ou étrangers, des laboratoires
publics ou privés.
Java ? field observations after the July 2006 Java
tsunami
S. Reese, W. J. Cousins, W. L. Power, N. G. Palmer, I. G. Tejakusuma, S.
Nugrahadi
To cite this version:
S. Reese, W. J. Cousins, W. L. Power, N. G. Palmer, I. G. Tejakusuma, et al.. Tsunami vulnerability
of buildings and people in South Java ? field observations after the July 2006 Java tsunami. Natural
Hazards and Earth System Science, Copernicus Publications on behalf of the European Geosciences
Union, 2007, 7 (5), pp.573-589. �hal-00299454�
www.nat-hazards-earth-syst-sci.net/7/573/2007/ © Author(s) 2007. This work is licensed under a Creative Commons License.
and Earth
System Sciences
Tsunami vulnerability of buildings and people in South Java – field
observations after the July 2006 Java tsunami
S. Reese1, W. J. Cousins2, W. L. Power2, N. G. Palmer2, I. G. Tejakusuma3, and S. Nugrahadi3
1National Institute of Water and Atmospheric Research (NIWA), Wellington, New Zealand 2Institute of Geological and Nuclear Sciences (GNS), Lower Hutt, New Zealand
3Indonesian Agency for the Assessment and Application of Disaster Mitigation Technology (BPPT), Jakarta, Indonesia
Received: 20 June 2007 – Revised: 2 October 2007 – Accepted: 2 October 2007 – Published: 15 October 2007
Abstract. A team of scientists from New Zealand and In-donesia undertook a reconnaissance mission to the South Java area affected by the tsunami of 17 July 2006. The team used GPS-based surveying equipment to measure ground profiles and inundation depths along 17 transects across af-fected areas near the port city of Cilacap and the resort town of Pangandaran. The purpose of the work was to acquire data for calibration of models used to estimate tsunami inun-dations, casualty rates and damage levels. Additional infor-mation was gathered from interviews with eyewitnesses.
The degree of damage observed was diverse, being primar-ily dependant on water depth and the building construction type. Water depths were typically 2 to 4 m where housing was seriously damaged. Damage levels ranged from total for older brick houses, to about 50% for newer buildings with rudimentary reinforced-concrete beams and columns, to 5– 20% for engineered residential houses and multi-storey ho-tels with heavier RC columns. “Punchout” of weak brick walls was widespread. Despite various natural warning signs very few people were alerted to the impending tsunami. Hence, the death toll was significant, with average death and injury rates both being about 10% of the people exposed, for water depths of about 3 m.
1 Introduction
At 03:19 p.m. local time (08:19 UTC) on 17 July 2006 an earthquake of moment magnitude MW 7.7 occurred at a depth of 34 km, 230 km NE of Christmas Island and 260 km S of Bandung, Java, Indonesia (9.222◦S, 107.320◦E; USGS, 2006). It generated a tsunami that caused damage and ca-sualties along a 200 km segment of the south coast of Java, an area that was unaffected by the devastating Boxing Day Correspondence to: S. Reese
Tsunami in 2004. Initial media reports indicated wave
heights of 1–2 m, but it turned out that waves were more than 7 m high in some areas and travelled several hundred meters inland. The Tsunami destroyed scores of houses, restaurants and hotels. Cars, motorbikes and boats were left mangled amid fishing nets, furniture and other debris. Preliminary analysis showed that Ciamis was the worst affected District. According to WHO (2007) 668 people died, another 65 were missing and 9299 were injured.
The earthquake was of a relatively unusual type known as a “tsunami-earthquake” (Bilek and Lay, 2002); one charac-teristic of this kind of earthquake is that there is relatively little shaking at the high-frequencies that are most easily per-ceived by people, while there is nonetheless significant dis-placement of the seabed which can cause tsunamis, often of greater intensity than expected from the magnitude of the earthquake.
There are several approaches used to estimate tsunami in-tensity and magnitude (Mt). The Sieberg and Ambraseys scale (Ambraseys, 1962) as well as the Papadopoulos and Imamura (2001) scale are both descriptive and do not con-sider physical parameters like wave amplitude or height. Based on these scales the South Java Tsunami could be clas-sified as category 5 or VIII/IX1, respectively. The disadvan-tage of this descriptive method is that entire events cannot be compared because the categorization varies from region to region. Others use the maximum observed wave height (Ima-mura, 1942, 1949; Iida, 1970; Iida et al., 1967), the mean tsunami height in the coast (Soloviev, 1970) or the potential energy (Murty and Loomis, 1980) to ascertain the tsunami magnitude. Abe (1981), however, uses the maximum crest-to-trough amplitude on tide gauge records and the distance from the epicenter to the station. Applying Abe’s approach
1Category 5 stands for “very strong” and VIII/IX for “heavily
Fig. 1. Map of places visited (upper) and details of localities near Pangandaran (lower).
to the available tide gauge data2, results in a magnitude (Mt) of 8.0 for the South Java Tsunami, compared to 9.1 for the Boxing Day Tsunami (Abe, 2007)3.
A joint New Zealand/Indonesian reconnaissance team vis-ited the damage area (Fig. 1) with the aim of acquiring data for calibrating models used to estimate inundations, casualty rates and damage levels (Cousins et al., 2007).
The survey was conducted between two and three weeks after the tsunami which proved to be a good period for the survey. The data was collected during a one week field sur-vey. Team members were drawn from the Institute of Geo-logical and Nuclear Sciences (GNS Science, New Zealand), the National Institute of Water and Atmospheric Research (NIWA, New Zealand) and the Indonesian Agency for the Assessment and Application of Disaster Mitigation Tech-nology (BPPT). Two sites near the city of Cilacap (Bulape-santren and Ayah; Kebumen region) were inspected briefly. 2Tide gauge data for Christmas Island, Hillarys (WA), Broome
(WA) and Cocos Island (see http://ioc3.unesco.org/itic/contents. php?id=355).
3According to Abe (2007) the Boxing Day tsunami had a Mt of
9.1 (see http://www.eri.u-tokyo.ac.jp/topics/SUMATRA2004/abe. html).
At both there was minor damage to a few semi-permanent wooden structures from inundations depths of around 0.5 m. Most time was spent near the resort town of Pangandaran (a) because it had a high proportion of permanent buildings with much variation in size, use and design, and (b) because of the high levels of reported damage and casualties. The Pan-gandaran area had also been previously visited by the BPPT survey members who had identified it as an interesting area for studying the tsunami impact.
2 The earthquake
The earthquake occurred at 03:19 p.m. local time (08:19 UTC), and was the result of thrust faulting on the boundary between the Sunda and Australia plates. The re-gion of the plate boundary between the Australia plate and Sunda plate is seismically highly active. The Australia plate is being subducted under the Sunda plate at an estimated rate of 59 mm/year (USGS, 2006). Despite the magnitude of MW 7.7 and the shallow depth (34 km) of the epicentre, the earthquake was only weakly felt in Java, and the eyewit-nesses spoken to by the survey team in the tsunami area had generally not noticed it. There were reports of the earthquake
being more widely felt in Jakarta than in the coastal areas, possibly due to resonant oscillation of tall buildings.
The low felt intensity suggests that this was a “tsunami-earthquake” in which an unusually high proportion of the shaking energy was radiated at low-frequencies that are not easily perceived. A small but not insignificant proportion of tsunamis worldwide are caused by earthquakes of this type, and these represent a problem to emergency managers as often the local population dismisses, or fails to notice, the earthquake which usually acts as a natural warning sign of an impending tsunami. A similar earthquake occurred on 2 June 1994 further east on the same plate boundary. On that occa-sion the magnitude was MW 7.8, and the subsequent tsunami killed over 200 people.
Along the south Java coast there are seamounts being sub-ducted, a process which has been associated with the gen-eration of some tsunami-earthquakes (Bilek and Lay, 2002). It is thought that a subducted seamount acts as a point of high friction (an “asperity”) between the two plates, and the earthquake initiates here before spreading into the surround-ing area of softer materials. The rupture of the low-friction areas around the asperity tends not to produce as much high-frequency shaking as is typical of most earthquakes. Pop-ulations in areas where tsunami-earthquakes occur may not receive or act on the natural warning provided by the earth-quake, and this situation needs to be planned for.
3 Tsunami survey
3.1 Instrumentation and data collection
A dual-frequency GPS system was used to measure ground profiles and inundation depths for 17 transects across the gions of interest. The equipment consisted of two GPS re-ceivers, one a base station that remained at a fixed point throughout each of the surveys, and the other a rover that was taken to the measurement points. Provided there was suf-ficient satellite coverage, positional accuracies of ±10 mm horizontal and ±30 mm vertical were achievable. Such posi-tional accuracies, however, were relative within a particular survey and became absolute only when linked to a reference such as a reliable bench mark. We were unable to find any suitable benchmarks in the survey areas, and so had to resort to a less precise method using sea level measurements and tide tables.
The rover unit was fitted with a laser range finder (Leica GPS System 5000) that could measure distances and angles to points within a range of about 50 m. This greatly sim-plified the task of obtaining the heights of water marks and other depth evidence left by the tsunami. We estimate that accuracies of the height measurements with the laser unit were about ±30 mm. The interpretation of the depth evi-dence, however, was sometimes less precise.
Damage to buildings was assessed along the same tran-sects that were surveyed for ground profiles and tion depths. In this way the relationships between inunda-tion depth (and sometimes also current velocity, though this was usually difficult to determine) and the extent of damage to buildings of different construction types could be deter-mined.
The main tasks at each site were
– to measure ground profiles and inundation depths along multiple transects across affected areas near the port city of Cilacap and the resort town of Pangandaran, using GPS-based surveying equipment,
– to observe levels of damage to buildings, infrastructure and vegetation for various flow depths, and
– to obtain data on casualty rates.
The field data collection also included interviews with eye-witnesses and discussions with local authority staff.
3.2 Eyewitness observations
Overall, people along the coast of Java were surprised by the occurrence of the tsunami firstly because of the lack of awareness of tsunami risk in general and secondly because according to the eyewitnesses hardly anyone living at the coast felt the earthquake. However, 20–50 km further inland there was noticeable shaking.
The reports were consistent concerning the time of occur-rence of the tsunami. All people reported that the tsunami hit the coast during low tide, when the water was relatively calm. Most stated that the water first receded by about 300 to 500 m, accompanied by a sucking sound, but this was not widely interpreted as a tsunami warning sign. A roar-ing sound, like a jet engine, was then heard shortly before the tsunami arrived. The majority described a single wave, arriving in a series of 3–5 “steps” a few seconds apart and with no withdrawal between. All people reported the sec-ond “step” as being the largest. The incoming waves were black in colour and sometimes described as having a “cobra-head” appearance. Some people remembered that the incom-ing wave broke at the coast or amongst the palm trees and then surged through the developed areas, whereas others de-scribed it only as a surge rather than a breaking wave. It was reported that there was panic at the sight of the waves and accidents, causing some casualties and deaths, occurred as people fled in cars and motorbikes in inconsistent directions. In Pangandaran many fishing boats were picked up by the incoming waves and became missiles that were responsible for some of the damage to buildings. The whole process of inundation and subsequent withdraw lasted between 5 and 15 min.
0 1 2 3 4 5 6 7 8 0 100 200 300 400 Distance (m) H e ig h t (m a b o v e m e a n s e a l e v e l) Ground level Water level
Fig. 2. Ground profile and flow depths measured at Widarapayung (Transect 1).
Fig. 3. Sand deposit left by the tsunami.
3.3 Field observations
Four areas were visited by the reconnaissance team with the main focus being Pangandaran. The first visited site was Bu-lapesantren Beach (Kebumen District, 109.398◦E, 7.475◦S), a non-residential area that was home to one small brick build-ing and some semi-permanent bamboo structures. The land-scape was dominated by sand dunes and a straight, steeply sloping, beach several kilometres long. Occupants indicated
that due to the low tide level only 0.5 m of water had flowed through the shelters at the time of the tsunami. There ap-peared to be no significant tsunami damage and no reported casualties.
Pantai Logending (Kebumen District, 109.237◦E,
7.436◦S), the subsequently visited site was a recreation area on flat ground adjacent to a very gently sloping beach. One side was bounded by a 50 m wide river mouth (tidal), and the other by hills. Most of the buildings were of semi-permanent wooden (bamboo) construction and were about 0.5 m above high-tide level. Water depths appear to have reached about 1 m close to the beach, decreasing to about 0.6 m amongst the first row buildings and to 0.15–0.2 m soon after passing these structures. No casualties were reported. Damage was light to moderate.
The next site was Widarapayung (Cilacap District, 109.155◦E, 7.415◦S), a recreational area adjacent to a gently-sloping beach, with several permanent houses and of-fice buildings, several houses of semi-permanent materials, and several pools with associated toilet blocks and changing facilities, all of which were severely affected by the tsunami. The pools and permanent buildings were brick with some re-inforced concrete beams and columns. After the tsunami, only portions of a few buildings and the pools remained. The water depth around the buildings and pool area was 3.5 m. Sixty-nine people died and at least the same number of peo-ple was injured in this area.
Elevation and depth measurements (Transect 1) were taken here. The sand dune beneath the pool complex was about 150 m wide and rose to a height of about 3.5 m above mean sea level (m.s.l.) (Fig. 2). The inland edge of the dune fell sharply to paddy fields about 1 m above m.s.l., then a fur-ther 0.5 m to a sluggish river running parallel to the beach for several kilometres. The tsunami flooded the paddy fields and river, and the subsequent rapid drainage washed away the ap-proaches to a bridge across the river. Inland of the river there were more paddy fields that had been lightly inundated up to about 50 m beyond the river, giving a total inundation dis-tance of about 350 m. There were extensive deposits of fresh sand on the sand dune (measured between 14 and 25 cm; Fig. 3), often covering low vegetation and ground litter, and deposits of compacted sandy silt in the paddy fields between the dune and the river. The crops in those paddy fields had been destroyed.
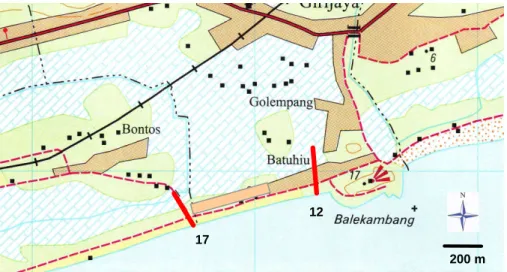
Most attention was drawn to the Pangandaran area (Ciamis District), 108.39◦E, 7.42◦S) with its diverse building struc-ture. Apart from the forested hill in the lower part of the map (Fig. 4) below, which belongs to the National Park of the peninsula, the area is low-lying and very flat. Orange denotes built-up areas, green is tree covered areas (coconut planta-tions in the upper part of the map, forest on the hilly land in the lower part) and stippled blue is paddy-field. Red lines show the locations of ground profile measurements (num-bered from east to west).
Fig. 4. Pangandaran and vicinity.
West of the Peninsula, the beaches gently sloped up to about 3 m above m.s.l. Inland of the beaches there was a fur-ther 1 m increase in elevation over about 300 m, in rural areas often followed by a sharp decrease to low-lying paddy fields. The Peninsula, which is geomorphologically a tombolo, was a little lower, being 2.5 to 3 m above m.s.l.
The west side of transect two was bounded by a gently sloping sandy beach, and the east side by a gravel/sand beach and a sea wall. Along the both sides of the peninsula there used to be rows of timber-framed shops/stalls. All that re-mained were the concrete-pad foundations. The area along transect three was dominated by a large group of relatively well-built tourist bungalows about 400 m from the hill and 25–90 m from the beach. There were no buildings between them and the coast.
There was generally heavy damage to fragile buildings up to about 50 m from the beach, decreasing to zero by about 200 m. On the Peninsula close to the hill, i.e. within about 300 m, the damage area was much narrower, presumably be-cause of sheltering provided by the hill.
Two profile measurements four and five were made along streets running nearly east-west and one at right angles to them. The area was dominated by two-storey or taller build-ings, many being accommodation, with some single-storey residential dwellings in between.
Typical construction of single-storied buildings in the southern part of the peninsula was single-thickness brick with rudimentary reinforced concrete columns and beams. The columns were often 100 mm by 100 mm with four
vertical strands of ca. 3 mm diameter wire reinforcing. Ties were few. Most roofs were steeply peaked and clad
with clay tiles. Dimensions of the bricks were about
160 mm×80 mm×40 mm. Older buildings were similar but without the reinforced columns and beams. There were rela-tively few wooden buildings. Buildings of 2 or more stories, the majority of them being hotels, often had more substan-tial columns, 200 to 300 mm in dimension, reinforced in the few cases where observation was possible with six or more smooth bars of 12 mm diameter.
Profiles six to eight were made in the Pananjung Village which is a residential area approximately 1 km west of Pan-gandaran. It appeared to have contained many older brick and wooden houses and some relatively expensive and well-constructed houses.
Transect nine was chosen because as an orphanage it con-tained different types of buildings, ranging in type from houses, dormitories, offices, classrooms, to a chapel and gymnasium.
There were three distinctly different types of building in the Cikembulan Village, approximately 5 km west of Pan-gandaran where Transects ten and eleven were located. First of all a group of three very well-made luxury houses close to the beach (ca. 100 m distant) which withstood water depths of about 4 m, secondly a village of older brick houses at 70– 200 m from the beach, water depth ca. 3.5 m and thirdly a village of modern brick houses at 300–400 m from the beach, water depth ca. 0.7 m.
17 12 200 m 17 12 200 m
Fig. 5. Map of Batuhiu area of Ciliang Village.
Ciliang Village (Transects 12 to 17) was about 13 km west of Pangandaran. The damaged area, Batuhiu, was located on a narrow sand dune between the beach and low-lying paddy fields (Fig. 5). The houses were typically 1–2 m below the crest on the slope away from beach, hence were somewhat protected from the sea by the crest. Not all had been de-stroyed.
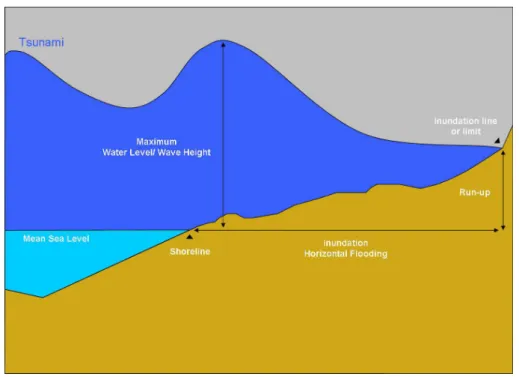
3.4 Ground profiles, inundation depths and flow velocities Ground profiles perpendicular to the coast were measured at 17 locations, and inundation depths were able to be obtained along 13 of them. The measurements of water levels were based on marks left on buildings and trees, and features de-scribed by eyewitnesses. See Fig. 6 for definitions of terms used.
Figure 2 (above) shows the ground profile and estimated flow depths at Widarapayung. Zero distance represents the edge of the sea at the time of the profile measurement. At this location the beach was about 40 m wide. Except the urban ar-eas most of the transects typically followed the same profile. There was usually a gently sloping beach, followed by rela-tively flat sand dune 200 to 400 m wide (bearing houses and trees), and then a steep descent to lower-lying paddy fields. At Widarapayung the topography was slightly different due to a river that cut through the fields.
The maximum observed water level at this site was 6.7 m, the maximum flow depth 3.75 m and the inundation limit 357 m. The water level estimate at 250 m from the coast was from an eye witness account that the water reached the handrail on a bridge across the river behind the near-shore dune. It appears unrealistically high, but might have been from a bow-wave that could have occurred during the post-tsunami flood flow down the river, rather than during the ini-tial tsunami.
Widarapayung was also surveyed by other reconnaissance teams, although their measurements might have been at slightly different locations. Lavigne et al. (2007) measured a maximum wave height of ∼5.5 m, Tsuji et al. (2007) 6.39 m and inundation up to 200 m and Widjo et al. (2006) estimated a run-up of 4.6 m and an observed horizontal inundation up to 219 m.
Our maximum observation was based on an eyewitness ac-count and could hence be a little overestimated. However, other evidence such as debris in the trees and the results of the other survey teams suggest that the maximum wave height was indeed around 6 m above m.s.l. Compared to the other survey teams we’ve identified by far the widest hori-zontal inundation (357 m) at this site. It is conceivable that the watermark resulted from the post-tsunami river flood.
The next example (Fig. 7, Transects 2 and 3) is from urban locations in Pangandaran. According to eye-witnesses the tsunami struck the western part of the peninsula first (about 16:19 LT), travelled around the tombolo, and hit the eastern part of the peninsula about 1 min later. This is consistent with Lavigne et al.’s (2007) observations. According to eye-witnesses, the water met not exactly in the middle but slightly further east around 200 m from the western beach, because of the time delay of the eastward wave. These observations are reflected in our inundation graphs which indicate a minimum water depth at about the 200 m mark.
The maximum measured wave height and flow depth for Transect 2 were 3.27 m and 0.95 m, respectively, and 5.86 m and 3.10 m for transect 3. These seem to correspond with the survey results from Lavigne et al. (2007) and Tsuji et al. (2007). Note also the very rapid decrease in water depth, from about 3 m to less than 1 m, in a distance of about 100 m. Ground profiles 12 to 17 were taken 13 km west of Pan-gandaran, in Batuhiu, which was located on a narrow sand dune between the beach and low-lying paddy fields (Fig. 5).
Fig. 6. Tsunami terms (modified after Unesco-IOC, 2006). -1 0 1 2 3 4 5 6 7 0 50 100 150 200 250 300 350 Distance (m) H e ig h t (m a b o v e m e a n s e a l e v e l) Ground level (2) Water level (2) ground level (3) water level (3) W E
Fig. 7. Ground profile and estimated water levels of transect 2 & 3 in Pangandaran. The steep drop at the right-hand (east) side is a sea wall at the eastern end.
The sand dune was about 100 m wide and had a central crest that was 5 m above mean sea level at its eastern end. From the crest the ground sloped down to about 3 m elevation, and then fell steeply to paddy fields at 2 m elevation. The houses were typically 1–2 m below the crest on the slope away from beach, hence were somewhat protected from the sea.
Profile 12 was at the easternmost end, profile 17 at the westernmost (Fig. 8). There was a steady decrease in height of the entire ground profile, by about 1 m, from east to west. Profile 12 traversed the dune then crossed paddy fields to an “island” in the paddy fields, while profile 17 traversed the coastal dune then paralleled a road through the paddy fields. The remaining profiles terminated at the inland edge of the
-1 0 1 2 3 4 5 6 7 8 0 100 200 300 Distance (m) H e ig h t (m a b o v e m e a n s e a l e v e l) Ground Level (12) Water Level (12) Water Level (13) Ground Level (13) Ground Level (14) Ground Level (15) Water Level (15) Ground Level (16) Water Level (16) Ground Level (17) range of inundation line
Fig. 8. Ground profiles 12–17 and water levels throughout Batuhiu.
coastal dune. All the measurements show the same pattern with the maximum water level around the dune crest (e.g. 7.9 m, flow depths 3.7 m along transect 16), decreasing to 2 m around the buildings and 1 m in the paddy fields. The Inun-dation line was observed to lie between 260 m (transect 12) and 180 m (transect 17).
Along the coast in the Pangandaran district the maximum water levels ranged from 3.3 m in the sheltered areas close to the Pangandaran peninsula, to 11.9 m in Pananjung Village (Fig. 9). The water height of 11.9 m (above m.s.l. – corre-sponding to a depth of about 9 m above ground level) was an observation made by the manager of a hotel in relation to palm trees between the hotel and the sea. It is much higher than all other estimates and so, assuming that it is as reliable as the others, must have been a localised phenomenon. The
0 2 4 6 8 10 12 2 2 7 6 0 0 2 2 8 1 4 2 2 3 6 6 2 0 2 3 6 6 7 0 2 3 6 7 2 0 2 3 7 3 0 0 2 4 0 9 6 1 2 4 1 6 1 0 2 4 1 6 6 0 w a te r le v e l a b o v e m s l (m )
Fig. 9. Maximum observed water levels in the Pangandaran area.
fact that other teams did not measure water levels of this di-mension in this area might argue for an overestimation. Our other levels are in line with the measurements from Lavigne et al. (2007) and Tsuji et al. (2007).
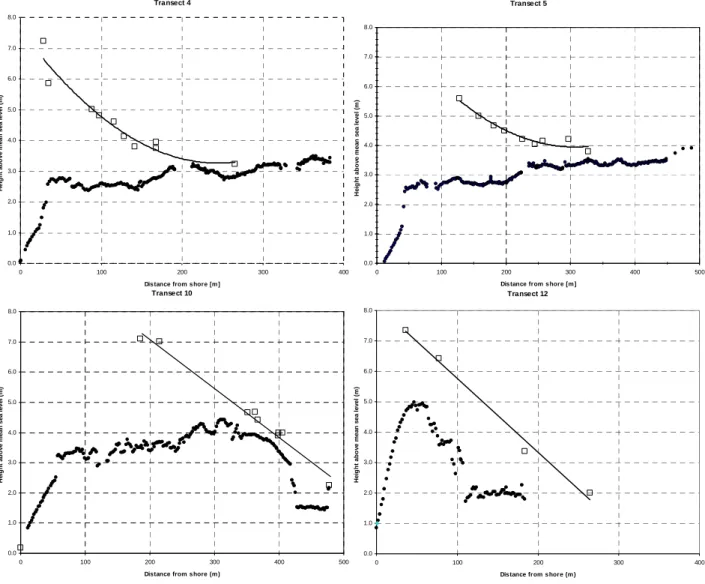
Comparing the various ground profiles and wave height measurements shows how the on-shore topography affects
the flow of the tsunami wave. By taking the wave
heights/water levels and adding a trend-line reveals two dif-ferent patterns, a linear and an exponential decay of the water level (Fig. 10).
The upper graphs show a profile with a gradually increas-ing terrain while the topography of the lower transects is characterised by a steep descent towards a lower-lying hin-terland. Looking at the trend-lines, the two top graphs illus-trate an exponential decay of the on-shore wave and is more or less what you would expect from drag (trees, buildings) over a distance inland. However, the linear trend-lines indi-cate that the dunes may have acted as a broad-crested weir, causing the waves to speed up on the down-slope side, as has also been observed during the Indian Ocean Tsunami (see EERI, 2005).
Apart from wave height or water level, flow velocity is another critical parameter. The velocity is a function of the water depth and the maximum flow velocity for a given flood
depth can be calculated by using the equation:
ν =pgh (1)
where ν is the velocity, g the gravitational acceleration and h the inundation depth (Bryant, 2001). With regards to the damage caused by a tsunami the actual velocity is of signifi-cance, not the maximum. Numerical simulation can provide the complete time history of flow velocity and depths at the site of interest. But collection of empirical data in the after-math of an event is usually not possible, unless indirect ap-proaches are used. Fritz et al. (2006) used survivor videos to conduct a cross–correlation based particle image velocimetry (PIV) analysis to determine tsunami flow velocity. In the ab-sence of such eyewitness documentation other, more simple approaches are needed.
Kamataki et al. (2006) use the head loss or pressure loss as an indication for flow velocity. Having tsunami traces at the front and the rear of building allows deriving the flow velocity by using the following equation:
u =p2g(hf − hr) (2)
Subscripts f and r distinguish between front and rear inun-dation depths. We were able to find suitable sets of front/rear depths at seven buildings in the Pangandaran area, and apply-ing the above method resulted in tsunami velocities rangapply-ing from 1.8 m/s to 4.5 m/s (Table 1). The estimates compare well with flow velocities from the Indian Ocean Tsunami. Fritz et al.’s (2006) PIV yielded flow velocities in the range of 2 to 5 m/s. Jackson et al. (2005) used three different equa-tions to estimate surge velocities in the range of 3 to 6 m/s (run-up heights 1.6 to 4.4 m), based on the movement of boulders. Kamataki et al. (2006) however have estimated much higher flow velocities of 5 m/s, 8 m/s and even 16 m/s in Banda Aceh, but in connection with inundation depths of up to 8 m.
The results of Table 1 also highlight that the highest veloc-ities do not necessarily occur close to the shore. The back-wash or densely spaced structures which channel the water have the potential to increase the velocity.
3.5 Damage observations
Tsunami waves accounted for all surveyed damage since there was no significant ground shaking from the earthquake. The structures affected by the tsunami were low-rise residen-tial, and low to medium-rise hotels/apartments and commer-cial facilities. Apart from the hydrological parameters, the level of damage was observed to be linked to the type of construction. Engineered and non-engineered buildings in the Pangandaran area were classified under four main cat-egories: timber/bamboo, brick traditional, brick traditional with reinforced-concrete (RC) columns, and RC-frame with brick infill walls. The main features of each type, and the observed levels of tsunami damage, are as follows:
Transect 4 0.0 1.0 2.0 3.0 4.0 5.0 6.0 7.0 8.0 0 100 200 300 400
Dis tance from s hore [m ]
H eig h t ab o ve m e an sea leve l ( m ) Transect 5 0.0 1.0 2.0 3.0 4.0 5.0 6.0 7.0 8.0 0 100 200 300 400 500
Dis tance from s hore [m ]
H e ig h t a b o v e m e a n s e a l e v e l (m ) Transect 10 0.0 1.0 2.0 3.0 4.0 5.0 6.0 7.0 8.0 0 100 200 300 400 500
Distance from s hore (m )
H e ig h t a b o v e m e a n s e a l e v e l (m ) Transect 12 0.0 1.0 2.0 3.0 4.0 5.0 6.0 7.0 8.0 0 100 200 300 400
Dis tance from s hore (m )
H e ig h t a b o v e m e a n s e a l e v e l (m )
Fig. 10. Decay of on-shore water level.
Table 1. Estimates of tsunami flow velocity.
Water depth Water depth Distance from Flow velocity (m/s) Max velocity (m/s) front (m) rear (m) shore (m) Eq. (2) Eq. (1)
1.05 0.89 90 1.8 3.2 3.00 2.00 165 4.4 5.4 2.23 1.30 190 4.3 4.7 2.35 1.30 175 4.5 4.8 1.92 1.75 205 1.8 4.3 1.39 1.08 210 2.4 3.7 2.71 2.16 90 3.4 5.2 3.5.1 Timber/bamboo
This type of building represents the lowest-cost type of hous-ing on Java. Construction consisted of a wood frame made
up of timber post and beams, 100 mm×100 mm posts at ca. 3 m spacing, posts attached to concrete floor/foundation with light metal tags. The walls were typically light and flexi-ble and often made of plaited coconut leaves, Buildings were
mainly single storey, both houses and shops, with shops be-ing regarded as “semi-permanent” construction.
Performance of these structures was on average poor with a few exceptions, for instance where buildings were on strong piles. In nearly all cases a flood depth of less then a metre (above floor) caused light to moderate damage, 1.5 to 2 m re-sulted in roughly 70% destroyed and 30% lightly to heavily damaged but repairable, and a depth exceeding 2 m essen-tially caused total destruction (Fig. 11).
3.5.2 Brick traditional
Many of the single story residential structures and shops were made of unreinforced brick walls on concrete foun-dations. The construction was weak, with single-skin brick walls, often plastered on both sides. The vast majority of roofs were covered with clay tiles, a few with corrugated steel sheets. The observed damage levels were not much dif-ferent from the timber/bamboo ones (Fig. 12).
The main difference was that slightly more houses re-mained upright where the flood depth was greater then 2 m. But most of them seemed not repairable apart from the con-crete floor which often remained intact.
3.5.3 Brick traditional with RC-columns
The non-engineered masonry structures had rudimentary re-inforced concrete columns, and single-skin infill brick walls
that were often plastered on both sides. Buildings
typi-cally had concrete floors and were one and two-storey houses and shops. Columns ranged from 100 mm×100 mm with 4 wires of 3 mm diameter, to 200 mm×200 mm with 4 smooth bars of 8 to 12 mm diameter at the four corners. The walls suffered punching shear failure, often with holes punched through multiple walls. Even though the reinforcement was rudimentary, it improved the performance significantly. The observed damage levels were
– <1 m of water – minor damage only,
– 1.5 to 2 m of water – light to moderate damage (re-pairable), and
– 3 to 4 m of water – serious damage, but buildings up-right and probably repairable (Fig. 13).
3.5.4 RC-frame with brick infill walls
These robust constructions were the predominant structure
type for hotels, but also some shops and houses. Often
with two or more storeys, they had brick infill walls with plastering on both sides, reinforced concrete columns of at least 200 mm×200 mm, at least 6 bars of 12 mm reinforce-ment, and concrete floors. These well-constructed and re-inforced buildings survived the tsunami with minor damage only. Damage was often limited to broken windows and
doors or failed first floor walls which could be due to the effect of debris. Observed damage levels were:
– <1 m of water – zero to light damage to ground floor, – 1.5 to 2 m of water –light to moderate damage to ground
floor (repairable), and
– 3 to 4 m of water – moderate damage to ground floor (holes punched through 1 or more walls), but building upright and repairable (Fig. 14).
Upper storeys were untouched and provided refuge to people. Overall damage levels were low (<5 to 20%).
Comparing our damage observations with results of the In-dian Ocean tsunami (e.g. Ghobarah et al., 2006; EERI, 2005; Stansfield, 2005; Goff et al., 2006; Saatcioglu et al., 2006) shows a similar trend. In both cases poorly constructed build-ings or buildbuild-ings without any reinforcement were severely damaged or totally destroyed. And in both events damage to engineered, reinforced buildings was often limited to bro-ken windows and doors and failed first floor masonry walls. Ghobarah et al. (2006) indicate a water level of 2 m+ as a threshold for extensive damage to un-reinforced (clay-brick) buildings on Sri Lanka and 4 m causing total destruction. On Java this building type often sustained 100% damage at wa-ter depths of less than 4 m. In some cases debris might have exacerbated the damage, but overall the influence of debris was far greater during the Indian Ocean Tsunami, possibly a result of several waves instead of one hitting the coast. The second and subsequent waves could have remobilised much of the rubble and debris caused by the initial one.
3.6 Damage ratios for buildings
Damage ratios, defined as (cost to repair)/(cost to replace), were derived from subjective estimates of the proportion-ate levels of damage to the four main structural elements of the damaged buildings, with the four elements being the foundation and floor (estimated 15% of total construction cost), walls (50%), roof and ceiling (15%) and fittings & services (20%). The importance of reinforcement was very clear – traditional unreinforced brick buildings were essen-tially totally destroyed (damage ratio = 1) at an inundation depth of 2 m, whereas adding minimal reinforced-concrete columns reduced the damage levels to one third of that (0.33) (Fig. 15). Multi-storey buildings with substantial reinforced-concrete frames suffered relatively very low levels of dam-age. Figure 15 shows the damage ratios for the four con-struction types. Based on these damage ratios, simplistic linear fragility curves were derived. Damage functions or fragility curves are the most common way to estimate hazard related damage because there is usually a correlation between monetary losses (or the damage state) and the hazard inten-sity, in this case inundation depth. The zero points for the straight lines are not well constrained, and probably are only
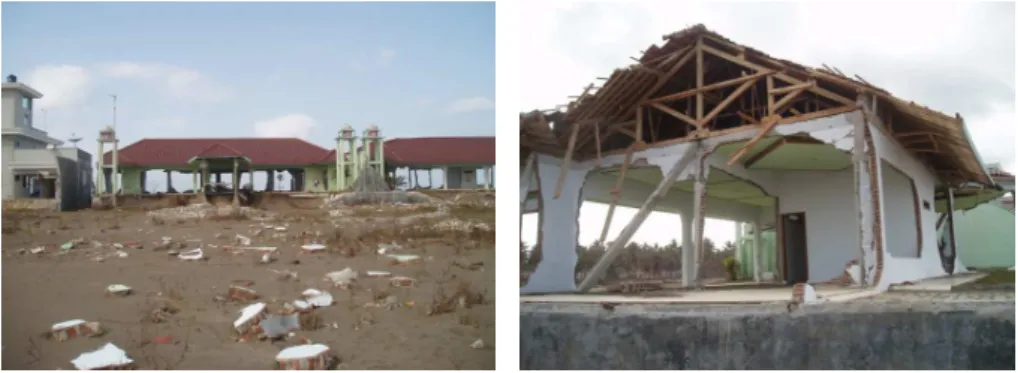
Fig. 11. Typical damage to semi-permanent wooden shops, after inundation to nearly 1 m depth (a) and to 3 m (b). Only the concrete floors remain in the right image, where prior to the tsunami there had been a row of more than 30 shops.
Fig. 12. The remains of traditional brick houses after inundation to a depth of ca. 3 m (a). There were a few partially intact (b).
applicable to the Pangandaran-type buildings which lacked soft interior linings likely to be damaged by water.
Unfortunately hardly any other tsunami fragility curves can be found in the literature. Shuto (1993, p. 205) catego-rizes the degree of building damage of five historic tsunamis4 into withstand, partially damaged and washed away. It shows that stone/brick buildings withstood inundation between 1.5 and 3 m but were totally destroyed by flow depths above 7 m. Other buildings of this type withstood water up to 5 m. Com-pared to the surveyed buildings on Java, these houses have obviously withstood much greater flood depth, which is a bit surprising, given the time of the events and the construction methods at that time. However it is not clear if the cate-gory withstood includes minor damages. In a report about the 1993 Okushiri tsunami he changed the categories into minor to complete destruction (Shuto, 1994, cited in Yeh et al., 2005, p. 5). Reinforced concrete buildings exposed to tsunami heights up to 5 m were all in the category minor damage. Masonry constructions were only lightly to moder-ately damaged at inundation up to 2.5 m and total destruction occurred at 3.5 m. These numbers are much more consistent with the damage found on Java. However, it should be noted 4Data from old documents of the 1883 Krakatau tsunami, 1908
Messina earthquake tsunami, 1933 Showa Great Sanriku tsunami, 1946 Aleutian tsunami, and the 1960 Chilean tsunami.
that there might be difference regarding construction meth-ods which can influence the resilience of a building. A more sophisticated approach has been followed by Peiris (2006) and Peiris and Pomonis (2005), who classified damage to houses into three levels, viz. Complete, Partial (unusable) and Partial (usable), then developed models for the proba-bility of equalling or exceeding a given damage level as a function of water depth. For unreinforced masonry houses in Sri Lanka, 50% were unusable after inundation to a depth of 3 m, and 90% after 5 m.
Damage to building content from the Java tsunami was usually light to moderate where no damage to the building envelope occurred. Structural damage, especially wall fail-ure was always associated with a total loss of the ground floor content.
Apart from water depth, there are several other factors influencing the degree of damage, such as flow velocity, amount of debris and whether or not a house was shielded by other buildings. The influence of flow velocity and de-bris normally cannot be measured directly, but the potential shielding of a building can easily be identified, even it has been demolished. All the inspected buildings were surveyed in this respect as well.
If we separate the survey results by shielded/exposed, a clear distinction becomes apparent. While shielded buildings
Fig. 13. Two relatively well-made apartment complexes (a) with rudimentary reinforced concrete columns (b), after inundation to a depth of 3.8 m.
Fig. 14. Well engineered beachfront villa after inundation to a depth of 3.8 m (a). Reinforcement detail is shown at right (b).
0.00 0.10 0.20 0.30 0.40 0.50 0.60 0.70 0.80 0.90 1.00 0.00 0.50 1.00 1.50 2.00 2.50 3.00 3.50 4.00 Water Depth (m above floor)
E s ti m a te d D a m a g e R a ti o
Timber and traditional brick (1-storey) Traditional brick with RC columns (1-storey) RC columns with brick infill (2+ storeys)
Fig. 15. Estimated damage ratios and fragility curves as a function of inundation depth for various types of Pangandaran buildings. The large symbols represent averages from large groups of buildings (60 or more) that had relatively uniform levels of damage, and the small symbols one to few buildings. Two of the large symbols are asso-ciated with ranges in water depth indicated by horizontal bars. A damage ratio of 0.9 indicates that the concrete floor was potentially reusable, 1.0 indicates that the area had been bulldozed clear.
0 0.1 0.2 0.3 0.4 0.5 0.6 0.7 0.8 0.9 0 1 2 3 4
Flood depth (m above floor)
E s ti m a te d d a m a g e r a ti o exposed shielded
Fig. 16. Damage ratios and fragility curves as a function of inun-dation depth and exposure for traditional brick buildings with RC columns.
made of brick with RC columns sustained damage not greater than 20%, similar exposed buildings all suffered dam-age above 40% and were exposed to greater flood depths (Fig. 16). Thus, these buildings need to be separated and accordingly two different fragility curves are required. A re-gression analysis suggests two completely different shapes. For the exposed buildings a logarithmic shape fits best while for the shielded buildings an exponential shape seems more appropriate.
Looking at the well-constructed, reinforced buildings un-der this perspective doesn’t show a clear trend as before (Fig. 17), but it is likely that this is due to the smaller number of samples. Nevertheless, a difference in the level of damage is still visible. The exposed buildings have sustained damage levels 2 to 5 times higher than the shielded ones.
3.7 Damage to infrastructure
Unlike the 2004 Indian Ocean Tsunami the Java event caused only minor damage to infrastructure and lifeline utilities. Few instances of physical damage to roads and bridges were observed, even though we traversed many kilometres of roads that had been crossed by 3 m or more of water. The most serious instance probably was due to scouring of sandy soil both by the incoming tsunami and by subsequent drainage of water along a river channel (at Widarapayung). No damaged bridges were seen. Most were either too far
inland or too elevated to have been damaged. Clean-up
costs are likely to have been significant, however. Given the amount of deposited sand up to 100 m from the coast, it is probable that the roads near the coast were covered by at least 100 mm of sand after the tsunami. The roads had been cleared by the time of our visit.
Power and phone poles withstood the tsunami well. A few leaning poles were noticed, but the vast majority were up-right and appeared completely undamaged. A few coconut palms had been uprooted, but the vast majority of palms and trees appeared unharmed.
Pangandaran Village appeared to have reticulated water network, which was functional at the time of our visit, but the outlying villages relied on a combination of wells and rain water. Bottled water was widely used for drinking. The wells close to the coast had been contaminated by salt water and were unusable. Most wells were surrounded by circular walls about 500 mm high, which in the areas of significant structural damage to houses will have been overtopped by 1 to 3 m of water.
There was no sewer system in the area. The main method of disposal was septic tank. We observed a few septic tanks that had lost their coverings, but only in locations where houses had been destroyed. In terms of damage to coastal defence facilities, there was a 3 m high sea wall along the eastern beach of the Pangandaran Peninsula. It had failed in a few places, but the damaged length probably amounted to less than 5% of the total length.
3.8 Casualties
Early reports (as of 19 July) suggested that there were about 525 deaths, 383 injuries, 273 missing and 50 756 displaced persons (UN, 2006). The earthquake was not felt in the tsunami area, so that the damage and casualties were due to tsunami alone. 0.00 0.05 0.10 0.15 0.20 0.25 0.0 1.0 2.0 3.0 4.0
Flood depth (m above floor)
E s ti m a te d d a m a g e r a ti o exposed shielded
Fig. 17. Damage ratios and fragility curves as a function of inun-dation depth and exposure for buildings made of RC columns with brick infill.
As mentioned earlier, the coastal population didn’t feel the earthquake and hence wasn’t aware of any threat. Although there were various natural warning signs, they do not appear to have alerted people to the impending tsunami. Accord-ing to eyewitness, the sea level subsided from the beach and the approaching waves caused a roaring sound but hardly anyone associated it with a tsunami. People only started reacting when the tsunami hit the coast and the people re-alized that the wave was much bigger than normal. With a tsunami travel time around 40 min it is unlikely that any warning would have reached the people even with a proper warning system in place. But the lack of awareness and peo-ple having no knowledge about general behaviour caused a significant death toll. Instead of seeking higher ground some people ran into the low lying paddy fields and drowned there. One of the aims of the reconnaissance was to determine the rates of deaths and injuries as functions of water depth and type of building. Detailed statistics on casualties and damage in the Ciamis District had been collected by the au-thorities, and were kindly provided to us. Table 2 lists the known numbers of casualties as at 3 August 2006, 17 days after the tsunami.
Even though details concerning gender and age of the vic-tims were not available, the mortality rate reportedly was highest among females and young children, which also was the case in the 2004 Indian Ocean Tsunami (Doocy et al., 2007).
The data did not include the daytime locations of people, hence we had to make assumptions as to the occupancy rates of buildings that had been seriously damaged or destroyed, and also for numbers of people outdoors and at risk. One feature of the area that was very helpful in this respect, how-ever, was the tendency for villages to be long and narrow and aligned parallel to the coast. Thus the water depth did not vary greatly across the four small villages.
Table 2. Details of casualties in the Ciamis District. The villages we visited are shaded. Blanks and dashes are as per the original data provided by the civil authorities of Ciamis Region (the Ciamis District includes the village of Pangandaran and the four other smaller villages that we studied).
Area and village Deaths Severe injuries Light injuries People missing Refugees
Kalipucang 16 6 22 0 228 Ds (1) Bagolo 12 6 11 – Ds Patra Pinggan 4 10 – Ds Pamotan – 1 – Pangandaran 183 33 85 11 1446 Ds Pangandaran 41 2 3 – Ds Pananjung 32 12 7 – Ds Wonoharjo 74 – 34 – Ds Babakan 36 19 41 – Sidamulih 65 9 13 – 447 Ds Cikembulan 52 5 – Ds Palaten 3 – Ds Sukaresik 10 4 -Parigi 31 17 99 – 176 Ds Ciliang 18 11 95 – Ds Cibenda 5 2 1 – Ds Karangbenda 1 – Ds Karangjaladri 4 4 1 – Ds Selasari 3 2 – Cijulang 16 11 2 – 115 Ds Batukaras 16 11 2 Cimerak 102 30 5 4 1150 Ds Cimerak 2 – Ds Legokjawa 52 13 – Ds Kertamukli 4 9 3 Ds Sindangsari 1 Ds Masawah 43 8 1 RSUD Banjar 1 30 – Grand Totals 414 136 226 15 3562 1Ds is Desa (Village)
As well as the casualties data of Table 2 we also were provided with numbers of damaged buildings classified by use and severity of damage (the latter being subdivided into totally damaged, badly damaged and lightly damaged). A first assumption was that all deaths and injuries occurred in or near totally and badly damaged buildings. For four vil-lages, Ciliang, Cikembulan, Wonoharjo and Pananjung, this was very reasonable assumption. In all four cases (a) the groups of houses were laid out parallel to the beach rather than perpendicular to it (Figs. 4 and 5), (b) there were large gaps between them and other groups of buildings, and (c) the level of damage was severe throughout (e.g. Fig. 12). In the case of Cikembulan there were two main groups of buildings, a destroyed group at 70–200 m from the beach, and an un-damaged group at 300–400 m. We are assuming that the ca-sualties were restricted to the destroyed group. For the other three villages the closest neighbouring groups of buildings were too far inland to have been reached by the tsunami.
In Pangandaran the band of severe damage was not more than about 50 m wide, typically comprising a row of tim-ber shops along the beach plus one or two rows of buildings separated from the shops by the beach street (Fig. 11, right image).
Given the above assumptions it is then possible to assign water depths to each of the areas of heavy to total damage using the ground profiles and water depths plotted above.
Finally it is necessary to estimate occupancy rates for the damaged buildings, for 04:00 p.m. on a Monday afternoon. Various assumptions were needed, as follows:
– houses – 2 persons per building (one woman at home cooking, plus one child)
– offices, mosques – 5 persons per building (arbitrary but reasonable numbers)
0% 10% 20% 30% 40% 50% 0 3 6 9 12
Water Depth (m above ground)
D e a th & I n ju ry R a te s (% o f p o p u la ti o n a t ri s k )
Deaths - prior events Deaths - Villages Deaths - Ciamis Region Injuries- prior events Injuries - Villages Injuries - Ciamis Region
Fig. 18. Death and injury rates as functions of water depth. The trend line is fitted to the death data from prior events (Saunders (compiler) 2006).
– schools – 5 persons per school (i.e. staff only present at 04:00 p.m.)
– hotels – 5 persons on ground floor (mostly staff) – beachside shops – 0.1 person per shop (most shops
as-sumed to be used only during holidays, hence largely vacant at the time of the tsunami, in line with observa-tions at Pantai Logering).
It was also assumed that for every three persons indoors there was one additional person outdoors and nearby (children, workers, shoppers, tourists, fishermen). Not included were paddy-field workers, because the paddy-fields were usually further from the coast than the damaged houses. Given the above assumptions, Fig. 18 compares our estimate of the death and injury rates from the five villages and the whole Ciamis district with rates from other tsunami.
It should be noted that all the data stems from an event with no warning and little awareness amongst the population so it should be regarded as the worst case scenario. Warning and the provision of sufficient information is a key aspect to decrease the number of casualties.
More recently there has been a tendency to relate casual-ties to levels of damage. The detailed Java data enabled us to analyse the data regarding a possible correlation between the death toll and the number of houses destroyed. There ap-peared to be a clear correlation between the two parameters (Fig. 19), possibly providing a way of estimating casualties when direct counts are not available.
4 Summary and conclusions
A field survey of the effects on South Java of the 17 July 2006 tsunami was conducted, with particular emphasis on studying the vulnerability of buildings and people. The sur-vey team used GPS-based sursur-veying techniques to measure
r2 = 0.8749; r=0.9354 0 50 100 150 200 250 0 10 20 30 40 50 60 70 80 Death toll N u m b e r o f d e s tr o y e d h o u s e s
Fig. 19. Death rates as functions of building destruction.
ground profiles and inundation depths across affected areas near the port city of Cilacap and the resort town of Pangan-daran. Data on the impact of the tsunami was collected by surveying the damage to buildings, measuring the displace-ment of objects, collecting official casualty data, and inter-viewing eyewitnesses. Fragility models were constructed by relating the impacts to the tsunami properties.
The level of damage to buildings was found to be princi-pally related to the maximum water depth and the construc-tion type. In the typical water depths of 2 to 4 m the level of damage varied from near total for older brick houses, to about 50% for newer buildings with rudimentary reinforced concrete beams and columns, to 5–20% for engineered res-idential houses and hotels with heavier reinforced concrete columns. “Punchout” of weak brick walls was widespread. Average death and injury rates were about 10% of the people exposed, for water depths of about 3 m.
Viewed as a whole, the town on Pangandaran was not severely damaged. While there was near total damage along the beach front where hundreds of semi-permanent shops were obliterated, once the wave encountered the robust com-mercial buildings of Pangandaran the damage levels attenu-ated rapidly. The robust buildings “sheltered” other buildings so that serious structural damage was rarely found further than 50 m from the beach in the urban area.
Acknowledgements. We thank the many people who willingly gave
assistance, advice and encouragement. Their support was greatly appreciated. We also thank the organisations who contributed to the funding of the trip, viz. FRST (New Zealand Foundation for Research Science and Technology), GNS Science, NIWA and the EQC (New Zealand Earthquake Commission). Finally, we acknowledge the efficient and helpful support of the various Indonesian institutions that we interacted with, including the Em-bassy of Indonesia in New Zealand, the Agency for the Assessment and Application of Disaster Mitigation Technology in Indonesia (BPPT), and the District Authority of Ciamis District.
Edited by: T. Glade
References
Abe, K.: Physical size of tsunamigenic earthquakes of the north-western Pacific, Phys. Earth Planet. Interiors, 27(3), 194–205, 1981.
Abe, K.: Magnitude of the Boxing Day tsunami, http://www.eri. u-tokyo.ac.jp/topics/SUMATRA2004/abe.html, 2007.
Ambraseys, N. N.: Data for the investigation of the seismic sea-waves in the eastern Mediterranean, B. Seismological Soc. Am., 52, 895–913, 1962.
Berryman, K. (Compiler): Review of Tsunami Hazard and Risk in New Zealand, Institute of Geological & Nuclear Sciences, Client Report 2005/104, Wellington, 2005.
Bilek, S. L. and Lay, T.: Tsunami earthquakes: Possibly widespread manifestations of frictional conditional stability, Geophys. Res. Lett., 29, 14, doi:10.1029/2002GL015215, 2002.
Bryant, E.: Tsunami. The Underrated Hazard, University of Cam-bridge Press, CamCam-bridge, 2001.
Cousins, W. J., Power, W. L., Palmer, N. G., Reese, S., Tejakusuma, I., and Nugrahadi, S.: South Java Tsunami of 17th July 2006, Reconnaissance Report, GNS Science Report 2006/33, 2006. Cousins, W. J., Power, W. L., Palmer, N. G., Reese, S., Tejakusuma,
I., and Nugrahadi, S.: Damage and casualties in the South Java tsunami of 17th July 2006, Proceedings, Annual Conference of the New Zealand Society for Earthquake Engineering, 30 March–1 April 2007, Palmerston North, New Zealand, Paper No. 32, 2007.
Doocy, S., Rofi, A., Moodie, C., Spring, E., Bradley, S., Burnhama, G., and Robinson, C.: Tsunami mortality in Aceh Province, In-donesia, B. World Health Organization, 85, 273–278, 2007. EERI (Earthquake Engineering Research Institute): The Great
Sumatra Earthquake and Indian Ocean Tsunami of December 26, 2004, Report #6, 2005.
Fritz, H. M., Borrero, J. C., Synolakis, C. E., and Yoo, J.: 2004 Indian Ocean tsunami flow velocity measurements from survivor videos., Geophys. Res. Lett., 33, L24605, doi:10.1029/2006GL026784, 2006.
Ghoborah, A., Saatcioglu, M., and Nistor, I.: The impact of the 26 December 2004 earthquake and tsunami on structures and infras-tructure, Eng. Struct., 28, 312–326, 2006.
Goff, J., Liu, P. L.-H., Higman, B., Morton, R., Jaffe, B. E., Fer-nando, H., Lynett, P., Fritz, H., Synolakis, C., and FerFer-nando, S.: Sri Lanka Field Survey after the December 2004 Indian Ocean Tsunami, in: The Great Sumatra Earthquakes and Indian Ocean Tsunamis of 26 December 2004 and 28 March 2005 Reconnais-sance Report, edited by: Iwan, W. D., Earthquake Spectra, Spe-cial Issue III, 22, UNESCO publishing 2006, Oakland, 155–172, 2006.
Iida, K., Cox, D. C., and Pararas-Carayannis, G.: Preliminary Cat-alog of Tsunamis Occurring in the Pacific Ocean, Data Report No. 5, Hawaii Inst. Geophys., Honolulu, 1967.
Iida, K.: The generation of tsunamis and the focal mechanism of earthquakes, in: Tsunamis in the Pacific Ocean, edited by: Adamas, W. M., Proceedings of the International Symposium on Tsunamis and Tsunami Research 1969, East-West Center Press, Honolulu, 3–18, 1970.
Imamura, A.: History of Japanese tsunamis, Kayo-No-Kagaku (Oceanography), 2, 74–80 (in Japanese), 1942.
Imamura, A.: List of tsunamis in Japan, J. Seism. Soc. Japan, 2, 23–28 (in Japanese), 1949.
ITIC (International Tsunami Information Centre, com-piler): Timeline: July 17, 2006 Java, Indonesia Earth-quake and Tsunami, http://ioc3.unesco.org/itic/files/ JavaTsunamiJul06 Timeline Final.pdf, 2006.
Jackson Jr., L. E., Barrie, J. V., Forbes, D. L., Shaw, J., Manson, G. K., and Schmidt, M.: Effects of the 26 December 2004 In-dian Ocean tsunami in the Republic of Seychelles, Report of the Canada-UNESCO Indian Ocean Tsunami Expedition, 19 January–5 February 2005, Geological Survey of Canada, Open File 4539, http://ioc.unesco.org/iosurveys/seychelles/sey1.htm, 2005.
Kamataki, T., Matsutomi, H., Murakami, Y., Nishimura, Y., Sakakiyama, T., Tanioka, Y., and Tsuji, Y.: Chapter 2, Earth-quake, Tsunami and Damage in Banda Aceh and Northern Suma-tra, www.tsunami.civil.tohoku.ac.jp/sumatra2004/C2.pdf, 2005. Lavigne, F., Gomez, C., Giffo, M., Wassmer, P., Hoebreck, C.,
Mar-diatno, D., Prioyono, J., and Paris, R.: Field observations of the 17 July 2006 Tsunami in Java, Nat. Hazards Earth Syst. Sci., 7, 177–183, 2007,
http://www.nat-hazards-earth-syst-sci.net/7/177/2007/.
Murty, T. S. and Loomis, H. G.: A new objective tsunami magnitude scale, Marine, Geodesy, 4(3), 267–282, 1980.
Papadopoulos, G. A. and Imamura, F.: A proposal for a new tsunami intensity scale, Proceedings of the International Tsunami Conference, 7–9 August 2001, Seattle, 569–577, 2001.
Peiris, N.: Vulnerability functions for tsunami loss estimation, First European Conference on Earthquake Engineering and Seismol-ogy, Geneva, Switzerland, 3–8 September 2006, Paper No. 1121, 2006.
Peiris, N. and Pomonis, A.: December 26, 2004 Indian Ocean Tsunami: Vulnerability functions for loss estimation in Sri Lanka, International Conference on Geotechnical Engineering for Disaster Mitigation & Rehabilitation, 12–13 December, Sin-gapore, edited by: Chu, J., Phoon, K. K., and Yong, K. Y., 2005 World Scientific Publishing Company, 411–416, 2005.
Saatcioglu, M., Ghobarah, A., and Nistor, I.: Performance of Struc-tures in Indonesia during the December 2004 Great Sumatra Earthquake and Indian Ocean Tsunami, in: The Great Sumatra Earthquakes and Indian Ocean Tsunamis of 26 December 2004 and 28 March 2005 Reconnaissance Report, edited by: Iwan, W. D., Earthquake Spectra, Special Issue III, 22, UNESCO publish-ing 2006, Oakland, 295–319, 2006.
Saunders, W. (Compiler): National population casualties resulting from tsunami in New Zealand, GNS Science Consultancy Report 2006/107, Institute of Geological & Nuclear Sciences, Lower Hutt, 2006.
Shuto, N.: Tsunami Intensity and Disasters, in: Tsunamis in the World, edited by: Tinti, S., Kluwer Academic Publisher, Dor-drecht, 197–216, 1993.
Soloviev, S. L.: Recurrence of tsunamis in the Pacific, in: Tsunamis in the Pacific Ocean, edited by: Adamas, W. M., Proceedings of the International Symposium on Tsunamis and Tsunami Re-search 1969, East-West Center Press, Honolulu, 149–163, 1970. Stansfield, K.: Effects of the Asian tsunami on structures, The
Structural Engineer, 83(11), 20–21, 2005.
Tsuji, Y., Han, S.-S., Fachrizal, B. W., and Gunawan, I.: Field survey of the tsunami inundated heights due to the Java Tsunami (2006/07/17) along the coast on the Indian Ocean in Java Island, http://www.eri.u-tokyo.ac.jp/tsunami/javasurvey/
index e.htm, 2006.
Unesco-IOC: Tsunami Glossary, IOC Information document No. 1221, UNESCO, Paris, 2006.
USGS (U.S. Geological Survey): Magnitude 7.7 earthquake – south of Java, Indonesia, National Earthquake Information Center, http://earthquake.usgs.gov/eqcenter/eqinthenews/2006/ usqgaf, 2006.
WHO: Java Tsunami – Situation Report # 11, 3 August 2006, http://www.searo.who.int/en/Section23/Section1108/ Section2077 11956.htm, 2007.
Widjo, K., Suranto, B., Chaeroni, C., Aprijanto, A., Zikra, T. B., and Sujantoko, S. T.: Rapid Survey on Tsunami Jawa 17 July 2006, http://ioc3.unesco.org/itic/files/tsunami-java170706 e.pdf, 2006. Yeh, H., Robertson, I., and Preuss, J.: Development of Design Guidelines for Structures that Serve as Tsunami Vertical Evacua-tion Sites, Washington Division of Geology and Earth Resources, Open File Report 2005-4, 2005.