The MIT Faculty has made this article openly available. Please share
how this access benefits you. Your story matters.
Citation
Olesen, Scott W, Thomas Gurry, and Eric J Alm. “Designing Fecal
Microbiota Transplant Trials That Account for Differences in Donor
Stool Efficacy.” Statistical Methods in Medical Research (February 9,
2017): 096228021668850.
As Published
http://dx.doi.org/10.1177/0962280216688502
Publisher
SAGE Publications
Version
Original manuscript
Citable link
http://hdl.handle.net/1721.1/117572
Terms of Use
Creative Commons Attribution-Noncommercial-Share Alike
Detailed Terms
http://creativecommons.org/licenses/by-nc-sa/4.0/
Designing fecal microbiota transplant trials that account for
differences in donor stool efficacy
Scott W. Olesen
1,*, Thomas Gurry
1,2,*, Eric J. Alm
1,2,3,†1 Department of Biological Engineering, Massachusetts Institute of Technology, Cambridge, MA, USA 2 Center for Microbiome Informatics and Therapeutics, Massachusetts Institute of Technology, Cambridge, MA, USA
3 The Broad Institute of MIT and Harvard, Cambridge, MA, USA * These authors contributed equally to this work. † ejalm@mit.edu
Abstract
1Fecal microbiota transplantation (FMT) is a highly effective intervention for patients suffering from recurrent 2
Clostridium difficile, a common hospital-acquired infection. FMT’s success as a therapy for C. difficile has 3
inspired interest in performing clinical trials that experiment with FMT as a therapy for treating conditions 4
like inflammatory bowel disease, obesity, diabetes, and Parkinson’s disease. Results from clinical trials that 5
use FMT to treat inflammatory bowel disease suggest that, for at least one condition beyond C. difficile, most 6
FMT donors produce stool that is not efficacious. The optimal strategies for identifying and using efficacious 7
donors have not been investigated. We therefore formulated an optimal Bayesian response-adaptive donor 8
selection strategy and a computationally-tractable myopic heuristic. This algorithm computes the probability 9
that a donor is efficacious by updating prior expectations about the efficacy of FMT, the placebo rate, and 10
the fraction of donors that are efficacious. In simulations designed to mimic a recent FMT clinical trial, 11
for which traditional power calculations predict ∼100% statistical power, we found that accounting for 12
differences in donor efficacy reduced the predicted statistical power to ∼9%. For these simulations, using 13
the Bayesian allocation strategy more than quadrupled the statistical power to ∼39%. We use the results of 14
of clinical endpoint that clinical trials should use to optimize their ability to detect if FMT is effective for 16
treating a condition. 17
Author Summary
18Many clinical trials test the ability of a drug to a treat a disease by comparing that drug against a placebo. 19
In fecal microbiota transplant (FMT) trials, the “drug” is stool taken from a donor. For some diseases, 20
however, the outcome of FMT seems to depend strongly on the choice of donor, suggesting that different 21
donors may be producing different “drugs”. Standard clinical trials are not designed to account for this 22
possible multiplicity of drugs. We translated data from a FMT clinical trial into a model of donor stool 23
efficacy and used this model to evaluate how different trial designs can affect a trial’s ability to measure 24
FMT’s effectiveness. We found that, if only some donors produce efficacious drugs, standard clinical trial 25
designs are likely to conclude that FMT is ineffective, thus denying patients an efficacious therapy. We 26
also show that donor allocation strategies that adaptively use the best-performing donors can dramatically 27
improve a trial’s performance. Because FMT is not well enough understood for researchers to a priori identify 28
efficacious stool, our approach makes no assumptions about the biology of the condition being treated. 29
Introduction
30Fecal microbiota transplant (FMT), the transfer of stool from a healthy person into an ill person’s gut, is a 31
highly effective treatment for recurrent Clostridium difficile infections, which kill 30,000 Americans a year. 32
Despite FMT’s efficacy and increasingly widespread use, the biological mechanism by which FMT cures the 33
infection is not fully understood [1, 2, 3, 4, 5, 6, 7]. FMT’s success in treating C. difficile has generated 34
interest in experiments to use FMT to treat other conditions related to the gut and the gut-associated 35
microbiota [8, 9]. However, emerging evidence suggests using FMT for these other diseases will be more 36
challenging. Notably, in a recent study by Moayyedi et al. [10] that used FMT to treat ulcerative colitis, 37
patients appeared to respond to stool from only one of the six stool donors. Stool from all other donors was 38
no more efficacious than placebo. These results suggest that the effectiveness of FMT can depend strongly 39
on the choice of stool donor. 40
Ideally, information collected before or during a clinical trial could be used to identify which donors 41
are efficacious. Predictions about a donor’s efficacy could be repeatedly updated depending on that donor’s 42
There is, however, not enough clinical information about this variability or biological information about the 44
mechanism by which FMT treats disease to create or validate a model for any particular indication. We 45
therefore present a general model of differences in donor stool efficacy that is not specific for any clinical 46
indication or biomarker. Using this model, we formulate an optimal, adaptive, Bayesian algorithm for 47
allocating donors. We also formulate a computationally-tractable myopic Bayesian allocation heuristic. 48
Using simulations of clinical trials, we show that differences in donor efficacy and the trial’s strategy for 49
allocating donors can have substantial impacts on the trial’s statistical power. We compare the performance 50
of non-adaptive approaches to matching patients and donors against a variation of a previously-studied 51
adaptive algorithm (a variation of the “play the winner” strategy [11, 12, 13]) and our own Bayesian heuristic. 52
We find that, in many cases, traditional non-adaptive donor allocation strategies are likely to falsely conclude 53
that FMT in inefficacious. Adaptive strategies, however, can substantially increase a trial’s ability to detect 54
if FMT is efficacious. 55
Methods
56Model of differences in donor stool efficacy
57The results of the trial reported in in Moayyedi et al. [10] raise the possibility that only some donors produce 58
stool that is efficacious for treating ulcerative colitis. We developed a simple model of differences in the 59
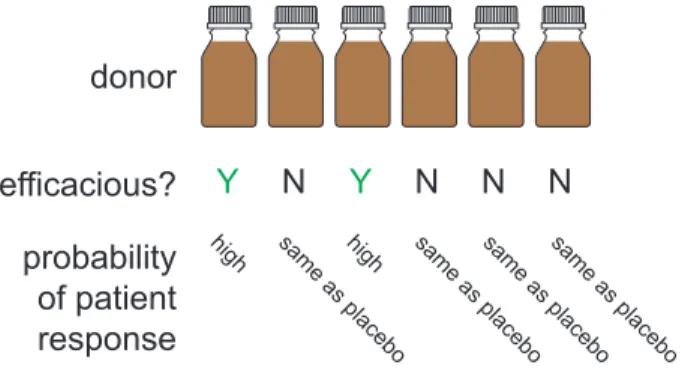
efficacy of stool produced by different donors (Fig. 1). The model we present assumes: 60
• Each donor produces efficacious stool or inefficacious stool. Stool from inefficacious donors is inert and 61
has no effect beyond placebo. 62
• All patients receive one course of treatment, each from one donor. Multiple patients can receive stool 63
from the same donor, but each patient receives stool from only one donor. 64
• Patient responses are dichotomous: a patient either responds to treatment (i.e., reaches a positive 65
clinical endpoint) or not. 66
• Patients are exchangeable. 67
These assumptions mean that the model has only three parameters: 68
1. the placebo rate pplacebo, 69
donor
efficacious?
Y
N
Y
N
N
N
probability
of patient
response
high sam e as place bo high sam e as place bo sam e as place bo sam e as place boFigure 1: The model of differences in donor efficacy. In the model, donors are efficacious or not. Patients respond to FMT from an efficacious stool donor with probability peff. An FMT from an inefficacious stool
donor is considered identical to a placebo, i.e., patients respond with probability pplacebo. The fraction of
donors in the general donor population that are efficacious is feff.
Relevant trial result Parameter Estimated value
2 of 37 patients in placebo arm achieve remission pplacebo 2/37 = 0.054
1 of 6 donors appeared efficacious feff 1/6 = 0.17
7 of 18 patients allocated to efficacious donor achieved remission peff 7/18 = 0.39
Table 1: Estimates of model parameters from the data from an ulcerative colitis clinical trial. These clinical data are drawn from the results of the trial reported in Moayyedi et al. [10], which used FMT to treat ulcerative colitis.
3. the frequency feff of efficacious donors among the general donor population. 71
These parameters can be easily related to results from clinical trials. A conversion between the clinical trial 72
results from Moayyedi et al. [10] and the parameters in the model are shown in Table 1. 73
Further details about the model, its extensibility, and techniques for drawing random variates of its 74
parameters are in the SI Text. 75
Donor allocation strategies
76In simulations of clinical trials, four different strategies for choosing which donor to use with which patient 77
were evaluated. The first two strategies, block allocation and random allocation, are non-adaptive, that 78
is, the allocation decisions about which donor will be used for which patient can be made before the trial 79
begins. The other two strategies, a randomized urn-based strategy and a myopic Bayesian strategy, are 80
response-adaptive strategies, that is, the allocation about which donor to use for a patient will depend on 81
Block & random assignment
(non-adaptive)
donors
patients
Urn-based & Bayesian assignment
(adaptive)
assign
patient 1;
patient
responds
assign
patient 2;
patient does
not respond
change donor;
assign
patient 3
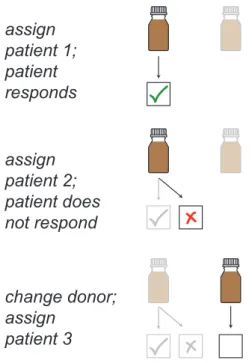
Figure 2: Adaptive donor allocations change depending on the trial’s progress. In a non-adaptive allocation, the patients and donors can be matched before any patient is treated. In an adaptive allocation, the outcome of previous patients’ treatments can affect the allocation of future patients. For example, if a donor is used for a patient who responds to treatment, that donor might be used again. If the patient does not respond, a different donor might be used.
Block allocation In a block allocation, patients are evenly allocated to donors. For example, if there 83
are 30 patients and 6 donors, the first 5 patients are treated with the first donor, the second 5 patients are 84
treated with the second donor, etc. (In clinical practice, patients would be randomized within the blocks.) 85
Random allocation In a random allocation, patients are allocated to donors at random. (On average, 86
random allocations are similar to block allocations, so these two types of non-adaptive simulation yield 87
similar results.) 88
Urn-based allocation Our urn-based allocation strategy is a variation on the “play-the-winner” strategies 89
designed and studied as an ethical [14] and statistically-rigorous way to decide how to allocate patients to a 90
treatment arm when a trial includes more than one treatment arm [15, 16, 17]. In this study, we used the 91
generalized P´olya’s urn [18] with parameters w = 1, α = 3, β = 0, and without replacing the drawn ball. 92
Adaptive allocation strategies, like this urn-based approach, are designed to reduce the probability of a 93
Type II error (i.e., to avoid concluding that FMT is ineffective when it actually is effective) without increasing 94
the probability of a Type I error (i.e., without increasing the chance that a trial will conclude that FMT is 95
effective when it is actually ineffective). If FMT is effective for some donors, this urn-based allocation should 96
allocate more patients to efficacious donors. If FMT is ineffective (i.e., there are no efficacious donors), then 97
an adaptive strategy should not increase the risk of a Type I error, since any and all allocation strategies 98
will allocate only inefficacious donors. 99
Myopic Bayesian strategy The urn-based approach is randomized, which is desirable in clinical trials 100
because it can reduce certain kinds of bias [11]. However, random approaches are not guaranteed to make the 101
best choices about donor allocation. We therefore designed a myopic Bayesian deterministic donor allocation 102
strategy that uses the results collected during a simulated trial to make the best choice about how to allocate 103
the next patient, similar to other “bandit” problems [19]. Unless noted, the myopic Bayesian strategy was 104
initialized with a uniform prior on the model parameters. 105
Computing the posterior predictive probabilities in the myopic Bayesian allocation strategy requires a 106
computationally-intensive numerical integration. The value of the integral was computed using Monte Carlo 107
integration with Suave (SUbregion-Adaptive VEgas), an importance sampling method combined with a 108
globally adaptive subdivision strategy. Sampling for this integral was performed with Sobol pseudo-random 109
numbers. The integrator was implemented in C++ using the Cuba package [20]. Wrappers for the integration 110
optimize computational run time [21]. 112
Details about the optimal Bayesian strategy and the derivation of the posterior predictive probabilities 113
are in the SI Text. 114
Simulated clinical trials
115The expected fraction of patients allocated to efficacious donors and the the statistical power of clinical trials 116
using different donor allocation strategies were estimated using simulated clinical trials. In each simulation, 117
the three model parameters (pplacebo, peff, feff) and the number of patients in the trial were fixed. For each 118
combination of the trial parameters, 10,000 lists of 6 donors each were randomly generated. Donors were 119
designated as efficacious or not efficacious by random chance according to the frequency of efficacious donors 120
feff. The same donor lists were used for simulations for each of the allocation strategies. 121
In one set of simulations, the number of donors was varied among 1, 3, 5, 10, 15, and 30 donors. For 122
those simulations, lists of 30 donors were generated for each parameter set and trial iteration. The lists were 123
truncated for the simulations using less than 30 donors. 124
For each allocation strategy and donor list, a trial was simulated. In each simulation, a patient allocated 125
to an efficacious donor responds to the treatment with probability peff. Patients allocated to inefficacious 126
donors or to the placebo arm respond with probability pplacebo. For adaptive allocations, the outcomes from 127
all the previous patients treatment were determined before the donor for the next patient was selected. An 128
equal number of patients was allocated to the treatment and placebo arms. 129
Clinically-relevant parameter values Simulations were performed for all combinations of parameter 130
values selected to reflect clinically-relevant possibilities: 131
• The placebo rate pplacebois either 0.05 (a low placebo rate consistent with stringent, objective outcomes; 132
e.g., endoscopic Mayo score [10, 22]) or 0.25 (a high placebo rate consistent with self-reported, subjective 133
outcomes [23, 24]). 134
• The efficacy peff of efficacious donors is either 0.4 (similar to the value in Table 1) or 0.95 (efficacy of 135
FMT to treat C. difficile infection). 136
• The frequency feff of efficacious donors is either 0.15 (similar to the value in Table 1) or 0.9 (reflective 137
of the fact that almost any well-screened donor produces stool that can successfully treat C. difficile 138
• The number of patients in each of the treatment and control arms is 15, 30, or 60, corresponding to a 140
range of patient numbers typical for Phase I and small Phase II clinical trials. 141
Of these combinations, the set of values most similar to the one in Table 1 is pplacebo = 0.05, peff = 0.4, 142
feff = 0.15, Npatients= 30. 143
Computing statistical power After determining the outcome of all the patients in the trial, the p-value 144
of a one-sided Fisher’s exact test (asserting that the response rate in the treatment arm was greater) was 145
calculated. The proportion of simulations that produced p < 0.05 was the estimate of the statistical power 146
for that allocation strategy under those trial parameters. Confidence intervals were calculated using the 147
method of Clopper and Pearson [25]. Values are rounded to two or three significant digits. 148
Results
149Trials using adaptive strategies allocate more patients to efficacious donors
150The purpose of adaptive donor allocation strategies is to identify and use efficacious donors. We therefore 151
expected that simulated trials that use adaptive strategies would allocate more patients to efficacious donors 152
(compared to simulated trials that used the block or random donor allocation strategies). 153
For every parameter set simulated, the average fraction of patients allocated to efficacious donors was 154
greater in the adaptive strategies (urn-based and myopic Bayesian) than in the non-adaptive strategies (block 155
and random; Table S1). The two non-adaptive allocation strategies performed almost identically: for each 156
parameter set, their results differed by less than 1 percentage point. The two adaptive strategies performed 157
similarly: for half of the parameter sets, their results differed by less than 2 percentage points. In the 158
remaining parameter sets, their results varied by between 2 and 9 percentage points. 159
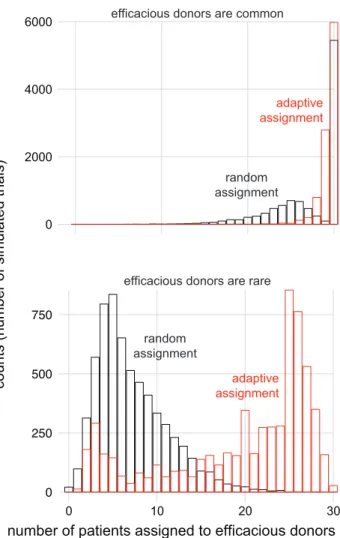
When efficacious donors are common (feff = 0.9), the adaptive and non-adaptive strategies performed 160
similarly (Fig. 3). In other cases, the performance of the two strategies differed substantially. For example, 161
for the parameterization most similar to the one in Table 1, the random strategy allocated 15% of patients 162
to efficacious donors while the myopic Bayesian strategy allocated 41% of patients to efficacious donors. 163
Trials using adaptive allocation have higher statistical power
164Because trials that used the adaptive donor allocation strategies allocated more patients to efficacious donors 165
0 250 500 750
efficacious donors are common
efficacious donors are rare
0 10 20 30
number of patients assigned to efficacious donors
co u n ts (n u mb e r o f si m u la te d t ri a ls) 0 2000 4000 6000 adaptive assignment random assignment adaptive assignment random assignment
Figure 3: Adaptive strategy allocates more patients to efficacious donors. (top) For the parameterization most similar to the one in Table 1 (top), the adaptive strategy (red) allocated more patients to efficacious donors than random allocation (black) did. When efficacious donors are common (bottom; same parameters as top but with feff = 0.9), the two strategies allocate similar numbers of patients to efficacious donors. For
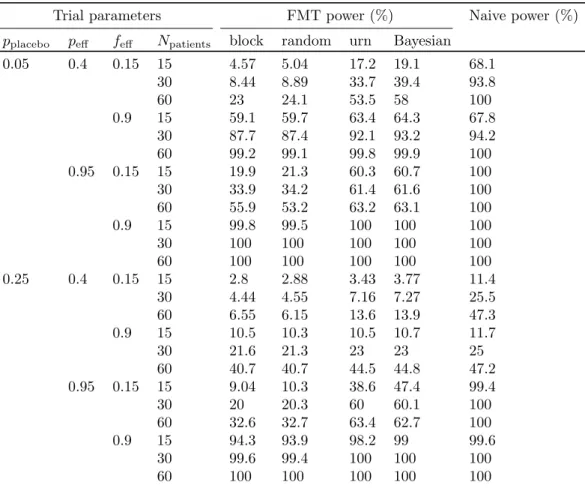
Trial parameters FMT power (%) Naive power (%) pplacebo peff feff Npatients block random urn Bayesian
0.05 0.4 0.15 15 4.57 5.04 17.2 19.1 68.1 30 8.44 8.89 33.7 39.4 93.8 60 23 24.1 53.5 58 100 0.9 15 59.1 59.7 63.4 64.3 67.8 30 87.7 87.4 92.1 93.2 94.2 60 99.2 99.1 99.8 99.9 100 0.95 0.15 15 19.9 21.3 60.3 60.7 100 30 33.9 34.2 61.4 61.6 100 60 55.9 53.2 63.2 63.1 100 0.9 15 99.8 99.5 100 100 100 30 100 100 100 100 100 60 100 100 100 100 100 0.25 0.4 0.15 15 2.8 2.88 3.43 3.77 11.4 30 4.44 4.55 7.16 7.27 25.5 60 6.55 6.15 13.6 13.9 47.3 0.9 15 10.5 10.3 10.5 10.7 11.7 30 21.6 21.3 23 23 25 60 40.7 40.7 44.5 44.8 47.2 0.95 0.15 15 9.04 10.3 38.6 47.4 99.4 30 20 20.3 60 60.1 100 60 32.6 32.7 63.4 62.7 100 0.9 15 94.3 93.9 98.2 99 99.6 30 99.6 99.4 100 100 100 60 100 100 100 100 100
Table 2: Adaptive strategies yield clinical trials with higher statistical power. “FMT power” is the power computed by simulating the results of trials that would occur if the frequency of efficacious donors if feff.
“Naive power” is the power computed in the situation in which all donors are efficacious (i.e., feff = 1.0).
All 95% confidence intervals on these values are within 1 percentage point of the reported value and are not shown.
have greater statistical power. 167
The adaptive strategies consistently yielded higher statistical powers than the non-adaptive strategies 168
(Table 2). When efficacious donors are rare, the performance gap is larger. For example, for the parame- 169
terization most similar to the one in Table 1, a trial that uses random allocation is expected to have 9% 170
power, while the myopic Bayesian strategy can deliver 39% power. The gap in performance is smallest when 171
selecting a donor at random is likely to yield an efficacious donor: among the trials with feff = 0.9, the 172
adaptive and non-adaptive statistical powers differed by less than 6 percentage points. 173
Low statistical powers when feff is small are likely due to the fact that if all the available donors are not 174
efficacious, then no allocation strategy should make a trial achieve significance. For example, if only 15% 175
then we expect that 38% of trials will have no good donors (using the binomial distribution function). We 177
therefore separately analyzed the simulated trials in which no donors were efficacious and the simulated trials 178
in which at least one donor was efficacious (Table S2). When no donors are efficacious, trials with adaptive 179
or non-adaptive strategies have ∼0% power. Among trials with at least one efficacious donor, the difference 180
in statistical power between adaptive and non-adaptive strategies is greater than the difference computed 181
using the results of all trials. 182
Conversely, the power computed in traditional calculations that do not account for differences in donor 183
efficacy (i.e., that assume that all donors are efficacious, or equivalently feff = 1.0) is, in many cases, 184
substantially higher than the power computed when accounting for differences in donor efficacy (Table 2, 185
column “Naive powers”). For example, for the parameter set most similar to the one in Table 1, the naive 186
calculation predicts 94% power, but the calculation that accounts for differences in donor efficacy predicts 187
only 9% power for non-adaptive allocation strategies. The differences between the powers computed by the 188
naive method and our approach is largest when feff is small. 189
Performance of adaptive strategies depend on their parameterization
190In these simulations, we varied the actual values of pplacebo and peff but we always initialized the adaptive 191
algorithms the same ways. To determine the sensitivity of the adaptive allocation algorithms’ performance to 192
their initialization, we simulated trials in which the actual model parameters were fixed but the algorithms’ 193
initializations varied (Table S3 and Table S4). The myopic Bayesian algorithm’s performance was mostly 194
robust to the parameterization of its prior distribution except when the prior was strong and inaccurate. 195
Accurate priors, weak priors, and uniform priors provide comparable performance. In contrast, the urn 196
algorithm delivered widely varying powers, from 15% to 40%, depending on its parameterization. 197
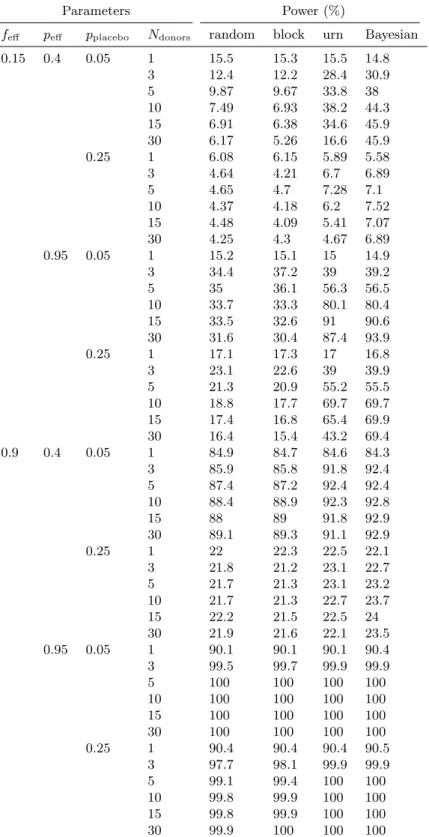
Increasing the number of available donors benefits the adaptive Bayesian strategy
198Increasing the number of available donors increases the probability that at least one of them will be efficacious. 199
We therefore determined, for each donor allocation strategy, the number of available donors that optimized 200
the trial’s expected power. Simulations showed that increasing the size of the donor “pool” almost always 201
increased the power of trials using the myopic Bayesian donor allocation but, depending on the parameter 202
set, could increase or decrease the power of trials using other allocation strategies (Table S5). 203
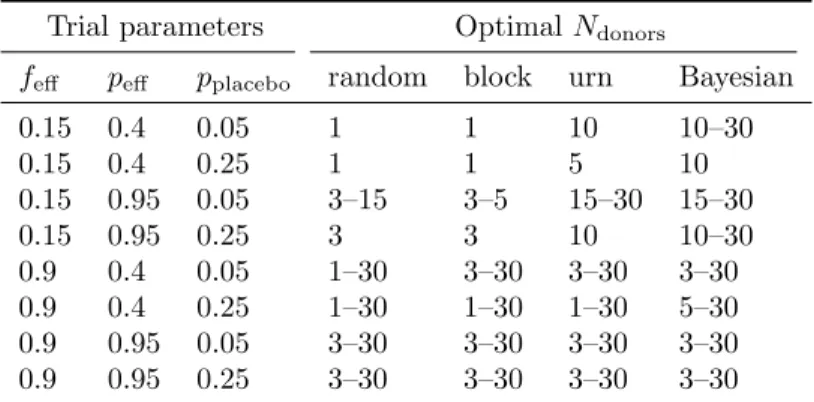
Table 3 shows how donor selection strategy and model parameter values affects the optimal number 204
Trial parameters Optimal Ndonors
feff peff pplacebo random block urn Bayesian
0.15 0.4 0.05 1 1 10 10–30 0.15 0.4 0.25 1 1 5 10 0.15 0.95 0.05 3–15 3–5 15–30 15–30 0.15 0.95 0.25 3 3 10 10–30 0.9 0.4 0.05 1–30 3–30 3–30 3–30 0.9 0.4 0.25 1–30 1–30 1–30 5–30 0.9 0.95 0.05 3–30 3–30 3–30 3–30 0.9 0.95 0.25 3–30 3–30 3–30 3–30
Table 3: The optimal number of donors varies by donor selection strategy and model parameter values. For each parameter value, trials were simulated using 1, 3, 5, 10, 15, and 30 donors. (The number of patients was fixed at 30.) The number of donors that optimized the expected power was identified. If multiple numbers of donors yielded powers within 0.05 of the optimal value, all those numbers are reported as a range.
(peff = 0.4), the non-adaptive strategies perform optimally when only one donor is used. In other words, 206
when using non-adaptive strategies in this parameter regime, it is wiser to take the 15% chance of picking a 207
single efficacious donor than it is to distribute patients across many donors, allotting around 15% of them to 208
efficacious donors. In contrast, the myopic Bayesian donor allocation almost always benefits from a larger 209
donor pool. 210
Discussion
211Model limitations
212We chose to use a simple model for a simple use case because, in the absence of data about the treatment 213
histories of hundreds of patients using dozens of donors, we do not believe that more complicated models 214
will be more useful to aiding trial design. The model’s greatest weakness is that it cannot be validated, 215
but it is exactly the model’s purpose to improve the probability of collecting the kind of information that 216
could validate or invalidate it. In light of the dearth of data, we developed a simple model, and it could be 217
that the simplifications we made limit the model’s validity. For example, the model assumes that each donor 218
produces efficacious stool or inefficacious stool (when in fact there is probably day-to-day and donor-to-donor 219
variation in stool efficacy) and that all patients receive one course of treatment (while, say, patients who do 220
not respond to a first treatment might be treated with stool from a different donor). 221
In our simulations, we assumed that the outcome from all the previous patients treatments are known 222
method can still be used for overlapping patients [18], but the myopic Bayesian method would require some 224
modification. For example, clinicians could choose to consult the myopic Bayesian’s rankings of donors inter- 225
mittently, or patients could be allocated in proportion to the predicted probabilities of successful treatments. 226
Differences in donor efficacy should be accounted for in trial design
227Our results entail recommendations to clinicians. First, the powers we computed here are, in many cases, 228
well below the powers computed assuming that all donors are efficacious. We therefore encourage researchers 229
to consult our predictions about statistical power when deciding on the size of their trials. 230
Second, a high placebo rate can substantially decrease the statistical power of an FMT trial. We therefore 231
encourage researchers to use the most stringent outcome measurement possible (e.g., an endoscopic Mayo 232
score for inflammatory bowel disease). 233
Third, adaptive donor allocation strategies consistently delivered higher statistical power than traditional, 234
non-adaptive approaches. We therefore recommend that researchers use such an adaptive strategy. The urn- 235
based strategy has the advantages that similar response-adaptive strategies may be familiar to clinicians, 236
it is randomized, and it is simple to implement. However, an urn-based strategy needs to be carefully 237
parameterized: a badly-parameterized urn-based strategy performs similarly to random allocation. The 238
adaptive Bayesian donor allocation algorithm performs well even when using the “default” settings (a uniform 239
prior) but is complex and deterministic. To fully leverage this strategy, a clinician would need to consult the 240
algorithm’s output after every patient outcome and follow the algorithm’s deterministic instructions, which 241
might introduce bias. 242
Fourth, adaptive algorithms benefit from having access to a “bank” of 10 or more donors. Researchers 243
hoping to achieve the full benefits of adaptive donor selection must be prepared to change donors multiple 244
times during the trial. 245
Finally, researchers reporting about FMT trials should include information about the donors, notably 246
how many donors were used and what proportion of patients alloted to each donor responded to treatment. 247
This information will help future researchers account for differences in donor efficacy. 248
Future research may identify mechanistic explanations of FMT’s efficacy
249The adaptive allocation strategies we described here have a narrow aim: to increase the number of successful 250
patient outcomes in a trial. In theory, an adaptive trial design is capable of more. For example, if it were 251
species in the donor’s stool, then an adaptive trial design could recommend donor choices that aim to identify 253
that critical species. 254
We did not pursue a hypothesis-centric approach because we believe it is premature. Even the mechanism 255
by which FMT treats C. difficile, the most well-studied case, remains unclear. We expect that strong 256
hypotheses about mechanism will come from retroactive comparison of efficacious vs. inefficacious stool 257
after clinical trials have definitively show that FMT is effective for treating some disease. Our study aims 258
to do exactly this. Until then, we hope that our results about adaptive donor allocation help more patients 259
benefit from FMT and will help clinicians identify those conditions that FMT can treat. 260
Acknowledgments
261This material is based on work supported by the National Science Foundation Graduate Research Fellowship 262
under Grant No. 1122374 and by the Center for Microbiome Informatics and Therapeutics at MIT. 263
References
264[1] Cohen SH, Gerding DN, Johnson S, Kelly CP, Loo VG, McDonald LC, et al. Clinical Practice Guide- 265
lines for Clostridium difficile Infection in Adults. Infect Control Hosp Epidemiol. 2010;31(5):431–455. 266
doi:10.1086/651706. 267
[2] van Nood E, Vrieze A, Nieuwdorp M, Fuentes S, Zoetendal EG, de Vos WM, et al. Duodenal 268
Infusion of Donor Feces for Recurrent Clostridium difficile. N Engl J Med. 2013;368(5):407–415. 269
doi:10.1056/NEJMoa1205037. 270
[3] Kelly CP, LaMont JT. Clostridium difficile – More Difficult Than Ever. N Engl J Med. 271
2008;359(18):1932–1940. doi:10.1056/NEJMra0707500. 272
[4] Alang N, Kelly CR. Weight Gain After Fecal Microbiota Transplantation. Open Forum Infect Dis. 273
2015;2(1). doi:10.1093/ofid/ofv004. 274
[5] Li SS, Zhu A, Benes V, Costea PI, Hercog R, Hildebrand F, et al. Durable coexistence of 275
donor and recipient strains after fecal microbiota transplantation. Science. 2016;352(6285):586–589. 276
[6] Kassam Z, Lee CH, Yuan Y, Hunt RH. Fecal Microbiota Transplantation for Clostridium diffi- 278
cile Infection: Systematic Review and Meta-Analysis. Am J Gastroenterol. 2013;108(4):500–508. 279
doi:10.1038/ajg.2013.59. 280
[7] Khoruts A, Sadowsky MJ. Understanding the mechanisms of faecal microbiota transplantation. Nat 281
Rev Gastroenterol Hepatol. 2016;doi:10.1038/nrgastro.2016.98. 282
[8] Smits LP, Bouter KEC, de Vos WM, Borody TJ, Nieuwdorp M. Therapeutic Potential of Fecal Micro- 283
biota Transplantation. Gastroenterology. 2013;145(5):946–953. doi:10.1053/j.gastro.2013.08.058. 284
[9] Sadowsky MJ, Khoruts A. Faecal microbiota transplantation is promising but not a panacea. Nat 285
Microbiol. 2016;1. doi:10.1038/nmicrobiol.2016.15. 286
[10] Moayyedi P, Surette MG, Kim PT, Libertucci J, Wolfe M, Onischi C, et al. Fecal Microbiota Trans- 287
plantation Induces Remission in Patients With Active Ulcerative Colitis in a Randomized Controlled 288
Trial. Gastroenterology. 2015;149(1):102–109.e6. doi:10.1053/j.gastro.2015.04.001. 289
[11] Cook TD, DeMets DL. Introduction to Statistical Methods for Clinical Trials. Chapman & Hall/CRC; 290
2008. 291
[12] Bartlett RH, Roloff DW, Cornell RG, Andrews AF, Dillon PW, Zwischenberger JB. Extracorporeal Cir- 292
culation in Neonatal Respiratory Failure: A Prospective Randomized Study. Pediatrics. 1985;76(4):479– 293
487. 294
[13] Chow SC, Chang M. Adaptive Methods in Clinical Trials. Chapman & Hall/CRC; 2007. 295
[14] Hung JHM, O’Neill RT, Wang SJ, Lawrence J. A Regulatory View of Adaptive/Flexible Clinical Trial 296
Design. Biom J. 2006;48(4):565–573. doi:10.1002/bimj.200610229. 297
[15] Wei LJ, Smythe RT, Lin DY, Park TS. Statistical Inference with Data-Dependent Treatment Allocation 298
Rules. J Am Stat Assoc. 1990;85(409):156–162. doi:10.1080/01621459.1990.10475319. 299
[16] Wei LJ, Durham S. The Randomized Play-the-Winner Rule in Medical Trials. J Am Stat Assoc. 300
1978;73(364):840–843. doi:10.1080/01621459.1978.10480109. 301
[17] Zelen M. Play the Winner Rule and the Controlled Clinical Trial. J Am Stat Assoc. 1969;64(325):131– 302
146. doi:10.1080/01621459.1969.10500959. 303
[19] Berry DA, Fristedt B. Bandit Problems: Sequential Allocation of Experiments. Springer Netherlands; 305
1985. 306
[20] Hahn T. Cuba – a library for multidimensional numerical integration. Comput Phys Commun. 307
2005;168(2):78–95. doi:10.1016/j.cpc.2005.01.010. 308
[21] Tange O. GNU Parallel – The Command-Line Power Tool. ;login: The USENIX Magazine. 309
2011;36(1):42–47. doi:10.5281/zenodo.16303. 310
[22] Rossen NG, Fuentes S, van der Spek MJ, Tijssen JG, Hartman JHA, Duflou A, et al. Findings From a 311
Randomized Controlled Trial of Fecal Transplantation for Patients With Ulcerative Colitis. Gastroen- 312
terology. 2015;149(1):110–118. doi:10.1053/j.gastro.2015.03.045. 313
[23] Su C, Lichtenstein GR, Krok K, Brensinger CM, Lewis JD. A meta-analysis of the placebo rates of 314
remission and response in clinical trials of active Crohn’s disease. Gastroenterology. 2004;126(5):1257– 315
1269. doi:10.1053/j.gastro.2004.01.024. 316
[24] Su C, Lewis JD, Goldberg B, Brensinger C, Lichtenstein GR. A Meta-Analysis of the Placebo 317
Rates of Remission and Response in Clinical Trials of Active Ulcerative Colitis. Gastroenterology. 318
2007;132(2):516–526. doi:10.1053/j.gastro.2006.12.037. 319
[25] Clopper CJ, Pearson ES. The use of confidence or fiducial limits illustrated in the case of the binomial. 320
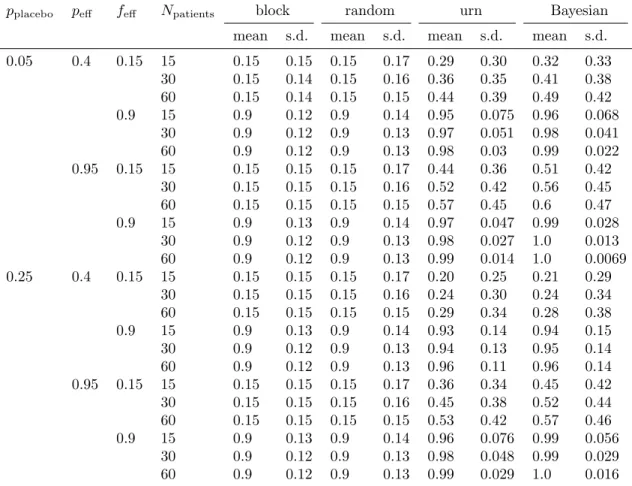
Supplementary Tables
pplacebo peff feff Npatients block random urn Bayesian
mean s.d. mean s.d. mean s.d. mean s.d.
0.05 0.4 0.15 15 0.15 0.15 0.15 0.17 0.29 0.30 0.32 0.33 30 0.15 0.14 0.15 0.16 0.36 0.35 0.41 0.38 60 0.15 0.14 0.15 0.15 0.44 0.39 0.49 0.42 0.9 15 0.9 0.12 0.9 0.14 0.95 0.075 0.96 0.068 30 0.9 0.12 0.9 0.13 0.97 0.051 0.98 0.041 60 0.9 0.12 0.9 0.13 0.98 0.03 0.99 0.022 0.95 0.15 15 0.15 0.15 0.15 0.17 0.44 0.36 0.51 0.42 30 0.15 0.15 0.15 0.16 0.52 0.42 0.56 0.45 60 0.15 0.15 0.15 0.15 0.57 0.45 0.6 0.47 0.9 15 0.9 0.13 0.9 0.14 0.97 0.047 0.99 0.028 30 0.9 0.12 0.9 0.13 0.98 0.027 1.0 0.013 60 0.9 0.12 0.9 0.13 0.99 0.014 1.0 0.0069 0.25 0.4 0.15 15 0.15 0.15 0.15 0.17 0.20 0.25 0.21 0.29 30 0.15 0.15 0.15 0.16 0.24 0.30 0.24 0.34 60 0.15 0.15 0.15 0.15 0.29 0.34 0.28 0.38 0.9 15 0.9 0.13 0.9 0.14 0.93 0.14 0.94 0.15 30 0.9 0.12 0.9 0.13 0.94 0.13 0.95 0.14 60 0.9 0.12 0.9 0.13 0.96 0.11 0.96 0.14 0.95 0.15 15 0.15 0.15 0.15 0.17 0.36 0.34 0.45 0.42 30 0.15 0.15 0.15 0.16 0.45 0.38 0.52 0.44 60 0.15 0.15 0.15 0.15 0.53 0.42 0.57 0.46 0.9 15 0.9 0.13 0.9 0.14 0.96 0.076 0.99 0.056 30 0.9 0.12 0.9 0.13 0.98 0.048 0.99 0.029 60 0.9 0.12 0.9 0.13 0.99 0.029 1.0 0.016
Table S1: Fraction of patients allocated to efficacious donors. The same simulated trials were analyzed to create Table 2 and this table.
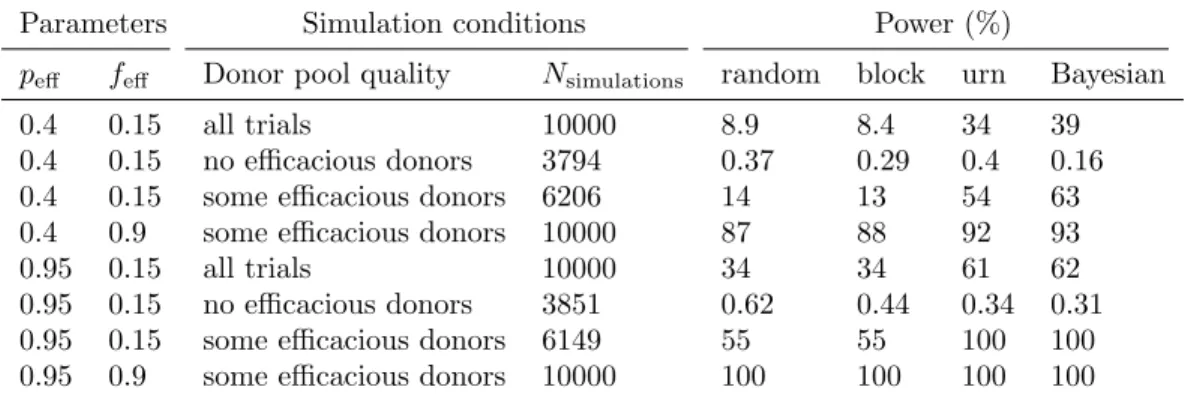
Parameters Simulation conditions Power (%)
peff feff Donor pool quality Nsimulations random block urn Bayesian
0.4 0.15 all trials 10000 8.9 8.4 34 39
0.4 0.15 no efficacious donors 3794 0.37 0.29 0.4 0.16
0.4 0.15 some efficacious donors 6206 14 13 54 63
0.4 0.9 some efficacious donors 10000 87 88 92 93
0.95 0.15 all trials 10000 34 34 61 62
0.95 0.15 no efficacious donors 3851 0.62 0.44 0.34 0.31
0.95 0.15 some efficacious donors 6149 55 55 100 100
0.95 0.9 some efficacious donors 10000 100 100 100 100
Table S2: Power of simulated clinical trials, conditioned on presence of efficacious donors. A subset of the data used to create Table 2 (only those simulations with Npatients= 30 and pplacebo= 0.05) was analyzed by
separately estimating the power for the trials in which no donors were efficacious (“no efficacious donors”) and in which at least one donor was efficacious (“some efficacious donors”). “All simulations” shows the same data as in Table 2. For feff = 0.9, none of the 10,000 simulations had a donor pool with no efficacious
donors. All 95% confidence intervals are within 1 percentage point of the reported value and are not shown.
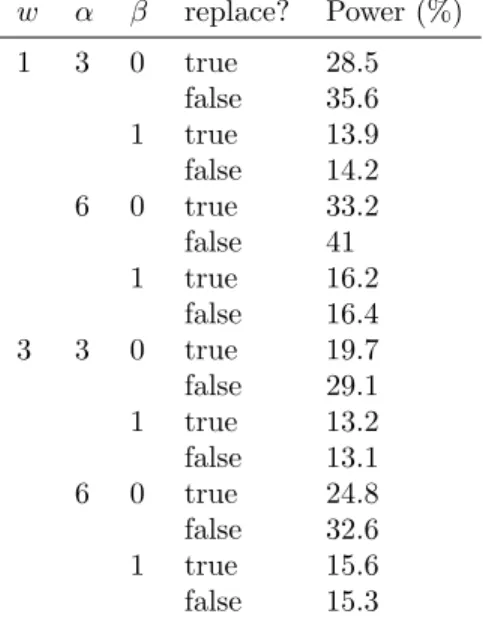
Hyperparameter values
Hyperparameterization Aplacebo Bplacebo Apeff Bpeff Afeff Bfeff Power (%)
From Table 1 2 35 7 11 1 5 41.1
Weak, accurate 0.2 3.5 0.7 1.1 0.1 0.5 41.2
Strong, accurate 20 350 70 110 10 50 40.4
Weak, inaccurate 0.4 3.3 1.4 0.4 0.2 0.4 40.9
Strong, inaccurate 40 330 140 40 20 40 34.4
Uniform n.a. n.a. n.a. n.a. n.a. n.a. 39.6
Table S3: Sensitivity of simulated clinical trial power to parameterization of the myopic Bayesian algorithm parameters. Starting from the parameter described in Table 1, 10,000 trials using the myopic Bayesian donor allocation were simulated for each of six different parameterizations of the Bayesian algorithm. “Accurate” means that the prior is centered around the true value (i.e., that A+BA equals the true value); “inaccurate” means that the prior is centered at approximately double the true value (but that A + B has been held constant). “Strong” means that every hyperparameter is ten-fold greater; “weak” means that every hy-perparameter is ten-fold smaller. “Uniform” means a uniform prior was used for all parameters. All 95% confidence intervals are within 1 percentage point of the reported value and are not shown.
w α β replace? Power (%) 1 3 0 true 28.5 false 35.6 1 true 13.9 false 14.2 6 0 true 33.2 false 41 1 true 16.2 false 16.4 3 3 0 true 19.7 false 29.1 1 true 13.2 false 13.1 6 0 true 24.8 false 32.6 1 true 15.6 false 15.3
Table S4: Sensitivity of simulated clinical trial power to urn parameterization. Using the parameter set described in Table 1, 10,000 trials using the urn-based donor allocation were simulated for each of several combinations of the parameters for the urn model as described in [18]. We also vary whether drawn balls are replaced or not. All 95% confidence intervals are within 1 percentage point of the reported value and are not shown.
Parameters Power (%)
feff peff pplacebo Ndonors random block urn Bayesian 0.15 0.4 0.05 1 15.5 15.3 15.5 14.8 3 12.4 12.2 28.4 30.9 5 9.87 9.67 33.8 38 10 7.49 6.93 38.2 44.3 15 6.91 6.38 34.6 45.9 30 6.17 5.26 16.6 45.9 0.25 1 6.08 6.15 5.89 5.58 3 4.64 4.21 6.7 6.89 5 4.65 4.7 7.28 7.1 10 4.37 4.18 6.2 7.52 15 4.48 4.09 5.41 7.07 30 4.25 4.3 4.67 6.89 0.95 0.05 1 15.2 15.1 15 14.9 3 34.4 37.2 39 39.2 5 35 36.1 56.3 56.5 10 33.7 33.3 80.1 80.4 15 33.5 32.6 91 90.6 30 31.6 30.4 87.4 93.9 0.25 1 17.1 17.3 17 16.8 3 23.1 22.6 39 39.9 5 21.3 20.9 55.2 55.5 10 18.8 17.7 69.7 69.7 15 17.4 16.8 65.4 69.9 30 16.4 15.4 43.2 69.4 0.9 0.4 0.05 1 84.9 84.7 84.6 84.3 3 85.9 85.8 91.8 92.4 5 87.4 87.2 92.4 92.4 10 88.4 88.9 92.3 92.8 15 88 89 91.8 92.9 30 89.1 89.3 91.1 92.9 0.25 1 22 22.3 22.5 22.1 3 21.8 21.2 23.1 22.7 5 21.7 21.3 23.1 23.2 10 21.7 21.3 22.7 23.7 15 22.2 21.5 22.5 24 30 21.9 21.6 22.1 23.5 0.95 0.05 1 90.1 90.1 90.1 90.4 3 99.5 99.7 99.9 99.9 5 100 100 100 100 10 100 100 100 100 15 100 100 100 100 30 100 100 100 100 0.25 1 90.4 90.4 90.4 90.5 3 97.7 98.1 99.9 99.9 5 99.1 99.4 100 100 10 99.8 99.9 100 100 15 99.8 99.9 100 100 30 99.9 100 100 100
Table S5: Dependence of simulated clinical trial power on number of available donors. For each parameter value, trials were simulated using 1, 3, 5, 10, 15, and 30 donors. The number of patients was fixed at 30. All 95% confidence intervals are within 1 percentage point of the reported value and are not shown.