HAL Id: insu-02333762
https://hal-insu.archives-ouvertes.fr/insu-02333762
Submitted on 25 Oct 2019
HAL is a multi-disciplinary open access
archive for the deposit and dissemination of
sci-entific research documents, whether they are
pub-lished or not. The documents may come from
teaching and research institutions in France or
abroad, or from public or private research centers.
L’archive ouverte pluridisciplinaire HAL, est
destinée au dépôt et à la diffusion de documents
scientifiques de niveau recherche, publiés ou non,
émanant des établissements d’enseignement et de
recherche français ou étrangers, des laboratoires
publics ou privés.
Ozone vertical distribution on Mars from
SPICAN/MEX UV occultations
Anni Määttänen, Franck Lefèvre, Sabrina Guilbon, Constantino Listowski,
Franck Montmessin
To cite this version:
Anni Määttänen, Franck Lefèvre, Sabrina Guilbon, Constantino Listowski, Franck Montmessin. Ozone
vertical distribution on Mars from SPICAN/MEX UV occultations. Scientific Workshop: “From Mars
Express to ExoMars”, ESAC, Feb 2018, Madrid, Spain. 2 p. �insu-02333762�
Scientific Workshop: “From Mars Express to ExoMars” 27–28 February 2018, ESAC Madrid, Spain
Workshop organized by ESA-ESAC & IAA-CSIC, with the support of the ESAC Faculty and the EU H2020 project UPWARDS
OZONE VERTICAL DISTRIBUTION ON MARS FROM SPICAM/MEX
UV OCCULTATIONS
A. Määttänen
1, F. Lefèvre
2, S. Guilbon
1, C. Listowski
1, F. Montmessin
11
LATMOS/IPSL, UVSQ Université Paris-Saclay, UPMC Univ. Paris 06, CNRS, Guyancourt,
France,
2LATMOS/IPSL, UPMC Univ. Paris 06 Sorbonne Universités, UVSQ, CNRS, Paris,
France
Introduction: We have achieved a four-yearcli-matology of the O3 vertical distribution using SPICAM UV occultations. The climatology con-firms the overall behaviour of O3, but reveals some discrepancies in comparison with a global climate model. By definition, solar occultations are acquired at sunset or sunrise, probing a local time where the rapid changes in insolation can have a large effect on the atmospheric state. Classically, the so-called onion-peeling method has been used as the necessary hypothesis on the atmospheric structure in the vertical inversion of the occultations; the atmosphere is supposed spherically symmetric. However, for photochem-ically active species, such as O3, this hypothesis
is a great simplification, since O3 distribution
ex-hibits large gradients between the day and night sides of the planet, which may induce errors when not accounted for. We are presenting here a simple way to overcome the problem when comparing models and observations; direct com-parison of slant profiles (i.e., without doing the vertical inversion).
Method and data: The full retrieval method of
the profiles, including ozone, in solar occultation was described in [1], using a similar analysis as the aerosol and ozone profiles in stellar occulta-tion described in [2,3]. Details on the SPICAM in-strument can be found in [4].
The UV channel measures spectra between 118 and 320 nm. The occultation technique is self-calibrated, since the spectra are normalised with the observed solar spectrum to acquire atmos-pheric transmissions. The transmission spectra are fitted with the Beer-Lambert law taking into account extinction by gaseous species (CO2 and
O3) and aerosols. Aerosol extinction is modeled
with the so-called alpha-model, providing access to the Ångström coefficient, which depends on the size of the aerosols.
Ozone climatology: The UV occultation dataset
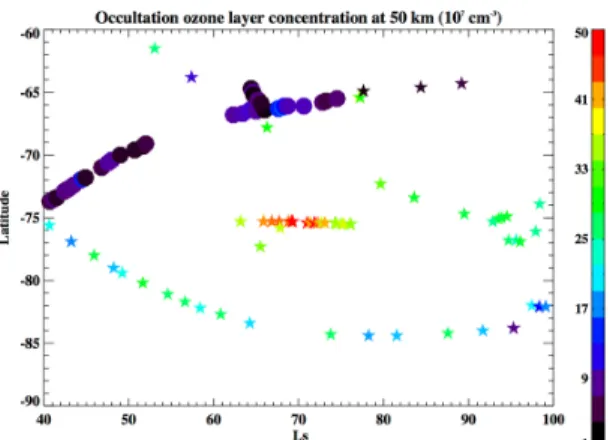
gives access to a climatology of ozone vertical distribution and to the local time variations. We will present the global results and a comparison to the LMD Mars Global Climate Model. We will also focus on certain case studies, such as the 3D mapping of the southern polar vortex, where
a transport-induced ozone layer has been ob-served [5]. This layer can now be probed in both stellar and solar occultations thanks to the full da-taset (Figure 1).
Figure 1: Ozone concentration at 50 km at the
south winter pole with SPICAM occultations (cir-cles: solar, stars: stellar). Color scale goes from 1x10⁷ to 50 x107.
Ozone gradients at the terminator: The rapid
variation of ozone due to photolysis at sunrise and sunset inhibits us from using the classical way of comparing the local density profiles ac-quired in solar occultation at the terminator with local profiles extracted from a model. The spher-ical symmetry hypothesis made in the onion-peeling vertical inversion method is not valid for photochemically active species (e.g., ozone) around terminator (see Figure 2). We are testing here a method commonly used in the Earth com-munity, which uses directly the slant profiles (ozone concentration integrated along the line-of-sight of the instrument) for the comparison. These profiles do not suffer from the hypotheses necessary in vertical inversion.
We are considering a subset of six SPICAM oc-cultations. For each occultation, we have used the 1D version of the LMD MGCM to model the ozone vertical and horizontal distribution with high solar zenith angle (or local time) resolution around the terminator (Figure 2). The clear dis-symmetry of the ozone distribution around the terminator is visible in Fig. 2. We then integrate these model results following the lines-of-sight of the occultation (calculated from the observation
Scientific Workshop: “From Mars Express to ExoMars” 27–28 February 2018, ESAC Madrid, Spain
Workshop organized by ESA-ESAC & IAA-CSIC, with the support of the ESAC Faculty and the EU H2020 project UPWARDS
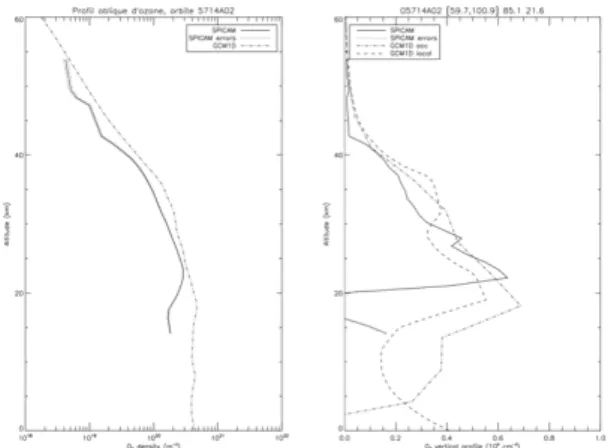
geometry) to construct the modeled slant profiles (left panel of Figure 3).
Figure 2: Inhomogeneity of ozone around the
terminator and its consequences on the analysis: Modeled ozone profiles (colors) around the ter-minator during the occultation as a function of the solar zenith angle and examples of three LOS of SPICAM (symbols).
In four out of six studied occultations, the agree-ment between the modeled and observed slant profiles is quite good (for an example, see left panel of Fig. 3). However, some cases display clear differences: sometimes the observed ozone densities are clearly smaller than the ones extracted from the model (not shown). Instead of being of a bias due to the comparison, this might also be simply due to the model not performing as it should in these cases (i.e., the model under-estimates the ozone destruction via HOx radicals
due to too small water vapor concentrations).
Figure 3: Left: Ozone concentrations integrated
along the line-of-sight (slant profiles) from the model (dash-dot line) and the observations (solid line). Right: Ozone vertical profiles from SPICAM (solid line) and the model (dash-dot line) after vertical inversion of the slant profiles, and com-parison to the modeled local profile at the termi-nator (dashed line).
We also tested the possibility to acquire im-proved results on the local vertical profile com-parison by performing the onion-peeling vertical inversion of the previously described slant pro-files. The comparison of the model with SPICAM is slightly better in some cases (see right panel of Fig. 3), but naturally the differences where SPICAM observes clearly less ozone than pre-dicted by the model (not shown) persist. In any case, the vertical inversion method we use even for inverting the LOS-integrated model profiles includes the spherical symmetry hypothesis, and thus the comparison of the local profiles is bi-ased.
Thus, here the most pertinent comparison is the one between the slant profiles. To completely avoid the problem of the spherical symmetry hy-pothesis, the heterogeneity of the atmosphere (for temperature, density/pressure and photo-chemically active trace gas concentrations) should be fully accounted for within the vertical inversion method. This will be achieved within the UPWARDS project (see abstract Piccialli et al., this conference, [6]).
References:
[1] Määttänen, A., C. Listowski, F. Montmessin, L. Maltagliati, L. Joly, A. Reberac, J.-L. Bertaux,
Icarus 223, 892-941, 2013.
[2] Montmessin, F. Quémerais, E., Bertaux, J.-L., Korablev, Rannou, P., Lebonnois, S., JGR 111, E09S09, 2006.
[3] Lebonnois, S., Quémerais, E., Montmessin, F., Lefèvre, F., Perrier, S., Bertaux, J.-L., Forget, F., JGR 111, E09S05, 2006.
[4] Bertaux, J., Korablev, O., Perrier, S., Quéme-rais, E., Montmessin, F., Leblanc, F., Lebonnois, S., Rannou, P., Lefèvre, F., Forget, F., Fedorova, A., Dimarellis, E., Reberac, A., Fonteyn, D., Chaufray, J. Y., Guibert, S., JGR111, 10–. [5] Montmessin, F., Lefèvre, F., Nat. Geosci. 6, 930-933, 2013.
[6] A. Piccialli, A.C. Vandaele, S. Robert, F. Daerden, S. Viscardy, L. Trompet, L. Neary, S. Aoki, Y. Willame, V. Wilquet, F. Lefèvre, A. Määt-tänen, F. Montmessin, Workshop “From Mars
Express to ExoMars”, 2018.
Acknowledgements: The research leading to
these results has received funding from the Eu-ropean Union’s Horizon 2020 Programme (H2020-Compet-08-2014) under grant agree-ment UPWARDS-633127. The authors acknowledge also support from the Programme National de Planétologie. This work was sup-ported by the CNES. It is based on observations with SPICAM embarked on Mars Express.