Designing Interactive Visualizations by
Demonstration
by
Jonathan Zong
B.S.E., Princeton University (2018)
Submitted to the Department of Electrical Engineering and Computer
Science
in partial fulfillment of the requirements for the degree of
Master of Science in Electrical Engineering and Computer Science
at the
MASSACHUSETTS INSTITUTE OF TECHNOLOGY
February 2020
c
○ Massachusetts Institute of Technology 2020. All rights reserved.
Author . . . .
Department of Electrical Engineering and Computer Science
December 6, 2019
Certified by . . . .
Arvind Satyanarayan
Assistant Professor of Electrical Engineering and Computer Science
Thesis Supervisor
Accepted by . . . .
Leslie A. Kolodziejski
Professor of Electrical Engineering and Computer Science
Chair, Department Committee on Graduate Students
Designing Interactive Visualizations by Demonstration
by
Jonathan Zong
Submitted to the Department of Electrical Engineering and Computer Science on December 6, 2019, in partial fulfillment of the
requirements for the degree of
Master of Science in Electrical Engineering and Computer Science
Abstract
Recent graphical interfaces offer direct manipulation mechanisms for authoring vi-sualizations, but they are largely restricted to static output. To author interactive visualizations, users must instead turn to textual specification, but such approaches impose a higher technical burden than their graphical counterparts. To bridge this gap, we introduce interaction design by demonstration: a novel method for author-ing interaction techniques via direct manipulation. Users perform an interaction (e.g., button clicks, drags, or key presses) directly on the visualization they are editing. The system interprets this performance using a set of heuristics and produces suggestions of possible interaction designs. These heuristics account for the properties of the in-teraction (e.g., target and event type) as well as the visualization (e.g., mark and scale types, and multiple views). Interaction design suggestions are displayed as thumb-nails; users can preview and test these suggestions, iteratively refine them through additional demonstrations, and finally apply and customize them via property inspec-tors. To evaluate our approach, we instantiate it in Lyra, an existing visualization design environment. We demonstrate its expressive extent with a gallery of diverse examples, and evaluate its usability through a first-use study and via an analysis of its cognitive dimensions. We find that, in Lyra, interaction design by demonstration enables users to rapidly express a wide range of interactive visualizations.
Thesis Supervisor: Arvind Satyanarayan
Contents
1 Introduction 9
2 Related Work 13
2.1 Textual Specification of Interactive Visualizations . . . 13 2.2 Non-Textual Specification of Visualizations . . . 14
3 Background 17
3.1 Static Visualization Design in Lyra . . . 17 3.2 Interaction Design in Vega-Lite and Vega . . . 18
4 Interaction by Demonstration in Lyra 21
4.1 The Abstract Interaction Model . . . 21 4.2 The Demonstrations Interface . . . 24
5 Evaluation: Example Gallery 29
6 Evaluation: First-Use Study 31
7 Evaluation: Cognitive Dimensions of Notation 35
List of Figures
4-1 Brush with Labeled Extents . . . 22 4-2 Lyra’s interaction by demonstration interface. A) Visualization canvas.
B) Suggestions heuristics. C) Preview thumbnails. D) Interactions inspector. . . 24 4-3 Alternate sketches for suggestions and previews. . . 27 5-1 Example visualizations demonstrating Lyra’s expressivity. . . 30
Chapter 1
Introduction
Interactive visualization is increasingly embraced as a medium for recording, ana-lyzing, and communicating data. To meet this demand, a recent thread of research has explored methods for minimizing the amount of technical expertise required to author visualizations. Systems like Lyra [31], Data Illustrator [19], and Charticu-lator [27] provide graphical interfaces, and users create visualizations through drag-and-drop and direct manipulation interactions rather than low-level programming. However, though interactivity is recognized as a crucial component of effective vi-sualization [25, 18], few of these graphical interfaces offer much support for interac-tion design. The aforemeninterac-tioned systems, for instance, only produce static output and other alternatives including Tableau (née Polaris [36]) and VisDock [5] either hard-code possible interaction techniques, or offer a limited typology of techniques respectively.
To author custom interactive visualizations, users must instead turn to textual specification languages, such as D3 [4], Vega [35, 34], and Vega-Lite [33]. While highly expressive, these tools have several usability drawbacks as compared to graph-ical interfaces. For instance, with D3, authors must write low-level event callbacks which expose execution details like mutable state and concurrency [6, 8]. These de-tails are often unrelated to visualization design, and managing them hinders authors from quickly iterating on designs. Declarative languages such as Vega and Vega-Lite have made progress by introducing higher-level abstractions, such as signals or
selec-tions respectively, to mask these execution concerns. However, these abstracselec-tions are expressed through textual specifications which present an unnecessarily large gulf of execution [13]: they provide a poor closeness of mapping [2] to the ultimate interactive visual output, forcing users to learn to map between two very different paradigms.
To bridge this gap, we introduce methods for designing interactive visualizations by demonstration. Consider the example task of creating a rectangular brush for selecting and highlighting points on a scatterplot. To design this technique, users demonstrate it by dragging their mouse cursor directly over the visualization they are currently editing. The system interprets this performance using a set of heuristics, and produces suggestions of possible interaction designs. In our example, the system detects that drag events occur in a space marked by quantitative x- and y-axes and suggests a set of interval-based interactions [33]. These suggestions consist of a se-lection (e.g., 1D or 2D brushes) and an application (e.g., conditional color, opacity, or size encodings or filtering selected points). Suggestions are displayed as thumbnail previews, which illustrate what the visualization would look like after applying the interaction and facilitate rapid comparison. Users can hover over suggestions to pre-view them on the main visualization, perform additional demonstrations to refine the suggestions, or click to accept a suggestion and instantiate the interaction technique. We instantiate this approach in Lyra [31], an existing visualization design en-vironment, with interaction suggestions generating statements in the Vega [34] or Vega-Lite [33] visualization grammars. Critically, demonstrations and suggestion of-fer a way to unify these two levels of abstraction. For instance, say we wished to label the corners of our rectangular brush with their coordinates in data space. Vega-Lite does not provide any facilities to do; a user could choose to edit the compiled Vega specification and add the appropriate signals, but they would experience a sharp complexity cliff and have to reason about two saliently different paradigms (selections and reactive programming, respectively). Demonstrations and suggestions, however, provide a consistent interface mechanism to seamlessly move between these two levels of abstraction. Once a user demonstrates a brush interaction, they can use visual property inspectors to drill into the components of the interaction (i.e., the brush
start and end extents). Users can then drag and drop these brush extents to the properties of text marks to achieve the desired interactive behavior.
We evaluate our approach in three ways. To assess its expressive extent, we use demonstrations in Lyra to recreate a diverse gallery of examples and demonstrate substantial coverage of an existing taxonomy of interaction techniques for data vi-sualizations [38]. To determine its usability, we conducted a first-use study with participants spanning a broad range of prior experience creating interactive visualiza-tions. All study participants were able to recreate a range of interactive visualizations and described the use of demonstrations as "natural". Finally, we further evaluate usability by analyzing their cognitive dimensions [2], and find that demonstrations and suggestions offer a means to progressively evaluate desired interactive outcomes with a much closer mapping between the specification and output medium.
Chapter 2
Related Work
Our contribution builds on prior work on models of interactive visualization design and graphical interfaces for authoring visualizations, and draws inspiration from the literature on programming by demonstrations (PBD).
2.1
Textual Specification of Interactive Visualizations
A variety of textual specification languages and visualization toolkits have explored methods for specifying custom interactive behaviors. Protovis [3] and D3 [4], for ex-ample, offer palettes of standard techniques but force users to write low-level impera-tive event handling callbacks for custom behaviors. Improvise [37] and Stencil [7] offer more fine-grained primitives, inspired by data flow semantics, that dynamically up-date and propagate values to downstream dependents — a conceptual model that al-lows for expressive interaction design. More recently, Vega [34, 35] and Vega-Lite [33], which we described in greater detail in the subsequent section, explore grammar-based approaches for specifying interaction techniques. While all these tools span the gamut of expressivity, they share a common set of usability concerns. Namely, they each present a non-trivial gulf of execution [13] because they force users to express interac-tive and visual outputs in terms of text — a fundamental mismatch between the input and output representations. As a result, although these tools have high expressive ceilings, they present a non-trivial threshold [23] and thus are typically favored by
users with some data visualization expertise.
2.2
Non-Textual Specification of Visualizations
To make visualization design more accessible to users with less technical expertise, researchers have been exploring graphical interfaces for visualization design. Systems like Lyra [31], Data Illustrator [19], and Charticulator [27] (three recent examples in a rich design space [15, 20, 22, 21]) allow users to author visualizations through direct manipulation interactions inspired by vector graphics packages. While these systems make a number of different decisions as they trade expressivity for learnability [32], none of them yet explore how to enable specification of custom interaction techniques. Graphical interfaces that do support interactivity typically either hard code specific interaction techniques (e.g., Tableau [36] or iVisDesigner [26] which support brushing & linking) or allow users to instantiate behaviors from a pre-defined palette of tech-niques (e.g., iVolver [22] and VisDock [5]). Thus, how to enable custom interaction design for data visualization without textual programming remains an open problem. A recent thread of research by Saket et al. [30, 29] takes an alternate approach to non-textual visualization design that they dub “Visualization by Demonstration” (Vbd). Rather than performing drag and drop operations to bind data fields to visual encoding channels explicitly, under Vbd, users implicitly specify these mapping by performing demonstrations. For instance, by dragging two points together, the system infers the user wishes to create a scatterplot and suggests a number of x-y axis pairs. Saket et al. adopt a number of techniques from the programming by demonstration (PBD) literature [9, 10, 14] including using previews to help users disambiguate their demonstration, and allowing users to further refine suggestions through additional demonstrations. In subsequent studies, they have shown that Vbd is indeed a viable method for constructing interactive visualizations [28]. Our approach shares many similarities with this line of work: users perform demonstrations directly on the visu-alization, the system surfaces a set of visual previews that users, and users can refine suggestions via additional demonstrations. Where the two methods diverge, however,
is in the outcome of the demonstration: with Saket et al.’s systems, users perform a demonstration to express how a static visualization should be constructed; with our approach, demonstrations express interaction techniques.
Chapter 3
Background
Our implementation of interaction design by demonstration in Lyra builds on both ex-isting static visualization design concepts in Lyra, and on interaction design concepts in Vega and Vega-Lite.
3.1
Static Visualization Design in Lyra
Lyra is a system for designing static data visualizations via direct manipulation. Its graphical interface and state model is grounded in a set of abstractions for authoring static visualizations, drawn from the Vega [34] visualization grammar.
Pipelines. Data pipelines allow users to import tabular datasets, inspect them via a data table view, and apply chains of common statistical data transformations (e.g., filtering and grouping).
Scales. Scales map data values to visual properties such as position, shape, and color. Lyra supports both discrete and quantitative scales, and automatically instan-tiates an appropriate scale when a user performs a direct manipulation data binding operation. Users can tweak scale properties (or choose to manually create a scale) using visual property inspectors.
Guides. Guides are reference marks that visualize scales. Axes visualize scales over a spatial domain. Legends visualize scales for color, shape, or size encodings. Like scales, Lyra automatically constructs the necessary and appropriate guides when
a data bind occurs, but users can also choose to manually construct them or adjust their properties via property inspectors.
Marks. Marks are shapes (e.g. rectangles, lines, symbols, text labels) with named visual properties (e.g., x, y, fill, and stroke). Property values can be manually set to constant values, or or bound to data. When a mark definition is bound to a dataset, Lyra instantiates one mark instance per data record.
To directly manipulate the abstractions described above, Lyra provides the fol-lowing user interface components:
Visualization canvas. Akin to vector graphics packages, marks appear on the visualization canvas with handles, which can be used to interactively move, rotate, and resize all instances of the selected mark. When dragging a field from a pipeline’s data table view, shaded regions called dropzones overlay the canvas. These overlays provide targets that indicate which mark property will be bound. The canvas always reflects the current state of the output visualization, resulting in a short gulf of evaluation [13]. Property inspectors. Inspectors list properties of marks, scales, and guides, and provide an interface for fine-grained editing as an alternative to the canvas. Property values may be edited directly or set via drag-and-drop of data fields, and these changes are immediately reflected in the canvas.
3.2
Interaction Design in Vega-Lite and Vega
Although Lyra represents visualizations using Vega, our interaction design model is based on abstractions from Vega-Lite [33], a higher-level grammar that compiles down to Vega.
Selections. Interactions in Vega-Lite are expressed as selections, which are sets of data records. Selections have three types — single, multi, or interval — which deter-mine the logic for which records are included within the set, and what input event triggers this inclusion (e.g., mouse button clicks). Selections can be projected to vary the inclusion criteria. For instance, a default single selection only includes the point a user clicked on in the set; projecting the selection over a field, however, will include
all records that share the same value for that field determined by the clicked point. Selections can be used to define conditional encodings, which apply different values depending on whether or not a data record is included in the set of selected records. Selections can also be used to filter input data and to determine scale domains. Vega-Lite selections compile into expressions involving Vega signals.
Signals. In Vega, signals are dynamic variables which update in response to input event streams. They can be composed into expressions, which are formulas that are automatically recalculated whenever signal values update. Signals can be used throughout a Vega specification including as part of a mark property, data transform parameter, or scale domain.
Chapter 4
Interaction by Demonstration in Lyra
4.1
The Abstract Interaction Model
In Lyra, users specify interaction techniques as a set of selections and applications, and can also construct dynamic query widgets [1]. This interaction model draws on abstractions found in Vega and Vega-Lite but makes some key departures. These differences reflect the different pressures exerted by a textual versus a graphical user interface: Vega and Vega-Lite primitives are designed to compose together easily, to minimize language surface area and complexity; Lyra, on the other hand, is more concerned with recognition over recall [17] by providing consistent user introspection into primitives via property inspectors.
Selections. Lyra selections determine how input events select data records. They can be one of two types: points or intervals. Our selection model diverges from Vega-Lite’s because its purpose is to enable demonstration. Users specify selections by directly performing input events on the visualization. For this reason, Vega-Lite’s single, multi, and interval selection types are instead grouped by input event — point selections for clicks and other discrete interactions, and interval selections for drags.
Like Vega-Lite selections, the inclusion criteria for Lyra selections can be mod-ified via projections. However, Lyra once again diverges: projections for interval selections (i.e., single dimensional brushes along the x- or y-axis) can be specified via demonstration and are automatically surfaced as suggestions; but for point
selec-tions, projections are set via a property inspector. This difference is due to formative feedback we received from users during our design process: while it was straightfor-ward to demonstrate a single-dimensional interval by moving the mouse in roughly only the horizontal or vertical direction, a similar interaction for point selection was too ambiguous. Users would have to repeatedly click several points in order for the demonstration heuristics to infer shared field values, resulting in a frustrating expe-rience.
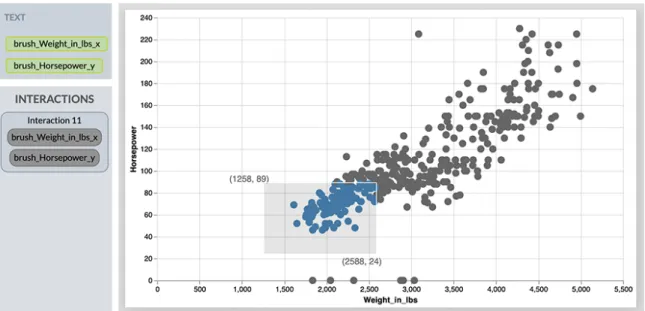
Critically, some interactive behaviors cannot be defined in terms of sets of selected records. For instance, consider labeling the corners of a brush: these are arbitrary coordinates in data space, and may not precisely map to specific data records. Such an interaction design is not expressible in Vega-Lite but, in Lyra, users can unwrap selections into their constituent Vega signals (Figure 4-1). For example, interval selections expose signals for the selection’s start and end extents. These signals can then be dragged and dropped onto property inspectors, akin to data fields, to establish conditional encodings or drive data transformation operators.
Figure 4-1: Brush with Labeled Extents
Applications. In Lyra, the application of selections to other constructs (e.g., driv-ing conditional mark encoddriv-ings, scale domains, or data transformation) is treated as a first-class primitive. Applications reference a source selection and a target element,
and are a salient departure from the Vega-Lite interaction model. In Vega-Lite, ap-plying selections to marks, scales, and data transformations involve subtly different syntax. For example, panning and zooming is implemented via a bind transformation specified as part of a selection’s definition while conditional encoding logic is inline, as part of a mark’s specification. Such distinctions would seem arbitrary and con-fusing within a graphical interface. Instead, in Lyra, selection applications abstract over these distinctions and are surfaced as sibling suggestions during a demonstration. Critically, by treating applications as first-class primitives, we are able to surface ap-plications from two points of view: in a selection’s property inspector, we can list all the ways it is applied across the visualization; and from the individual target el-ements, property inspectors update to reflect their interactive nature. By contrast, while the latter affordance is available in Vega-Lite, the former is not and a user would be forced to search through a specification in order to understand the various effects a selection may have on the visualization.
Query widgets. Both Vega and Vega-Lite support query widgets through similar mechanisms: signals and selections, respectively, can be bound to HTML input wid-gets like textboxes, radio buttons, and range sliders. Lyra treats query widwid-gets as a distinct class of interactions separate from selections for two reasons. First, while selections are specified through demonstrations on the visualization canvas, specify-ing widgets follows Lyra’s pre-existspecify-ing drag-and-drop model: users drag a field from a pipeline’s data table, and drop them over a new query widget dropzone below the visualization canvas. Doing so exposes a series of widget suggestions, analogous to selections, that users can interact with to preview the suggestions. Second, it allows us to more fluidly bridge the two levels of abstraction: query widgets can be treated as signals to directly set the property of a mark or scale, or be referenced within a data transformation; but they can also be treated as a selection, with an inclusion criterion that can be customized — functionality that is not yet possible in Vega-Lite where query widgets are treatted as simply an alternate means of populating a se-lection. Thus, via a property inspector, users can specifying alternate (in)equality operators to determine which records the query widget selects.
4.2
The Demonstrations Interface
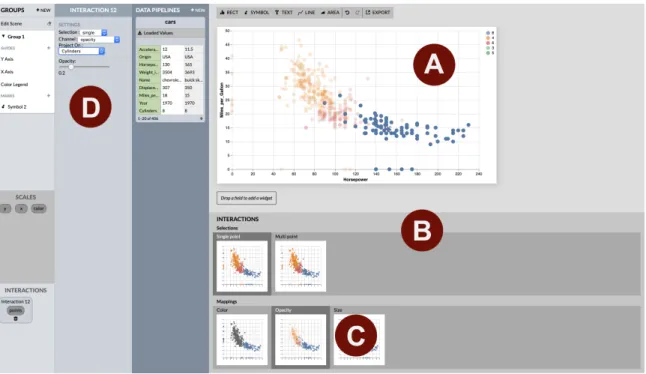
Figure 4-2: Lyra’s interaction by demonstration interface. A) Visualization canvas. B) Suggestions heuristics. C) Preview thumbnails. D) Interactions inspector.
Users introspect and manipulate the abstract interaction model through Lyra’s graphical interface.
Visualization canvas. We augment the Lyra visualization canvas to allow users to demonstrate interactions directly on the output visualization (Figure 4-2A). For static visualizations, the Lyra canvas always reflects the current state of the output. We designed interaction by demonstration to maintain this property, keeping the gulf of evaluation [13] as narrow as possible. For instance, we considered alternative designs where users had to explicitly toggle demonstration mode on or off; but, in formative evaluations, we found such a modal interface reduced users’ sense of directness, and introduced sufficient friction to inhibit quick feedback loops and broad exploration of the design space. Instead, feasibility tests revealed that for a large space of interaction techniques, their demonstrations did not conflict with Lyra’s existing interactivity (i.e., “app-based” interactivity). Those that do conflict, like clicks on marks, can be resolved through continued interaction: the first click selects a mark in the app, and
the second will initiate demonstration.
Suggestions heuristics. Lyra processes demonstrations and displays potential se-lections and applications in the suggestions view, where users can quickly preview suggestions and apply them to the visualization (Figure 4-2B). The heuristics take the following inputs: the demonstration event type, the marks and scales present in the view, and whether other views exist that share the same data source. Using the event type, the system surfaces suggestions for either point or interval selections. Mark encoding applications are shared across both types of selections. For interval selections, the system also surfaces a suggestion for panning and zooming. The system also generates a filter application suggestion for each additional view.
Because these heuristics account for properties of both the interaction as well as the visualization, the system can discard suggestion that are not semantically meaningful. For example, the suggestions view will show encodings that are unique to certain mark types (e.g. symbol size and text content) depending on which marks have been added. It will only show certain interval selection types if they make sense with the visualization’s combination of mark and scale types—for instance, bar charts with a nominal field in the x axis will only have x axis interval selection suggestions. And the system will only suggest multi-view filtering when other views sharing the same data source are present.
Preview thumbnails. Each suggested selection and application is represented by a preview thumbnail, that visually depicts the suggestion (Figure 4-2C). Thumbnails narrow the gulf of evaluation [13] by providing a close mapping to a user’s mental model of their desired outcome, both in terms of the selection they wish to make (e.g., previewing 1D or 2D brushes) and the effect it should have on the visualization (e.g., highlighting or filtering points). In our design process, we considered alterna-tives with natural language descriptions of the corresponding Vega-Lite specifications (Figure 4-3a), but found that novice users were not always familiar with terms we use for interactions (e.g. “brushing”) despite having a clear image in their mind. And, even among people who have experience creating interactive visualizations, pre-view thumbnails abstract over differing vocabularies that tools may expose. We also
explored alternate designs with a pop-up menu attached to each view, making the canvas the only way to preview the visualization (Figure 4-3b).
Interactions inspector. With straightforward extensions to Lyra’s interface, we list interactions (both selections and query widgets) in the left-hand sidebar (Fig-ure 4-2D). We reuse Lyra’s existing rounded-rect motif, to indicate that interactions can be dragged and dropped across the interface, akin to data fields. And, for more fine-grained customization, interactions also have their own property inspector. For example, when a user applies a selection to conditionally color marks, users may use a color picker interface in the inspector to customize the colors. This property inspec-tor also lists all applications of an interaction across the visualization, including its participation in conditional mark encodings, scale domains, or data transformations. As a result, interaction property inspectors provide a single interface element through which users can understand the effect of an interaction. This approach is in contrast to Vega and Vega-Lite, where only the definition of an interaction is localized, and its applications are scattered through the remainder of the specification.
RECT 2 PIPELINE Unemployment GROUPS + NEW Edit Scene ▾ Group 1 GUIDES MARKS X Axis Y Axis Rect 2 Rect 2 RECORD SELECT on drag in both dimensions only the x dimension only the y dimension
2 on shift-click, ctrl-click, or alt-click 4 Rect 2 elements 2 values industry month values on click 4 Rect 2 element 2 value industry month value an interval of points X POSITION Start Width X industry auto Y POSITION Start End Y count Y 0 #6cc6ff Color Opacity FILL #6cc6ff Color Opacity STROKE
DATA PIPELINES + NEW Unemployment + NEW TRANSFORM 2000 series 173 154 11.5 date 2000-01... Agricul... 1 2000 month 35109 count rate 2000-02-... 10.3 35109 Agricul... year industry 2 1-20 of 1,708 ➔ + NEW VISUAL LAYOUT Jobs Change
SELECTIONS + NEW SCALES +
X Y
Fill Color Industry
multiple different a single
NOW Select a target for the interaction.
(a) Sketch for suggestion interface with natural language descriptions. While this interface offered precise control, users found visual previews more effective
DATA PIPELINES CARS JOBS +NEW
Acceleration Aggregations ▾ Country Aggregations ▾ MPG Aggregations ▾ Cylinders Aggregations ▾ INTERACTIONS SCALES X Y Interval Interval Rect Symbol Text Line Single Interval Area Multi MARKS INTERACTIONS Mouse Key Shift Drag INTERACTION 1 Type Event Target Interval View 2
(b) Sketch for a pop-up menu attached to the view for specifying interaction types. In this model, users could not evaluate the behavior of an interaction before applying it to the canvas.
Chapter 5
Evaluation: Example Gallery
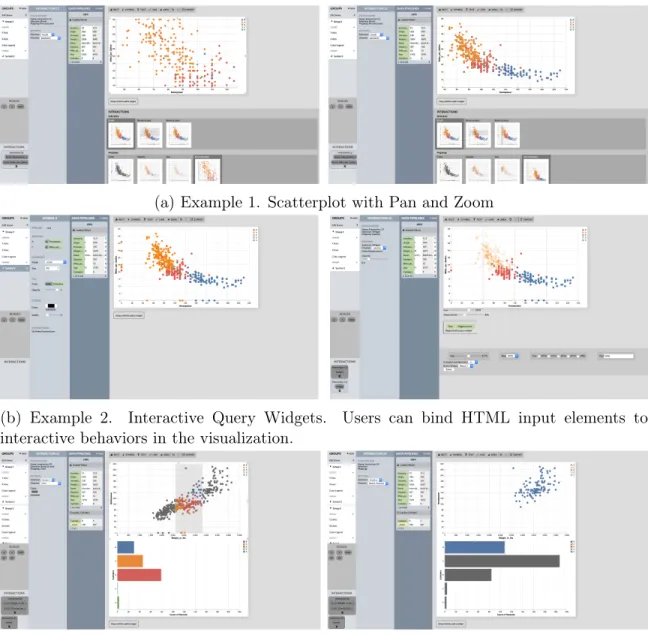
To evaluate the expressive extent of our approach, we used Lyra to create a gallery of diverse interactive examples drawn from the Vega-Lite and Vega example galleries. The examples (Figure 5-1) show the use of selections and applications, query widgets, and filtering across multiple views. We also create a rectangular brush with labeled extents to demonstrate Lyra’s capacity for customized interactions bridging Vega and Vega-Lite.
To recreate the dashboard interactivity in Example 3, users start by dragging on the top view to surface interval suggestions. In the suggestions menu, users first choose an x-axis interval selection applied to a conditional color mapping. Then, users exit the demonstration and then create another interaction with an x-axis interval selection applied to a filter on the bottom view. To create the filtering in the other direction, users demonstrate a click on one of the bars in the bottom view. They then choose a single point selection applied to a conditional color encoding, then create another interaction applying a point selection to a filter on the top view.
(a) Example 1. Scatterplot with Pan and Zoom
(b) Example 2. Interactive Query Widgets. Users can bind HTML input elements to interactive behaviors in the visualization.
(c) Example 3. Dashboard with Multi-view Filtering. Brushing the top view filters the bars, and clicking histogram bars in the bottom view highlights corresponding points in the scatterplot.
Chapter 6
Evaluation: First-Use Study
We designed Lyra to improve expressiveness and usability for users, especially those with less prior coding experience. We evaluate our approach’s usability through a first-use study with 6 representative users including 2 experienced visualization designers, 2 computer scientists, and 2 from fields unrelated to visualization. The mean self-reported past visualization design expertise was 2.83 on a 5 point Likert scale (𝜎 = 1.21). Those who had previous experience in visualization design had primarily used D3, although one participant was familiar with Vega, Vega-Lite, and Altair.
Methods. We began each study with a 10 minute walkthrough of Lyra’s features. We then asked participants to complete three interaction design tasks. For each task, we showed them an example interactive visualization and created the static version in Lyra. We then asked them to use Lyra to recreate the interactivity from the example. The three visualizations were drawn from the example gallery (Figure 5-1): a pan and zoom scatterplot (T1), a filterable scatterplot with query widgets (T2), and a linked scatterplot and bar chart (T3). These tasks were designed to ensure participants interacted with all aspects of Lyra’s interaction interface. The tasks were ordered to increase in difficulty. Participants were encouraged to think aloud, and asked freeform follow-up questions at the end. Sessions lasted approximately 45 minutes.
Ratings. Users quickly learned how to create interaction designs in Lyra, and all users, regardless of their prior visualization experience, successfully completed
all three tasks with minimal guidance. In a post-study survey, participants rated Lyra’s demonstrations interface highly, but found the traditional property inspector less useful. Demonstrating interactions on the canvas felt natural (𝜇 = 4.83, 𝜎 = 0.37 on a 5-point Likert scale), suggestions were useful (𝜇 = 4.83, 𝜎 = 0.37), and previews helped evaluate suggestions (𝜇 = 4.17, 𝜎 = 1.07). Inspectors were considered less useful (𝜇 = 2.83, 𝜎 = 0.69), as participants noted that it felt too disconnected from the rest of the demonstration workflow.
Successes. Participants found the interaction design by demonstration process "natural". An experienced participant said that the user flow was similar enough to their development process in textual specification tools that they could easily transfer their skills. Less experienced participants also found demonstration’s short articulatory distance helpful. One said, "Demonstrating the interactions was very easy. I didn’t really know the word brushing, but it was easier to just do it than to say what it is. Same with picking from the widget types that have technical names like radio."
Participants were especially excited about easily creating interactions they consid-ered to be complex. A participant said that Lyra "would make me experiment more with possible interactions" because of the lower technical barrier. Reflecting on T3’s multi-view filtering interaction, they said, "I wouldn’t have thought to make this. I would think it was too hard." Another participant without prior visualization experi-ence noted that being able to easily create multi-view filtering would be very useful in their work, where people often use non-interactive charts of high dimensional data. The quick feedback loop of evaluating and applying suggestions also stood out positively to participants. A more experienced participant compared the feedback loop with textual specification, saying that "with these lower level libraries, getting an interaction to work takes a while even when copying and pasting." Similarly, a participant with less visualization experience noted that "being able to test immedi-ately was very useful. Even when it went wrong, I could immediimmedi-ately tell that it was wrong." Previews were important to this quick feedback loop, but users noted that not all of them were equally useful. For instance, the previews for single and multi
point selections currently look the same in most cases, which led users to be unsure about what multi point means. Similarly, participants pointed out that the previews for filtering other views would be more useful if they showed the view that was being filtered. We anticipate making these interface improvements in the near future.
Shortcomings. When participants’ mental models mismatched the Lyra interface, it tended to be around specifying complex applications. One user pointed out that, although panning and zooming is a drag interaction, the selection language focusing on brushing created some confusion. Similarly, a few users were initially unsure whether they should demonstrate on the source or target view to surface a filter suggestion. Filtering is also usually combined with a visual encoding application, and one participant expected to be able to choose multiple applications per interaction, instead of needing to create multiple interactions with the same selection.
Participants found the interaction inspector the least helpful. Because partici-pants were focused on demonstrating and evaluating interactions, most found that they rarely glanced over at the inspector. "It felt farther from what I was doing, and it’s literally far away," one said. T3 involved a projection operation only available in the inspector, but participants expected to be able to do everything using demonstra-tions. Reflecting on trying to modify the projection, one said, "I was looking [in the suggestions view], but couldn’t find it." We anticipate making support for projections in the suggestions view more robust in future work.
Chapter 7
Evaluation: Cognitive Dimensions of
Notation
The two prior sections evaluated the expressivity and usability of Lyra’s interaction by demonstration model. Here, we continue to assess usability and evaluate our approach against existing practices: designing interactive behaviors through textual specification languages such as Vega or Vega-Lite. To do so, we ground our evaluation in the Cognitive Dimensions of Notation [2], a framework which provides an apt set of heuristics for such a comparison. Of the 14 dimensions found in the framework, we find particularly salient differences for the following:
Closeness of Mapping. Demonstrations offer a much closer mapping between the notation of the specification (input events) and the desired outcome (an interaction design). Depicting suggestions as thumbnails further builds on this dimension, by offering users a visual preview of possible interactive behaviors. By contrast, textual specification languages force users to express interaction techniques in potentially unfamiliar terms. In fact, in formative evaluations, many novice users had never previously described interactions as “selections” or “brushes,” which are common terms in data visualization and human-computer interaction literature.
Progressive Evaluation. It is difficult to validate in-progress work with textual languages. Only complete specifications produce working output: if required prop-erties are left underspecified, for instance, the language compiler will throw an error
and produce no output. This issue is exacerbated for interaction specification: com-plete definitions of signals or selections will produce working output, but this may not always be evident until they are used in the remainder of the specification. By con-trast, Lyra’s approach by demonstration materializes this dimension: users are able to explore the possible design space and continuously preview points in this space prior to explicit instantiations of an interaction technique.
Diffuseness. Textual languages, particularly a higher-level grammar like Vega-Lite, offer a much more concise specification format than the graphical equivalent in Lyra. This property is true not only in the general sense (iterations that involve localized, often one-word changes in Vega-Lite translate to multiple clicks in Lyra) but also in specific ways for this paper’s contribution. By definition, demonstrations are a more ambiguous specification format and a user may have to perform several attempts before the system correctly infers their desired behavior. We observed this issue most saliently when attempting to project a point selection: users would need to repeatedly click several points for the system to have sufficient data to infer shared field values, which proved to be an overly frustrating experience. Based on these re-sults, we chose to expose point selection projections in the property inspector rather than via demonstrations. Lyra’s approach has an additional source of diffuseness: it is not difficult to imagine preview thumbnails becoming unwieldy as users craft more complex multi-view dashboards. Future work must consider how to scale the sug-gestion previews — for example, perhaps once the visualization’s dimensions crosses a particular threshold, the suggestions switch from purely visual to a combination of visual and textual modalities. Of course, such a change would trade off the closer mapping our current approach affords.
Abstraction. Lyra previously bridged the Vega and Vega-Lite levels of abstraction for static visualization design, and this property continues to be true for interaction design as well. Although users can choose to compile Vega-Lite specifications and edit the output lower-level Vega specification, few users do so in practice because of the complexity cliff. For instance, a default Vega-Lite interval selection generates 14 lower-level signals, each with a non-trivial definition. In Lyra, we are able to
offer a smoother abstraction gradient: only signals corresponding to the x- and y-data extents are exposed, and by dragging and dropping interactions within property inspectors, Lyra is able to infer whether the interaction should be treated as a selection or a signal.
Visibility. We consider textual specifications to be maximally visible: although a specification may be long and flow off-screen, a user is able to perform a search to jump to specific locations. Moreover, text editors increasingly offer “minimap” visualizations which provide a visual overview of the specification. By contrast, in Lyra, to gain visibility into visualization components users must first locate them in a listing, and then click through to the property inspector. This difference may initially seem trivial but, as our first-use study revealed, people primarily (and sometimes exclusively) attend to the visualization canvas and may forget that the property inspectors exist on the left-hand side.
Hidden Dependencies. Property inspectors, on the other hand, allow us to reveal dependencies that are otherwise more latent in textual specifications. In particular, as we designed interaction property inspectors, we realized that they provided a prime location for collating all the ways an interaction technique may be used across a visualization. Working through this design motivated raising selection applications to be a first-class primitive in our interaction model. In the textual languages, a user would have to search through a specification and manually build their mental model of how a selection or signal is being used.
Chapter 8
Discussion and Future Work
This paper contributes methods for designing interactive visualizations by demon-stration and instantiates these methods in Lyra. By providing expressive and usable abstractions, Lyra makes interactive visualization design accessible to a broader range of users. Its interface components, such as the demonstration interface, suggestion heuristics, preview thumbnails, and interaction inspector, reduce the cognitive load required to evaluate and execute interaction designs. A diverse collection of exam-ples demonstrates Lyra’s expressiveness, including many designs that are nontrivial to express in current declarative visualization languages. Participants in a user study found that the tool helped them create visualizations that previously felt too difficult to attempt.
Our work surfaces a number of directions for future work. For example, Lyra does not currently support visualization debugging. Prior work in visual debugging has offered techniques to help users understand program behavior [11], and has applied them to reveal the runtime behavior of declarative visualization specifications [12]. However, these techniques have primarily been investigated for textual specifications in the context of a code editor. How to adapt these techniques for graphical interfaces is an immediate and pressing concern. One might imagine, for example, a layer of visual indicators in the visualization canvas which identify the causes of certain behaviors and provide references into Lyra’s property inspectors for debugging.
suggestions, are primarily grounded in Vega-Lite selections. Although Lyra unwraps selections to expose the underlying Vega signals, users cannot perform demonstra-tions to target signals directly. Interaction techniques which occupy a middle ground between direct demonstration and traditional inspector-like interfaces (e.g., Inter-State [24] or Monet [16]) could yield new insights into the space of possible interface designs.
Bibliography
[1] Christopher Ahlberg, Christopher Williamson, and Ben Shneiderman. Dynamic queries for information exploration: An implementation and evaluation. In Pro-ceedings of the SIGCHI conference on Human factors in computing systems, pages 619–626. ACM, 1992.
[2] Alan F Blackwell, Carol Britton, A Cox, Thomas RG Green, Corin Gurr, Gada Kadoda, MS Kutar, Martin Loomes, Chrystopher L Nehaniv, Marian Petre, et al. Cognitive dimensions of notations: Design tools for cognitive technology. In Cognitive Technology: Instruments of Mind, pages 325–341. Springer, 2001. [3] Michael Bostock and Jeffrey Heer. Protovis: A graphical toolkit for visualization.
IEEE Trans. Visualization & Comp. Graphics (Proc. InfoVis), 2009.
[4] Michael Bostock, Vadim Ogievetsky, and Jeffrey Heer. D3 data-driven
docu-ments. IEEE transactions on visualization and computer graphics, 17(12):2301– 2309, 2011.
[5] Jungu Choi, Deok Gun Park, Yuet Ling Wong, Eli Fisher, and Niklas Elmqvist. Visdock: A toolkit for cross-cutting interactions in visualization. IEEE transac-tions on visualization and computer graphics, 21(9):1087–1100, 2015.
[6] Gregory H Cooper and Shriram Krishnamurthi. Embedding dynamic dataflow in a call-by-value language. In Programming Languages and Systems, pages 294– 308. Springer, 2006.
[7] Joseph A Cottam and Andrew Lumsdaine. Stencil: a conceptual model for rep-resentation and interaction. In 2008 12th International Conference Information Visualisation, pages 51–56. IEEE, 2008.
[8] Jonathan Edwards. Coherent reaction. In Proc. ACM SIGPLAN, pages 925–932. ACM, 2009.
[9] Sumit Gulwani. Automating string processing in spreadsheets using input-output examples. In ACM Sigplan Notices, volume 46, pages 317–330. ACM, 2011. [10] William R Harris and Sumit Gulwani. Spreadsheet table transformations from
[11] Jane Hoffswell, Arvind Satyanarayan, and Jeffrey Heer. Visual debugging tech-niques for reactive data visualization. Computer Graphics Forum, 35(3):271–280, 2016.
[12] Jane Hoffswell, Arvind Satyanarayan, and Jeffrey Heer. Augmenting code with in situ visualizations to aid program understanding. In Proceedings of the 2018 CHI Conference on Human Factors in Computing Systems, CHI ’18, pages 532:1– 532:12, New York, NY, USA, 2018. ACM.
[13] Edwin L Hutchins, James D Hollan, and Donald A Norman. Direct manipulation interfaces. Human-computer interaction, 1(4):311–338, 1985.
[14] Sean Kandel, Andreas Paepcke, Joseph Hellerstein, and Jeffrey Heer. Wrangler: Interactive visual specification of data transformation scripts. In Proceedings of the SIGCHI Conference on Human Factors in Computing Systems, pages 3363– 3372. ACM, 2011.
[15] Nam Wook Kim, Eston Schweickart, Zhicheng Liu, Mira Dontcheva, Wilmot Li, Jovan Popovic, and Hanspeter Pfister. Data-driven guides: Supporting expres-sive design for information graphics. IEEE transactions on visualization and computer graphics, 23(1):491–500, 2016.
[16] Yang Li and James A Landay. Informal prototyping of continuous graphical in-teractions by demonstration. In Proceedings of the 18th annual ACM symposium on User interface software and technology, pages 221–230. ACM, 2005.
[17] William Lidwell, Kritina Holden, and Jill Butler. Universal principles of design, revised and updated: 125 ways to enhance usability, influence perception, increase appeal, make better design decisions, and teach through design. Rockport Pub, 2010.
[18] Zhicheng Liu and John T Stasko. Mental models, visual reasoning and interaction in information visualization: A top-down perspective. IEEE Trans. Visualization & Comp. Graphics, 16(6):999–1008, 2010.
[19] Zhicheng Liu, John Thompson, Alan Wilson, Mira Dontcheva, James Delorey, Sam Grigg, Bernard Kerr, and John Stasko. Data illustrator: Augmenting vec-tor design tools with lazy data binding for expressive visualization authoring. In Proceedings of the 2018 CHI Conference on Human Factors in Computing Systems, page 123. ACM, 2018.
[20] Michele Mauri, Tommaso Elli, Giorgio Caviglia, Giorgio Uboldi, and Matteo Azzi. Rawgraphs: a visualisation platform to create open outputs. In Proceedings of the 12th Biannual Conference on Italian SIGCHI Chapter, page 28. ACM, 2017.
[21] Honghui Mei, Yuxin Ma, Yating Wei, and Wei Chen. The design space of con-struction tools for information visualization: A survey. Journal of Visual Lan-guages & Computing, 44:120–132, 2018.
[22] Gonzalo Gabriel Méndez, Miguel A Nacenta, and Sebastien Vandenheste. ivolver: Interactive visual language for visualization extraction and reconstruction. In Proceedings of the 2016 CHI Conference on Human Factors in Computing Sys-tems, pages 4073–4085. ACM, 2016.
[23] Brad Myers, Scott E Hudson, Randy Pausch, and Randy Pausch. Past, present, and future of user interface software tools. ACM Transactions on Computer-Human Interaction (TOCHI), 7(1):3–28, 2000.
[24] Stephen Oney, Brad Myers, and Joel Brandt. Interstate: a language and environ-ment for expressing interface behavior. In Proceedings of the 27th annual ACM symposium on User interface software and technology, pages 263–272. ACM, 2014.
[25] William A Pike, John Stasko, Remco Chang, and Theresa A O’Connell. The science of interaction. Information Visualization, 8(4):263–274, 2009.
[26] D. Ren, T. Höllerer, and X. Yuan. ivisdesigner: Expressive interactive design of information visualizations. IEEE Transactions on Visualization and Computer Graphics, 20(12):2092–2101, Dec 2014.
[27] Donghao Ren, Bongshin Lee, and Matthew Brehmer. Charticulator: Interactive construction of bespoke chart layouts. IEEE transactions on visualization and computer graphics, 25(1):789–799, 2018.
[28] Bahador Saket and Alex Endert. Investigating the manual view specification and visualization by demonstration paradigms for visualization construction. In Computer Graphics Forum, volume 38, pages 663–674. Wiley Online Library, 2019.
[29] Bahador Saket, Lei Jiang, Charles Perin, and Alex Endert. Liger: Combining interaction paradigms for visual analysis. arXiv preprint arXiv:1907.08345, 2019. [30] Bahador Saket, Hannah Kim, Eli T Brown, and Alex Endert. Visualization by demonstration: An interaction paradigm for visual data exploration. IEEE transactions on visualization and computer graphics, 23(1):331–340, 2016. [31] Arvind Satyanarayan and Jeffrey Heer. Lyra: An interactive visualization design
environment. In Computer Graphics Forum, volume 33, pages 351–360. Wiley Online Library, 2014.
[32] Arvind Satyanarayan, Bongshin Lee, Donghao Ren, Jeffrey Heer, John Stasko, John Thompson, Matthew Brehmer, and Zhicheng Liu. Critical Reflections on Visualization Authoring Systems. IEEE Trans. Visualization & Comp. Graphics (Proc. InfoVis), 2020.
[33] Arvind Satyanarayan, Dominik Moritz, Kanit Wongsuphasawat, and Jeffrey Heer. Vega-lite: A grammar of interactive graphics. IEEE transactions on visu-alization and computer graphics, 23(1):341–350, 2016.
[34] Arvind Satyanarayan, Ryan Russell, Jane Hoffswell, and Jeffrey Heer. Reactive vega: A streaming dataflow architecture for declarative interactive visualization. IEEE transactions on visualization and computer graphics, 22(1):659–668, 2015. [35] Arvind Satyanarayan, Kanit Wongsuphasawat, and Jeffrey Heer. Declarative interaction design for data visualization. In Proceedings of the 27th annual ACM symposium on User interface software and technology, pages 669–678. ACM, 2014.
[36] Chris Stolte, Diane Tang, and Pat Hanrahan. Polaris: A system for query, anal-ysis, and visualization of multidimensional relational databases. IEEE Transac-tions on Visualization and Computer Graphics, 8(1):52–65, 2002.
[37] Chris Weaver. Building highly-coordinated visualizations in improvise. In Pro-ceedings of the IEEE Symposium on Information Visualization, INFOVIS ’04, pages 159–166, Washington, DC, USA, 2004. IEEE Computer Society.
[38] Ji Soo Yi, Youn ah Kang, John T Stasko, and Julie A Jacko. Toward a deeper understanding of the role of interaction in information visualization. IEEE Trans-actions on Visualization and Computer Graphics, 13(6):1224–1231, 2007.