HAL Id: insu-01382415
https://hal-insu.archives-ouvertes.fr/insu-01382415
Submitted on 17 Oct 2016HAL is a multi-disciplinary open access archive for the deposit and dissemination of sci-entific research documents, whether they are pub-lished or not. The documents may come from teaching and research institutions in France or abroad, or from public or private research centers.
L’archive ouverte pluridisciplinaire HAL, est destinée au dépôt et à la diffusion de documents scientifiques de niveau recherche, publiés ou non, émanant des établissements d’enseignement et de recherche français ou étrangers, des laboratoires publics ou privés.
Developing a method for identification of net zones
using log data and diffusivity equation
Pedram Masoudi, M Tokhmechi, A Zahedi, M Jafari
To cite this version:
Pedram Masoudi, M Tokhmechi, A Zahedi, M Jafari. Developing a method for identification of net zones using log data and diffusivity equation. JME Journal of Mining &Environment, 2011, 2 (1), pp.53 - 60. �insu-01382415�
JME
Journal of Mining &Environment, Vol.2, No.1, 2011, 53-60.
Developing a method for identification of net zones using log data and
diffusivity equation
P. Masoudi
1, B. Tokhmechi
1*, A. Zahedi
2, M. Ansari Jafari
11. Faculty of Mining, Petroleum and Geophysics Engineering, Shahrood University of Technology; Shahrood, Iran 2. California State Professional Engineer
Received 14 May 2011; received in revised form 10 Sep 2011; accepted 30 Oct 2011
*Corresponding author: [email protected]
Abstract
Distinguishing productive zones of a drilled oil well plays a very important role for petroleum engineers to decide where to perforate to produce oil. Conventionally, net pay zones are determined by applying a set of cut-offs on perophysical logs. As a result, the conventional method finds productive intervals crisply. In this investigation, a net index value is proposed, then; diffusivity equation is utilized to calculate the proposed index value. The new net determination method is applied on the interval of Sarvak Formation of two datasets of two nearby wells. The best advantage of this newly developed net determination method is its fuzzy output. Fuzzy net pay determination is valuable in grading pay zones and not classifying all productive zones in a single class. Another advantage of the proposed net determination method is its higher accuracy in identifying productive zones in comparison with cut-off based method.
Keywords:net pay, net reservoir, diffusivity equation, fuzzy, petroleum exploration. 1. Introduction
Indirect techniques for determining productive zones are mainly based on wire-line log data, which are acquired by the sondes run in the exploratory well(s). Historically, researchers have tried to locate anomalous zones by using and comparing the high and low readings of different wire-line log data at the certain depth, and use obtained results of these comparisons as a tool to classify the gross interval into net pay and non-net pay intervals. As Snyder used the combination of gamma and resistivity logs to determine net pays [1], and Flower used sonic-shear-wave and resistivity logs for determination of the same [2]. In another paper, formation pressure tester is introduced as a quick-look indicator of net pay zones [3]. In 1998; Deakin and Manan fulfilled an investigation on detection of low contrast pays in a gas reservoir by applying petrophysical relations on an integrated dataset [4]. There is a comprehensive investigation on low-resistivity
pay zones by Worthington that has classified low-resistivity pays to six classes due to dominated geological features [5].
In 2000, Svec and Grigg made use of net pays in reservoir volume estimation and determining effective permeability value [6]. Mathur et al. incorporated geochemical analysis of side-wall cores in net pay detection for the first time [7]. Cut-off of petrophysical parameters (porosity, shale volume and water saturation) is the most famous tool for determining net pays. In 2005, Worthington and Cosentino provided a comprehensive study on the role of cut-offs in determining net pays. They collected and summarized different combinations of cut-offs of shale volume, porosity, permeability, water saturation, resistivity and moveable hydrocarbon index (MHI), which are used in 31 previous investigations from 1980 to 2002. In this paper, it is concluded that there is no unique method to
Masoudi et al./ Journal of Mining & Environment, Vol.2, No.1, 2011
54
identify petrophysical cut-offs and therefore net pays. That is, cut-off of different petrophysical features may lead to different identification of net pays. Then, as it is shown in the paper, the selection of petrophysical features should be as regards as the purpose of using net pay [8]. Jensen and Menke introduced a statistical method to determine cut-offs in a way to minimize error of calculating net to gross ratio [9]. Worthington has also published a valuable paper that determines cut-offs dynamically with regard to depletion strategy [10]. Singleton is the first researcher who has investigated detection of pay zones on the seismic sections rather than wire-line well logs [11]. By this time, the latest paper about net pays was published by Worthington in 2010. In this paper, a definition on different nets, especially net pay, is provided and the application of net pay in petroleum industry is discussed [12]. There are other investigations in determining productivity of wells too, that are not related to main subject of this paper; e.g. in a paper, well efficiency index has been introduced as an index of productivity in horizontal wells [13].In the foregoing literature, net pay zones are determined crisply, i.e. the result of conventional net pay determination methods is either pay or non-pay. But in this investigation, a new method is proposed and developed to determine net pays fuzzily to compare different intervals due to a productivity index and give a priority grade to each of them.
2. Definition of Net Pay and Net Reservoir Despite lack of a comprehensive idea about definition of nets and net pay, the used classification is provided by [12]. In this classification, total evaluation interval is called gross rock while potential reservoir is named net sand, which does not contain evaporates, mudstone, unfractured basement, etc. Consequently, net reservoir is defined as a part of net sand that has supracritical amounts of porosity and permeability. Finally, net pay is some parts of net reservoir that contain supracritical amounts of recoverable hydrocarbons [12]. Furthermore, net pay is a zone that can produce hydrocarbons.
3. Dataset
Dataset of this investigation is a combination of core derived data, well tests and logging outputs. They are acquired in two nearby wells, on the same oil field, which is located in south-west of Iran. The intervals of this investigation are within
Sarvak Formation that is a carbonate type reservoir rock. The results of the proposed method in these two wells are compared with well test results. Core derived data, used in this article, are porosity, permeability, viscosity and compressibility of fluid contents of core samples. There are also three production tests in each well to compare the results of the proposed method with those of the conventional methods.
4. Methodologies: Net Pay Determination 4.1. Conventional Method (Based on Cut-offs) As it is reported in the literature, conventional method for net pay determination is applying some cut-off criteria on wire-line well log data. To further study conventional net pay determination (cut-off-based methods), see [4, 6, 8, 12]. In this part of work, determination of net pay zones is based on conventional method, and the process is shown in Figure 1.
4.2. Proposed Method (Based on Diffusivity Equation)
If a net pay zone has a greater flow rate in comparison to the other net pay zone, we can rank the first zone in a higher grade in comparison to the second one. Pressure is an important parameter causing fluid flow in hydrocarbon reservoirs as it can be inferred from Darcy’s law. In the proposed method, division of flow rate by pressure difference is introduced as an index for net pay determination, after that, this index is calculated from diffusivity equation.
Diffusivity equation is designed to determine the pressure as a function of time and distance from the well for a radial flow regime of slightly compressible fluids. The field form of diffusivity equation is:
(1)
where p is pressure (psia), r means distance from well axis (ft), t is time (hrs), φ is porosity (in fraction), k is permeability (mD), μ is viscosity (cp), c is total compressibility (psi-1 ). One of the solutions of diffusivity equation is Ei-function solution that after solving diffusivity equation by this function solution method, the formula that follows will be reached:
55
Figure1. The process of conventional net reservoir and net pay determination
where p(r,t) means pressure at radius r from the well after t seconds in psia, t is time (hrs), k is permeability (mD), Q0 is flow rate, (rb/day) and h
is pay zone (ft). In addition to the limitations of diffusivity equation, some other limitations, for availability of Ei-function solution, should be
considered [14]: homogeneous porous medium; uniform thickness; single phase flow; small and constant compressibility. Also the amount of input value of logarithm should not exceed 0.01 (equation 3) so that the amount of approximation error would be less than 0.25% [15].
(3)
By replacing pressure drop value with indicator p(r,t), and dividing both sides of equation 2 by flow rate variable, the modified equation will be as follows:
(4)
The fraction of ∆p/ Q0 is considered as the index
of net reservoir. This net reservoir index can be calculated simply by reversing final result of equation 4: Viscosity and compressibility values are given from core test reports of NIOC; the variable h is well log data interval; porosity and permeability values are derived from core test reports and by training an Artificial Neural Network (ANN), porosity and permeability are estimated for non-cored intervals; the amount of distance from well axis, r and time, t are considered 5 ft. and 5000 hrs respectively due to limitation, imposing from equation 3. The process
of proposed net pay determination is shown in Figure 2.
5. Results
By applying the above processes on available datasets of wells, water saturation, porosity and permeability are estimated. Porosity and permeability are estimated by ANN. Figures 3 and 4 show estimation cross plots in detail.
After estimation of water saturation, porosity and permeability, net pay and net reservoir are determined by two processes introduced previously in two wells and the results are compared with those of the well tests. In well No.1, there are three production test data for comparing the results of the proposed and conventional methods. The first test was applied on the interval of 2806m to 2821m, which resulted in producing oil and gas, from 2000 (bbl oil)/day to more; second interval (2928m-2938m) produced oil and gas too but less than 1000(bbl oil)/day; and the third interval produced mixture of salt water and oil. Net pay results of these intervals are shown in Figure 5.
The conventional and proposed methodologies are applied on well test intervals of another well-log dataset (the well No.2) too. In this well, again the results of conventional and proposed net pay determinations are compared in three production test intervals. The first production test belongs to the interval of 2654m-2664m, and the result was oil production with the rate more than 3000(bbl oil)/day. The second production test is applied on the interval of 2765m-2778m.
The oil production rate in this interval is less than 1000(bbl oil)/day, similar to the second
Masoudi et al./ Journal of Mining & Environment, Vol.2, No.1, 2011
56
production test of the well No.1. Finally, in the third production test interval (2985m-3005m), there was no oil production, again similar to the third well test of the well No.1. The results of netpay determination by two different methodologies in these three intervals are shown in Figure 6.
Figure2. The process of proposed net reservoir and net pay determination
Figure3. Cross plots of porosity estimation by ANN with 167 neurons in the hidden layer. Training method is scaled conjugate gradient backpropagation, and transfer functions are tangent sigmoid. a) trained data set, b) validation dataset, c) test dataset and d) whole the porosity dataset
57
Figure4. Cross plots of permeability estimation by ANN with 127 neurons in the hidden layer. Training method is scaled conjugate gradient backpropagation, and transfer functions are tangent sigmoid.a) trained data set, b) validation dataset, c) test dataset and d) whole the permeability dataset
6. Discussion
There are two differences between these two methodologies. The first difference is the way that they show the results, (i.e. the proposed method shows the results fuzzily, whereas conventional method shows them crisply), and the second is accuracy difference of the results.
As it is clear in above figures, the result of conventional method is only one or zero. This method is crisp and cannot differ between good and best, or bad and worst. But in the proposed method, different depths can be graded due to the output (i.e. fuzzy pay determination).
The second difference, which is higher accuracy of the proposed method in comparison to the conventional method, can be proved by assuming average operator as an indicator in each interval. By averaging the net pay indices of each interval, calculated by two methodologies, these intervals can be graded in each well. The results of averaging net indices in two wells are provided in Table 1 and 2, and a ranking based on them is shown in Tables 3 and 4.
Using the results of conventional method, it is difficult to give priority to each of well test intervals of the well No.1. But Table 3 shows that
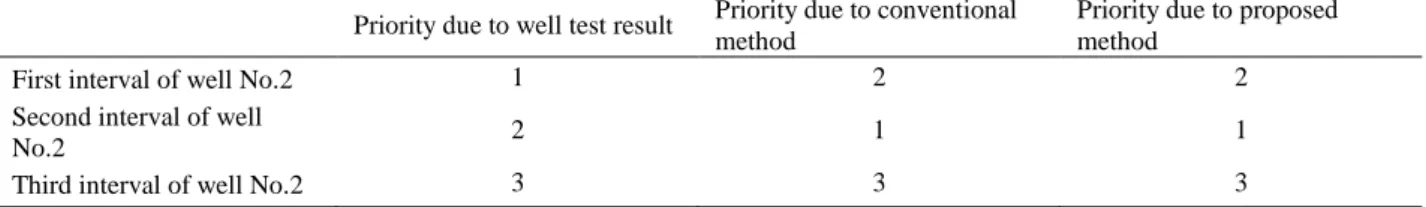
the first interval has the first priority, the third interval has the second priority, and the second interval has the third priority. This priority setting is not fully compatible with the results of well tests. But grading these intervals by the results of the proposed method is fully compatible with the priority, resulted from well tests (Table 3). To grade three well test intervals of the second well, the conventional and proposed methodologies unanimously give priority to the second interval, then to the first interval, and at last, to the third interval, which is not fully compatible with well test results.
Newly developed method is completely compatible with well test results in the first well, while conventional method is not compatible, and even has a fatal error in giving priority to the intervals. Besides, giving priority to the intervals by average values of conventional method in the first well is not really credible due to the closenessof the values. In the second well, the priority of intervals by these two methodologies is the same. Although this order is not fully compatible with well test results, there is no sign that shows conventional method is more accurate than proposed method. Furthermore, by assuming all the aspects, the proposed method is more accurate in comparison to the conventional one.
Masoudi et al./ Journal of Mining & Environment, Vol.2, No.1, 2011
58
Figure5. Comparison of net pay values, calculated by two different methodologies, in the well test intervals of the well No.1. The first method, which is based on cut-off values proposed by NIOC, is shown in the left tracks, and the second method based on proposed method is shown in right tracks: a) belongs to the first well test interval, b) belongs to the second well test interval, c) belongs to the third well test interval.
Figure6. Comparison of net pay values, calculated by two different methodologies, in the well test intervals of the well No.2. First method, which is based on cut-off values proposed by NIOC, is shown in the left tracks, and second method based on proposed method is shown in right tracks: a) belongs to the first well test interval, b) belongs to the second well test interval, c) belongs to the third well test interval
59
Table 1. Average of net pay index in well No.1
Average of net pay in conventional method Average of net pay in proposed method
First interval of well No.1 0.970 0.113
Second interval of well No.1 0.924 0.017
Third interval of well No.1 0.960 0.008
Table 2. Average of net pay index in well No.2
Average of net pay in conventional method Average of net pay in proposed method
First interval of well No.2 0.773 0.008
Second interval of well No.2 0.988 0.149
Third interval of well No.2 0.504 0.000
Table 3. Priority of well test intervals of the well No.1 due to production index of three different net pay determination methods: well test, conventional (cut-off based) and proposed method
Priority due to well test result Priority due to conventional method
Priority due to proposed method
First interval of well No.1 1 1 1
Second interval of well
No.1 2 3 2
Third interval of well No.1 3 2 3
Table 4. Priority of well test intervals of the well No.2 due to production index of three different net pay determination methods: well test, conventional (cut-off based) and proposed method
Priority due to well test result Priority due to conventional method
Priority due to proposed method
First interval of well No.2 1 2 2
Second interval of well
No.2 2 1 1
Third interval of well No.2 3 3 3
7. Conclusion
There are three benefits and one drawback in utilizing the proposed method. The advantages are:
• This newly developed method results in a fuzzy identification of net values; then, permits users to grade net zones due to net index values.
• In this oil field, flow equation-based method is more compatible with well test results compared with cut-off-based method, hence it is more accurate.
•The proposed method utilizes some additional parameters (permeability, viscosity and compressibility) to determine productive zones in comparison with conventional method that leads to more comprehensive results.
The drawback of the proposed method in determining net pays is that this method is not valid in all kinds of reservoirs. The limitations of this method are: homogeneous porous medium;
uniform thickness; single phase flow; small and constant compressibility. Hence, it is not valid in some occasions, especially in gaseous reservoirs or highly fractured ones.
• The suggested methodology needs some core information that is not available in lots of boreholes.
Acknowledgment
The authors wish to thank Exploratory Directorate of Nationality Iranian Oil Company (NIOC) for providing data for this investigation and their permission in publishing scientific results. Also, would like to thank anonymous reviewers for their valuable comments that improved quality of this work.
References
[1]. Snyder, R.H. (1971). A review of the concepts and methodology of determining "net pay". in Fall Meeting
Masoudi et al./ Journal of Mining & Environment, Vol.2, No.1, 2011
60
of the Society of Petroleum Engineers of AIME1971, New Orleans, Louisiana.[2]. Flower, J.G. (1983). Use of sonic-shear-wave/resistivity overlay as a quick-look method for identifying potential pay zones in the Ohio (Devonian) shale. Society of Petroleum Engineers. Journal of Petroleum Technology. 35(3): 638-642.
[3]. Cooke-Yarborqugh, P. (1984). Reservoir analysis by wireline formation tester: pressures, permeabilities, gradients and net pay. The Log Analyst.15(6): 36-46. [4]. Deakin, M. and Manan, W. (1998). The integration of petrophysical data for the evaluation of low contrast pay.Society of Petroleum Engineers. Asia Pacific Conference on Integrated Modelling for Asset Management, Kuala Lumpur, Malaysia: 327-339. [5]. Worthington, P.F. (2000). Recognition and evaluation of low-resistivity pay. Petroleum Geoscience. 6(1): p. 77-92.
[6]. Svec, R.K. and Grigg, R.B. (2000). Reservoir characterization and laboratory studies assessing improve oil recovery methods for the Teague-Blinebry field.Society of Petroleum Engineers.SPE Permian Basin Oil and Gas Recovery Conference, Midland, Texas.
[7]. Mathur, N., Raju, S.V. and Kulkarni, T.G. (2001). Improved identification of pay zones through integration of geochemical and log data: a case study from upper Assam basin, India. AAPG Bulletin. 85(2): p. 309-323.
[8]. Worthington, P.F. and CosentinoL. (2005). The role of cut-offs in integrated reservoir studies. SPE Reservoir Evaluation & Engineering. 8(4): 276-290. [9]. Jensen, J.L. and Menke, J.Y. (2006). Some statistical issues in selecting porosity cutoffs for estimating net pay. PetroPhysics. 47(4): 315–320. [10]. Worthington, P.F. (2008). The application of cutoffs in integrated reservoir studies. SPE Reservoir Evaluation & Engineering,. 11(6): 968-975.
[11]. Singleton, S. (2008). The use of seismic attenuation to aid simultaneous impedance inversion in geophysical reservoir characterization. The Leading Edge. 27(3): 398-407.
[12]. Worthington, P.F. (2010). Net pay-what is it? What does it do? How do we quantify it? How do we use it? SPE Reservoir Evaluation & Engineering. 13(5): 812-822.
[13]. Mostafazadeh, M.,Mousavi, S. A., Ghadami, N. and Aghdasinia, H. (2010). The productivity estimation of designed horizontal oil and gas wells before a drilling operation, using seismic and petrophysical parameters and modeling. Petroleum Science and Technology. 28(18): 1863-1877.
[14]. Matthews, C.S. and RussellD.G. (1967). Pressure buildup and flow tests in wells. Society of Petroleum Engineers of AIME.
[15]. Ahmed, T. (2001). Reservoir engineering handbook. 2nd Edition. Gulf Professional PublishingBoston.
[16]. Johnson, D.E. and PileK.E. (2002). Formation parameters, in well logging in nontechnical language. Penn Well Publishing Company, Tulsa: 25-44.
[17]. Darling, T. (2005). Quicklook log interpretation, in well logging and formation evaluation. Gulf Professional Publishing, Burlington: 29-48.