HAL Id: hal-02141785
https://hal.sorbonne-universite.fr/hal-02141785
Submitted on 28 May 2019HAL is a multi-disciplinary open access archive for the deposit and dissemination of sci-entific research documents, whether they are pub-lished or not. The documents may come from teaching and research institutions in France or abroad, or from public or private research centers.
L’archive ouverte pluridisciplinaire HAL, est destinée au dépôt et à la diffusion de documents scientifiques de niveau recherche, publiés ou non, émanant des établissements d’enseignement et de recherche français ou étrangers, des laboratoires publics ou privés.
Structure and stability of silicene on Ag(111)
reconstructions from grazing incidence x-ray diffraction
and density functional theory
A. Curcella, Romain Bernard, Y. Borensztein, A. Resta, M. Lazzeri, G. Prévôt
To cite this version:
A. Curcella, Romain Bernard, Y. Borensztein, A. Resta, M. Lazzeri, et al.. Structure and stability of silicene on Ag(111) reconstructions from grazing incidence x-ray diffraction and density functional theory. Physical Review B: Condensed Matter and Materials Physics (1998-2015), American Physical Society, 2019, 99 (205411), �10.1103/PhysRevB.99.205411�. �hal-02141785�
Structure and stability of silicene on Ag(111) reconstructions, from grazing incidence X-ray diffraction and density functional theory
A. Curcella,1 R. Bernard,1 Y. Borensztein,1 A. Resta,2 M. Lazzeri,3 G. Prévot1
1
Sorbonne Université, CNRS, Institut des NanoSciences de Paris, INSP, F-75005, Paris, France
2
Synchrotron SOLEIL, L’Orme des Merisiers Saint-Aubin–BP 48 91192 Gif-sur-Yvette CEDEX
3
Sorbonne Université, CNRS UMR 7590, MNHN, IRD, Institut de Minéralogie, de Physique des Matériaux et de Cosmochimie, F-75252, Paris, France
Abstract
Using grazing incidence X-ray diffraction (GIXD) and density functional theory (DFT), we have studied the silicene reconstructions on Ag(111). We propose a comprehensive discussion of all nonequivalent configurations for the (44), (2 32 3)R30, ( 13 13)R13.9- type
I and ( 13 13)R13.9- type II reconstructions, putting in evidence their relative stability.
We show that assuming a p3 symmetry leads to a total of 12 inequivalent reconstructions, that can be labeled according to an original notation, which specifies the occupation of the p3-symmetry Wyckoff positions by the Si atoms of the silicene unit cell and by the Ag atoms of the first three substrate layers. The DFT calculations are in good agreement with the experimental results, and report that the structures energetically most favorable are those which best reproduce the measured scanning tunneling microscopy images and the GIXD structure factors. These configurations are also those inducing the highest deformation in the substrate, suggesting that the interaction between silicene and Ag can be held to be responsible for the unexpected stability of the 2D silicon layer.
2
1. Introduction
Silicene, a one-atom thick sheet of silicon atoms, has been widely studied in the last decade, since initial works based on density functional theory (DFT) [1,2] have predicted the existence of a free-standing (FS) metastable configuration, where Si atoms are hexagonally organized, and which should possess Dirac cones at the Fermi level and a high electrical conductivity. Experimentally, due to the lack of a graphitic form of silicon, silicene needs to be synthesized by deposition on a substrate. Successful two-dimensional Si growth has been firstly reported on a Ag(111) surface [3,4], which remains up to now the most studied substrate. At first, angular resolved photoemission spectroscopy (ARPES) measurements assigned dispersive states at the K-K’ points of the Brillouin zone to the Dirac cones of silicene [4]. However, further studies have put in evidence a strong band hybridization with the substrate and a metallic behavior of the system [5–18]. This interpretation is nowadays well-accepted. The growth process and the stabilization of the Si monolayer have also been studied. It has been found that Si atoms do not simply deposit onto Ag surface, but insert in it, which results in the ejection of atoms from the substrate [19–21]. This can be regarded as another signature of the significant interplay between Si and Ag. Depending on growth temperature and deposition rate [19,22], the Si layer on Ag(111) is made of patches of different structures: a coexistence of mainly (44) and ( 13 13)R13.9 reconstructions is observed at low temperature (Tgrowth ~
500 K), while at high temperature (Tgrowth > 540 K), the layer is mainly composed of
2 3) 30 3
2
( R domains [22–26]. These labels refer to the reconstruction periodicity with
respect to the Ag(111) surface unit cell. The presence of long-range order structures, namely
133) 4.3 133
( R and ( 427 427)R7.2, has been reported concurrently with
13) 13.9 13
( R and (2 32 3)R30, respectively [27–29]. All of these structures are
interpreted as low-buckled hexagonal Si arrangements. This is confirmed by tip-enhanced raman spectroscopy where each phase can be associated with a specific raman signature [45].
Another structure, namely the 30 3 4 3 4
R , also known as
3 3
R30 when referred toa Si(111) plane, was initially assigned to a silicon monolayer [30,31]. Later, it has been revealed that this reconstruction corresponds to the termination of a thicker film, with a defective bulklike Si structure [25,32–37].
growth temperature and Si deposition rate [22,34,38]. Its structure and the related relaxation of the substrate have been determined by combined DFT calculations and experimental measurements, employing diffraction, scanning tunneling microscopy (STM) and atomic force microscopy (AFM) [4,17,26,39–43]. These measurements confirmed the model proposed by Vogt et al., in which 1/3 of the 18 atoms in the unit cell of silicene, which is a (33) cell with respect to one Si(111) plane, are higher with respect to the other Si atoms of about 0.76 Å [26]. The(2 32 3)R30 and ( 13 13)R13.9 reconstructions have also been thoroughly
investigated. They are both obtained from a ( 7 7)R19.1 silicene cell of 14 atoms placed
onto the respective substrate cells. It has been shown that long-range order superstructures can be seen as periodic relaxation of the strain or compression accumulated in large
2 3) 30 3
2
( R and ( 13 13)R13.9 domains. This relaxation can also induce a deviation
from the superstructure angle and its average periodicity [27,44]. The ( 13 13)R13.9 has
been categorized in type I and type II depending on the angle 'R formed between the silicene
lattice and the silver substrate (33° or 5.2°).
Available literature focuses on specific configurations. For example, Johnson et al. [11] discuss the three different atomic arrangements only for type II, focusing on their band structure; Liu et al. [22] report two configurations for type II and one for type I, in order to explain some structures observed by STM. AFM experiments have also been done on the type
II reconstruction [46]. It must be noticed that while type II is found to grow in large crystalline
domains [20,26,47], type I configuration, also known as “dotted phase”, is not always completely ordered or oriented along the same axis [19,23,48], so much so, it is occasionally referred to as (3.53.5)R26 [49]. Concerning the (2 32 3)R30 reconstruction, some
groups argued whether this reconstruction is due or not to Ag-Si subsurface alloy, but Qiu et al. [50] have shown its pure silicon nature by means of hydrogenation.
In spite of the many studies already done, literature still lacks a quantitative diffraction study aiming at identifying the exact atomic structures of these reconstructions and the induced substrate relaxations. This kind of study is still highly desirable, as already pointed out by Takagi et al. [9]. A systematic study of all the possible structures having the periodicity observed in diffraction studies is also appropriate.
With this goal, here, we present the results of combined DFT calculations and grazing incidence measurements (GIXD). We propose a comprehensive discussion of all nonequivalent configurations for the (44), (2 32 3)R30, ( 13 13)R13.9- type I and
4
13) 13.9 13
( R - type II reconstructions, putting in evidence their relative stability. On the
basis of symmetry considerations, we show that each reconstruction may be associated with 3 different atomic configurations, given by the superposition of the three-fold rotation axes of the layer and the substrate. The equilibrium atomic positions obtained by DFT are used to simulate theoretical structure factors which are compared to the experimental ones, in order to determine which structure is indeed observed experimentally. We show that the most stable configurations according to DFT correspond to those observed in the measurements, and that they are generally stabilized by stronger interactions with the substrate.
2. Experimental and computational details 2.1 Experiments
GIXD experiments have been performed on the SIXS beamline of SOLEIL synchrotron. The Ag(111) sample was prepared by several cycles of Ar+ sputtering followed by annealing at
870 K. Si was evaporated in the diffraction chamber (base pressure 4.10-10 Torr) from a Si rod
using a commercial e-beam evaporator. From surface differential reflectance spectroscopy measurements [51], we estimated that the deposition rate was 1 ML/2700s. The sample was analyzed with 18 keV X-rays at a grazing incidence angle of either 0.145° or 0.19°. Diffracted X-rays were detected with either a point detector or a XPAD hybrid pixel detector [52]. In the following, the ( kh, ) indices used for indexing a reflection in reciprocal space refer to the
silicene basis of the diffracting domain. The third index l has been set identical to the one associated with the Ag(111) surface basis (with c axis of norm 7.075 Å). Structure factors were acquired by performing rocking scans around (h,k,l) conditions, integrating the profile
of the rocking scans, and applying standard instrumental corrections for taking into account the geometry of the diffractometer [53]. q and // q are the norm of the in-plane and out-of-plane
components of the wave vector transfer.
2.2 Simulations
The DFT calculations have been performed using the Quantum ESPRESSO package [54].
The exchange and correlation functional is simulated in the framework of the generalized
density approximation for the (44) reconstruction [26]. The electron-ion interaction is described within the projector-augmented-wave (PAW) method [56]. The one-particle wave
functions are expanded in plane waves, up to a cutoff energy of 30 Ry; the cutoff for charge is
set to 240 Ry. The Ag(111) substrate is simulated by a four layers slab; the equilibrium lattice
constant found for fcc Ag is 4.151 Å. The atomic positions of both silver substrate and silicon
overlayer are allowed to relax until the forces are below 10-3 Ry/Bohr, at exception of the
bottom Ag layer (the in-plane lattice spacing is fixed at the equilibrium theoretical value). BZ
k-point sampling is done with 0.025 Ry Gaussian smearing and grids as dense as the 661
used for the (44) reconstruction. Van der Waals corrections are not expected to produce major changes in the equilibrium structures as reported in refs. [18,26]. Each slab is separated
by a 20 Å thick region of vacuum, enough to avoid interactions between periodic slabs along
the z direction. Dipole corrections have been tested in similar systems and they are reported to
be negligible, and consequently, have been neglected here [34,54]. STM simulations were
done using the Tersoff-Hamann approach [57], by integrating the local density of states up to
an energy U above the Fermi level and, then, by determining the height of the surface at
constant integrated density.
2.3 Comparison between experiments and simulations
For comparing experimental structure factors to those derived from the DFT computation, scale and Debye-Waller factors have been added as free parameters for fitting the experimental results. For simplicity, we have used only four different values of the Debye-Waller factors, corresponding to in-plane or out-of-plane components, for Si or for Ag atoms. The values of the Debye-Waller factors used for the fits are given in the Supplemental Material Table S1.
The agreement between experimental (Fexp) and simulated (F ) structure factors is estimated th
by the value of 2 exp exp th par pts 2 Pts 1
N F F N N where Npts is the number of experimental
6
uncertainty, which takes into account the statistical uncertainty given by the number of counted photons and an overall 10% uncertainty.
3. Results
3.1 DFT calculations
The several reconstructions reported for silicene/Ag(111) correspond to different orientations of the Si layer with respect to the Ag substrate (see Fig. 1). The (44) reconstruction is obtained by superimposing a (33) cell of silicene onto a (44) cell of Ag(111), keeping the same orientation for the two lattices. The ( 13 13)R13.9 reconstruction is obtained by
superimposing a ( 7 7)R19.7 cell of silicene onto a ( 13 13)R13.9 cell of Ag(111). In
that case, the silver and silicene lattices have a relative orientation R'13.919.7. We label
as ( 13 13)R13.9 type I and type II the structures with R'33.01 and R'5.21
orientation, respectively [12,41,48]. Lastly, the (2 32 3)R30 reconstruction corresponds
to a ( 7 7)R19.7 cell of silicene. In that case, the silver and silicene lattices have a relative
orientation R'10.89, which, due to symmetry reasons, leads to only one configuration.
Without any symmetry considerations, the number of possible configurations for these reconstructions is infinite, as we do not know a priori the relative position of the silicene and silver lattices. However, assuming that the obtained structures possess a p3 symmetry, only a few non-equivalent configurations are obtained for each reconstruction. For a lattice with p3 unit cell, there are only three high symmetry points, labeled by the Wyckoff positions [58] a,
b, c (see Fig. 2a). These positions must thus match with similar high symmetry points of the
silicene and silver surface lattices that belong to the p3m1 space group. Thus, the three Wyckoff positions are necessarily occupied by an Ag atom of the first, second or third layer (Fig. 2b); on top of them there can be either an atom of the hexagonal Si lattice or the center of an hexagonal Si ring (Fig. 2c). In this way each reconstruction can be indicated also with three labels corresponding to the three Wyckoff positions a, b, c, respectively. Each label specifies the position of the Si lattice with respect to that particular Wyckoff position (t and t' correspond to the two Si atoms of the hexagonal lattice, h to the center of the hexagonal Si ring). A subscript will indicate to which layer belongs the Ag atom in that position, starting from the surface.
Using these definitions, it is possible to label a specific structure using a combination of the standard notation, the angle between the silicene and silver lattices, and the positions of Ag and Si atoms at the Wyckoff positions.
8
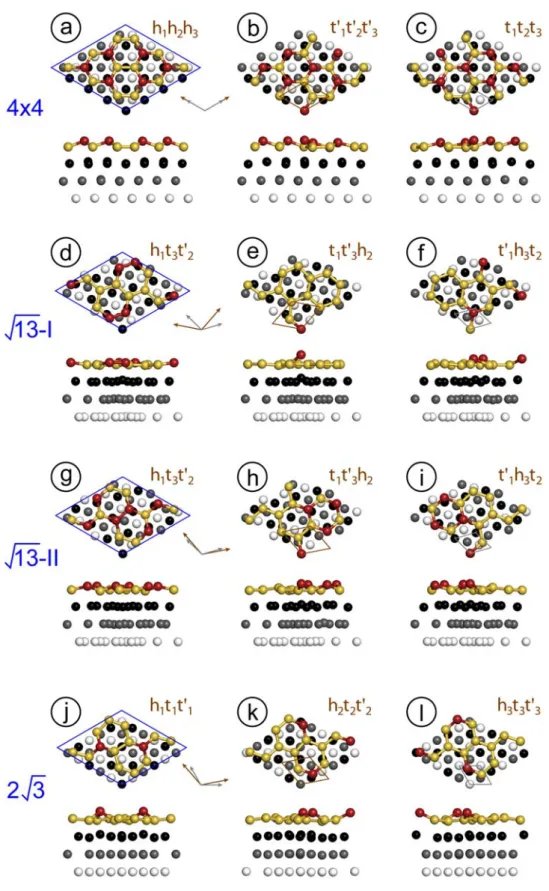
Fig. 1: Relaxed atomic positions for the computed superstructures. The supercell is indicated in blue, the silver and silicene unit cells in grey and brown respectively. They are drawn separately for clarity. The labels 13 and 2 3 stand for ( 13 13)R13.9 and
2 3) 30 3
2
( R reconstructions. Black, grey and white dots represent Ag atoms in different
Figure 2. a) Representation of the Wyckoff positions for a unit cell of the p3-space group. b) Wyckoff positions for the atoms of the first three Ag(111) planes in the Ag unit cell, corresponding to labels 1-3. c) occupation of the Wyckoff sites by Si atoms in the silicene unit cell, corresponding to labels h, t and t'.
For example, the well-know (44) reconstruction could be written as (44)R0R'0h1h2h3, meaning that the three Wyckoff positions of the p3 lattice correspond to the centers of three hexagonal Si rings positioned on the top of three Ag atoms belonging to the first, second, and third layers, respectively. Note that there is a large redundancy in the notation since knowing the positions of Si and Ag at the given Wyckoff position fixes the values at the other points. Moreover, structures may be equivalent due to the presence of symmetry planes for the surface. For example, ( 13 13)R13.9R'5.21h1t3t'2 and ( 13 13)R13.9R'5.21h1t3t'2 are
equivalent.
For each of the studied reconstructions, we have found 3 non-equivalent possible structures with p3 symmetry. Each configuration differs from the others by a translation, along the [112] axis of the Ag crystal, of the silicene plane with respect to the substrate, equal to dAg / 3 where dAg is the surface lattice parameter. In table 1, we resume the main geometrical
10
characteristics for each reconstruction. The relative lattices are shown in the Supplemental Material Fig. S1.
Ag cell size Si cell size R(°) R' (°) match
) 4 4 ( (33) 0 0 0.989 ) 13 13 ( -I ( 7 7) 13.90 33.01 0.968 ) 13 13 ( -II ( 7 7) 13.90 -5.21 0.968 ) 3 2 3 2 ( ( 7 7) 30 10.89 1.007
Table 1: Angles between the superstructure cell and the silver lattice, R , and between the silicene and silver lattices, R . The match is the ratio of the silicene lattice in the superstructure ' with respect to the value found for FS silicene (using theoretical lattice constant values, determined here, of 3.870 Å for free standing silicene and 2.935 Å for Ag(111)).
The simulated equilibrium structures obtained by DFT calculations are shown in Fig. 2, while the associated structural parameters and energies are reported in Table 2, which can be compared with results reported in the literature, Table 3. The computed STM images corresponding to the relaxed structures are shown in Fig. 3.
From the relaxed atomic positions, we have extracted two main quantities: the average buckling, i.e. the difference between the average position of the high-lying Si atoms (drawn in red) and the average position of the low-lying Si atoms (drawn in yellow), and the range of the nearest-neighbor distances. From DFT calculations, we also compute the formation energy per Si atom at the Ag surface, as:
bulk Si Si Ag Si Ag ads E N E E E
where EAg and EAgSi are the total energies of the bare Ag substrate and the relaxed
energy. This formation energy has been used to compare the relative stability of the different configurations.
We have also computed within DFT the energy strip Ag
E of the Ag surface when it is stripped of
the Si atoms, without further relaxation, i.e. keeping the same atomic positions than those of the silicene/Ag structures. The elastic deformation of the substrate is then defined as
UC Ag strip Ag elas N E E
E , where NUC is the number of Ag surface unit cells in the slab. Eelas is
basically a measure of how the surface Ag atoms needs to rearrange in order to allow the adsorption of the Si atoms.
All configurations have a positive formation energy, which indicates that the silicene layer is metastable with respect to the formation of bulk Si crystallites [59].
12
ads
E (eV/at) Eelas(eV/at) (Å) dNN(Å)
) 4 4 ( h1h2h3 0.144 0.020 0.76 2.33-2.38 ) 4 4 ( t'1t'2t'3 0.146 0.023 0.73 2.33-2.38 ) 4 4 ( t1t2t3 0.145 0.023 0.73 2.33-2.38 I 13 h1t3t'2 0.216 0.005 0.30 2.30-2.32 I 13 t1t'3h2 0.166 0.019 1.29 2.36-2.41 I 13 t'1h3t2 0.166 0.021 0.78 2.33-2.43 II 13 h1t3t'2 0.201 0.003 0.52 2.33-2.36 II 13 t1t'3h2 0.150 0.025 0.74 2.34-2.43 II 13 t'1h3t2 0.152 0.024 0.71 2.34-2.43 3 2 h1t1t'1 0.153 0.024 1.10 2.29-2.38 3 2 h2t2t'2 0.162 0.025 0.65 2.29-2.36 3 2 h3t3t'3 0.176 0.011 0.65 2.29-2.36 FS silicene 0.639 0 0.44 2.25
Table 2: formation energy, elastic energy, average buckling and range of nearest-neighbor distances dNN for the superstructures shown in Fig. 1. The most stable structures are
highlighted in bold font. The labels 13 and 2 3 stand for ( 13 13)R13.9 and
2 3) 30 3
2
Fig. 3: Simulated STM images corrresponding to the atomic structures shown in Fig. 2. Bias voltage: U 0.5V. The labels 13 and 2 3 stand for ( 13 13)R13.9 and
2 3) 30 3
2
14
Among all computed structures, the most stable one is (44)h1h2h3, and the corresponding
STM image, Fig. 3a, nicely resembles those observed experimentally [4]. Although having very similar formation energies, the (44) t'1t'2t'3 and (44) t1t2t3 configurations are
associated to STM images, Fig. 3b and 3c, which are not observed experimentally as large domains. Fig. 3b and 3c are however very similar to the boundaries that have been observed between two (44) domains [19,48].
For ( 13 13)R13.9 reconstructions, DFT calculations show that type-II is more stable than
type I, with two configurations having the same formation energy: 13 tII 1t'3h2 and 13 II
t'1h3t2. The formation energy for these structures is only slighly higher than for the (44)
reconstruction. They have also very similar atomic configurations: nearest-neighbor distances
NN
d are in the range 2.31-2.39 Å, and the buckling is 0.74 Å and 0.71 Å, respectively. The
value of is close to the one found for the (44) reconstruction, 0.76 Å [26]. The simulated STM images for the two configurations (Fig. 3h and 3i) are similar and can be simultaneously observed on a same surface [27,28,46], whereas the 13 hII 1t3t'2, which has a higher
formation energy, is not found on the surface.
Among all ( 13 13)R13.9 structures, the 13 hI 1t3t'2 has the most similar values of
NN
d and , compared to FS silicene, which should posses a dNN=2.25 Å and a =0.44 Å
[1]. It is thus not surprising that this configuration induces very little deformation in the substrate (Eelas=0.005 eV/at). On the other hand it is remarkable that the same structure
presents the highest formation energy (Eads=0.216 eV/at). We will see that these two
properties are actually strictly correlated. The 13 tI 1t'3h2 configuration has the highest
buckling of all superstructures (1.29 Å). The 13 t'I 1h3t2 configuration has a similar
formation energy. Both structures possess a Si atom on top of a Ag surface atom (t1 or t'1), but
their structures and relative STM images are quite different. The 13 t'I 1h3t2 presents three
protruding Si atoms and a buckling of 0.78 Å, while the 13 tI 1t'3h2 has only one protruding
atom but with a much higher buckling. The comparison of Fig. 3d-f with experimental STM images shows that only 13 tI 1t'3h2 may correspond to the dotted phase initially assigned to
silicene layer [23,24]. The higher formation energy with respect to the (44)h1h3h2 or
II
13 t'1h2t3 structures explain why it is progressively replaced by these latter structures.
Concerning the (2 32 3)R30 structures, the most stable configuration is the 2 3h1t1t'1. It
presents two protruding atoms per unit cell, with a buckling of 1.10 Å. There is a good agreement between STM simulated images (Fig. 3j) and experimental ones [27]. The 2 3 h2t2t'2 and 2 3 h3t3t'3 structures are very similar, with three protruding atoms. They display
similar STM simulated images, that have not been observed experimentally.
Figure 4 reports the evolution of the formation energy of the silicene structures with respect to the substrate elastic relaxation energy. The two quantities are clearly correlated and the most stable structures are associated with the largest deformation of the substrate. We remind that a higher Eelas corresponds to a higher rearrangement of the surface Ag atoms. The correlation
observed in Figure 4 is thus a further indication that the interaction with the atoms of the substrate is needed to stabilize the silicene layer. We remark, however, that the formation energy of FS silicene, 0.64 eV, is more than 0.4 eV higher than the values reported in Figure 4, suggesting that the interaction between silicene and Ag is already strong even in the absence of substrate relaxations.
Table 3: interatomic buckling Δ (in Å) for the most stable structures found in the literature. I 13 13 II 2 3 Pflugradt et al. [18] 1.14 0.78 1.12 Tchalala et al. [12] 1.32 0.78 Enriquez et al. [41] 1.2 0.8 1.0 Gao et al. [38] 1.39 1.19 Wang et al. [7] 1.19 This work 0.78/1.29 0.71/0.74 1.10
16
Figure 4. Evolution of the formation energy of the silicene structures with respect to the substrate elastic relaxation energy.
3.2 Experimental results
Using GIXD, we have studied the structure of the silicene monolayers formed by Si evaporation on the Ag(111) substrate held at various temperatures in the 500 K - 570 K range. All measurements presented here have been obtained at room temperature after deposition.
As already pointed out, the (44) structure is always present for these preparation conditions, with a silicene lattice constant of 3.852 Å, equal to 4/3 of the Ag(111) surface lattice constant. Measurements of the structure factors for the (44) structure have already been presented: in ref. [26], we have shown that a very good agreement between experimental and simulated structure factors was obtained with the h1h2h3 model, with 2 5.4. We have
verified that using the same set of experimental data, no agreement could be obtained with the t'1t'2t'3 and t1t2t3 models.
In addition to the (44) superstructure, other diffraction spots are visible, for example for q// 1.87 Å or for q// 3.24 Å. All these spots correspond to silicene lattices rotated with
respect to the Ag substrate with an angle , where 'R' R [4.8-10°] depends on the growth
temperature T.
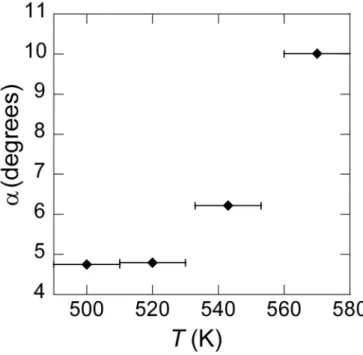
Fig. 5 shows the evolution of 'R with T. At low temperature, 'R is close to the relative
angle of 5.21° between the Ag lattice and the Si lattice in the ( 13 13)R13.9-type II
reconstruction, whereas at high temperature, R is nearly equal to the relative angle (10.89°) ' between the Ag lattice and the Si lattice in the (2 32 3)R30 reconstruction. For these
structures, the lattice constant of silicene, aSi, measured at room temperature after growth, does not depend on the growth temperature: aSi 3.884±0.004 Å. This indicates that all these structures are not exactly in registry with the Ag substrate, since the expected silicene lattice constants for the ( 13 13)R13.9 and (2 32 3)R30 reconstructions are 3.937 Å and
3.783 Å respectively, taking the value aAg 2.889Å for the Ag(111) surface lattice constant. Size and angle variations with respect to the ideal structures, such as those shown in Fig. 5, have already been reported in the literature from STM measurements, where Moiré patterns have been evidenced [27,28]. Larger unit cells have been proposed to interpret these structures, for example, the matching of a ( 427 427) Ag supercell with a ( 237 237)
silicene supercell [28], or the matching of a ( 133 133) Ag supercell with a ( 73 73)
silicene supercell [27]. Such reconstructions have been modeled as large areas of
13) 13.9 13
( R or (2 32 3)R30 reconstructions, separated by periodic domain
boundaries [27,28]. For these models, the corresponding mean silicene lattice constants are 3.878 Å and 3.899 Å respectively, and the relative angle between the lattices are 5.78° and
10.12 '
R respectively.
Our GIXD measurements are very complementary from the STM ones, since we are sensitive to the silicene parameters (lattice size and orientation), contrary to STM which measures the Si/Ag superstructure parameters. The good agreement among the present lattice constants and those derived from theoretical models [27,28] confirms that the structures
18
correspond to the Moiré between the silicene and silver lattices, whose relative angle 'R
depends on the deposition temperature.
Figure 5. Evolution of the angle 'R between the silicene lattice and the Ag(111) lattice, as a
function of the deposition temperature.
After growth at T 520 K, faint spots also appear at ± 28.9°. They are associated with a lattice constant aSi 3.869±0.004 Å slightly smaller than the value measured for the other structures. Due to the difference of lattice parameter and angle, these spots cannot be attributed to the same ( 13 13)R13.9-type II superstructure that gives rise to spots at
± 4.8°. They may be attributed to the ( 13 13)R13.9-type I superstructure. The
intensity associated with this structure was too small to be able to extract quantitative values of the structure factors.
We have measured structure factors along a few rods of the ( 13 13)R13.9-type II
and (2 32 3)R30 silicene structures. Non-negligible intensity was only obtained for
integer values of h and k , i.e. the diffracted intensity at non-integer diffraction positions associated with the( 7 7) reconstruction of silicene remains at background levels.
The comparison of the measurements performed on the various superstructures show that the behavior of the diffracted intensity is very similar for all measurements. This is in good agreement with previous Low Energy Electron Microscopy measurements [24]. The experimental structure factors have been compared to those derived from the DFT computation.
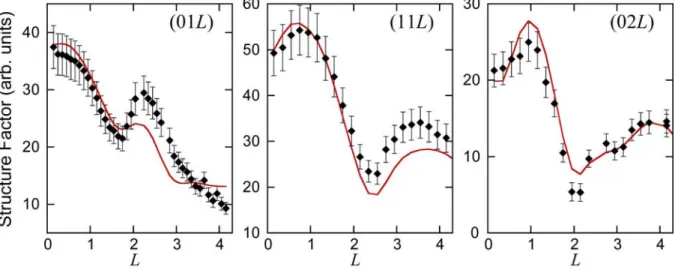
In figure 6 is shown the comparison between experimental and simulated structure factors for the (2 32 3)R30 structure grown at 570 K. A very good agreement is obtained with
2
1.8 for the h1t1t'1 model, which corresponds to the most stable (2 32 3)R30
configuration. In particular, the position of the dips observed in the curves are well reproduced. On the contrary, the fits obtained with the two other models (h2t2t'2 and h3t3t'3) give a very poor
agreement with 2 13.0 and 2 11.2 respectively (see Supplemental Material Fig. S2). Note that considering the atomic positions as fitting parameters would have produced only a slight improvement of 2 at the expense of losing physical insight since such procedure involves a huge number of free parameters (14 for Si atoms and 35 for three Ag layers).
Fig. 6. Structure factors for various rods of the (2 32 3)R30 structure grown at 570K. Comparison between experimental (black dots) and computed (continuous red line) values, using the h1t1t'1 model simulated by DFT.
The measured structure factors of the ( 13 13)R13.9 structure grown at 543 K along
20
and silver lattices, is slightly higher than the theoretical value of 5.21°. However, the comparison with the ( 13 13)R13.9 structure formed at 520 K, and for which R' 84. ,
shows that very similar structure factors are measured along the (10L) rod for these two temperatures. We have fitted the structure factors with the different models of
13) 13.9 13
( R -type II reconstructions.
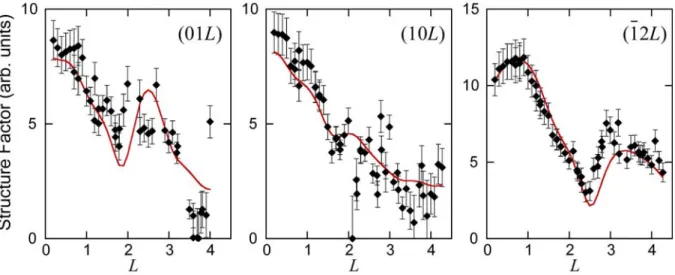
The best 2 obtained are 5.1, 9.7 and 7.7 for the h1t3t'2, t'1h3t2, t1t'3h2 models respectively. A
visual comparison between experiments and theory shows, however, that the overall shape of the rods is reproduced only by the models t'1h3t2 and t1t'3h2 (see Supplemental Material, Fig.
S3). In particular, the clear variation observed along the (12L) rod cannot be reproduced by
the h1t3t'2 model. Considering that the t'1h3t2 and t1t'3h2 models are the most energetically stable
and that their simulated STM images are more similar to measured ones, we simulated the structure factors with a combination of both structures. As the different domains are shifted relative to each other by an arbitrary vector of the Ag lattice, the phase is not preserved from one domain to another, leading to an incoherent summation of the intensities. A good agreement, with 2 2.5, is obtained with a composition of 38% of t'1h3t2 and 62% of t1t'3h2
(see Fig. 7).
Fig. 7. Structure factors for various rods of the ( 13 13)R19.1 structure grown at 543K. Comparison between experimental (black dots) and computed (continuous red line) values, using a combination of 38% of t'1h3t2 and 62% of t1t'3h2 models simulated by DFT.
4. Conclusion
We have presented a quantitative diffraction study aimed to determine, with the support of first-principles calculations, the exact atomic structure of silicene reconstructions on Ag(111). Using DFT in the GGA, we have computed all possible configurations for (44),
2 3) 30 3
2
( R and ( 13 13)R13.9 silicene reconstructions on Ag(111) that respect the
p3 symmetry. They have been labeled according to an original notation, which specifies the occupation of the p3-symmetry Wyckoff positions by the Si atoms of the silicene unit cell and by the Ag atoms of the first three substrate layers. A total of 12 inequivalent reconstructions has been identified. The DFT calculations well reproduced the experimental results, reporting the structures energetically most favorable as those which best reproduce measured STM images and GIXD structure factors. In particular, the (44) h1h2h3 reconstruction is the most
stable structure and in fact it is the most commonly observed. Both STM and GIXD data are in a very nice agreement with the computed STM image and theoretical structure factors, respectively. Concerning the (2 32 3)R30, the best agreement between theory and
experiments is obtained for the h1t1t'1 configuration and we note that the two other atomic
arrangements are energetically less stable and cannot reproduce experimental results. The interpretation of the ( 13 13)R13.9reconstruction is less straightforward. None of the
configurations, considered alone, can reproduce the experimental structure factors with the same consistency as in the two previous cases. However, the two energetically most stable configurations, namely the 13 tII 1t'3h2 and 13 t'II 1h3t2, have very similar simulated
STM images, both closely resembling the experimental one, and the simulated structure factors obtained from a combination of these two configurations nicely reproduce GIXD measurements.
Finally, we have also pointed out that among all the simulated silicene/Ag(111) structures, the most stable configurations are also those inducing the highest deformation in the substrate, suggesting that the interaction between silicene and Ag can be held to be responsible for the unexpected stability of the 2D silicon layer.
22
Acknowledgments
This work was supported by French state funds managed by the ANR within the
Investissements d’Avenir program under Reference ANR-11-IDEX-0004-02 and more
specifically within the framework of the Cluster of Excellence MATISSE. The SIXS beamline
staff is greatly acknowledged for the technical support.
[1] S. Cahangirov, M. Topsakal, E. Aktürk, H. Şahin, and S. Ciraci, Phys. Rev. Lett. 102, 236804 (2009). [2] K. Takeda and K. Shiraishi, Phys. Rev. B 50, 14916 (1994). [3] B. Lalmi, H. Oughaddou, H. Enriquez, A. Kara, S. Vizzini, B. Ealet, and B. Aufray, Appl. Phys. Lett. 97, 223109 (2010). [4] P. Vogt, P. De Padova, C. Quaresima, J. Avila, E. Frantzeskakis, M. C. Asensio, A. Resta, B. Ealet, and G. Le Lay, Phys. Rev. Lett. 108, 155501 (2012). [5] P. M. Sheverdyaeva, S. K. Mahatha, P. Moras, L. Petaccia, G. Fratesi, G. Onida, and C. Carbone, ACS Nano 11, 975 (2017). [6] Z. Li, H. Feng, J. Zhuang, N. Pu, L. Wang, X. Xu, W. Hao, and Y. Du, J. Phys. Condens. Matter 28, 034002 (2016). [7] W. Wang, W. Olovsson, and R. I. G. Uhrberg, Phys. Rev. B 92, 205427 (2015). [8] C.‐L. Lin, R. Arafune, M. Kawai, and N. Takagi, Chin. Phys. B 24, 087307 (2015). [9] N. Takagi, C.‐L. Lin, K. Kawahara, E. Minamitani, N. Tsukahara, M. Kawai, and R. Arafune, Prog. Surf. Sci. 90, 1 (2015). [10] M. X. Chen and M. Weinert, Nano Lett. 14, 5189 (2014). [11] N. W. Johnson, P. Vogt, A. Resta, P. De Padova, I. Perez, D. Muir, E. Z. Kurmaev, G. Le Lay, and A. Moewes, Adv. Funct. Mater. 24, 5253 (2014). [12] M. R. Tchalala, H. Enriquez, H. Yildirim, A. Kara, A. J. Mayne, G. Dujardin, M. A. Ali, and H. Oughaddou, Appl. Surf. Sci. 303, 61 (2014). [13] S. K. Mahatha, P. Moras, V. Bellini, P. M. Sheverdyaeva, C. Struzzi, L. Petaccia, and C. Carbone, Phys. Rev. B 89, 201416 (2014). [14] Y. Yuan, R. Quhe, J. Zheng, Y. Wang, Z. Ni, J. Shi, and J. Lu, Phys. E Low‐Dimens. Syst. Nanostructures 58, 38 (2014). [15] C. Grazianetti, D. Chiappe, E. Cinquanta, G. Tallarida, M. Fanciulli, and A. Molle, Appl. Surf. Sci. 291, 109 (2014). [16] Z.‐X. Guo, S. Furuya, J. Iwata, and A. Oshiyama, Phys. Rev. B 87, 235435 (2013). [17] C.‐L. Lin, R. Arafune, K. Kawahara, M. Kanno, N. Tsukahara, E. Minamitani, Y. Kim, M. Kawai, and N. Takagi, Phys. Rev. Lett. 110, 076801 (2013). [18] P. Pflugradt, L. Matthes, and F. Bechstedt, Phys. Rev. B 89, 035403 (2014). [19] G.‐W. Lee, H.‐D. Chen, and D.‐S. Lin, Appl. Surf. Sci. 354, Part A, 187 (2015). [20] R. Bernard, Y. Borensztein, H. Cruguel, M. Lazzeri, and G. Prévot, Phys. Rev. B 92, 045415 (2015). [21] R. Bernard, T. Leoni, A. Wilson, T. Lelaidier, H. Sahaf, E. Moyen, L. Assaud, L. Santinacci, F. Leroy, F. Cheynis, A. Ranguis, H. Jamgotchian, C. Becker, Y. Borensztein, M. Hanbücken, G. Prévot, and L. Masson, Phys. Rev. B 88, 121411(R) (2013). [22] H. Liu, N. Han, and J. Zhao, Appl. Surf. Sci. 409, 97 (2017).
[23] H. Jamgotchian, Y. Colignon, N. Hamzaoui, B. Ealet, J. Y. Hoarau, B. Aufray, and J. P. Bibérian, J. Phys. Condens. Matter 24, 172001 (2012). [24] P. Moras, T. O. Mentes, P. M. Sheverdyaeva, A. Locatelli, and C Carbone, J. Phys. Condens. Matter 26, 185001 (2014). [25] A. Curcella, Y. Borensztein, R. Bernard, M. Lazzeri, A. Resta, Y. Garreau, and G. Prévot, 2D Mater. 4, 025067 (2017). [26] A. Curcella, R. Bernard, Y. Borensztein, A. Resta, M. Lazzeri, and G. Prévot, Phys. Rev. B 94, 165438 (2016). [27] H. Jamgotchian, B. Ealet, Y. Colignon, H. Maradj, J.‐Y. Hoarau, J.‐P. Biberian, and B. Aufray, J. Phys. Condens. Matter 27, 395002 (2015). [28] H. Jamgotchian, B. Ealet, H. Maradj, J.‐Y. Hoarau, J.‐P. Bibérian, and B. Aufray, J. Phys. Condens. Matter 28, 195002 (2016). [29] M. S. Rahman, T. Nakagawa, and S. Mizuno, Jpn. J. Appl. Phys. 54, 015502 (2015). [30] S. Cahangirov, V. O. Özçelik, L. Xian, J. Avila, S. Cho, M. C. Asensio, S. Ciraci, and A. Rubio, Phys. Rev. B 90, 035448 (2014). [31] L. Chen, H. Li, B. Feng, Z. Ding, J. Qiu, P. Cheng, K. Wu, and S. Meng, Phys. Rev. Lett. 110, 085504 (2013). [32] Y. Borensztein, A. Curcella, S. Royer, and G. Prévot, Phys. Rev. B 92, 155407 (2015). [33] T. Shirai, T. Shirasawa, T. Hirahara, N. Fukui, T. Takahashi, and S. Hasegawa, Phys. Rev. B 89, 241403 (2014). [34] A. Curcella, R. Bernard, Y. Borensztein, M. Lazzeri, and G. Prévot, Nanoscale 10, 2291 (2018). [35] A. J. Mannix, B. Kiraly, B. L. Fisher, M. C. Hersam, and N. P. Guisinger, ACS Nano 8, 7538 (2014). [36] A. Curcella, R. Bernard, Y. Borensztein, S. Pandolfi, and G. Prévot, Beilstein J. Nanotechnol. 9, 48 (2018). [37] K. Yabuoshi and Y. Sugimoto, Jpn. J. Appl. Phys. 58, 020903 (2019). [38] J. Gao and J. Zhao, Sci. Rep. 2, 861 (2012). [39] A. Resta, T. Leoni, C. Barth, A. Ranguis, C. Becker, T. Bruhn, P. Vogt, and G. Le Lay, Sci. Rep. 3, 2399 (2013). [40] J. Onoda, K. Yabuoshi, H. Miyazaki, and Y. Sugimoto, Phys. Rev. B 96, 241302 (2017). [41] H. Enriquez, A. Mayne, A. Kara, S. Vizzini, S. Roth, B. Lalmi, A. P. Seitsonen, B. Aufray, T. Greber, R. Belkhou, G. Dujardin, and H. Oughaddou, Appl. Phys. Lett. 101, 021605 (2012). [42] Y. Fukaya, I. Mochizuki, M. Maekawa, K. Wada, T. Hyodo, I. Matsuda, and A. Kawasuso, Phys. Rev. B 88, 205413 (2013). [43] K. Kawahara, T. Shirasawa, R. Arafune, C.‐L. Lin, T. Takahashi, M. Kawai, and N. Takagi, Surf. Sci. 623, 25 (2014). [44] H. Jamgotchian, B. Ealet, H. Maradj, J.‐Y. Hoarau, J.‐P. Bibérian, and B. Aufray, J. Phys. Condens. Matter 28, 195002 (2016). [45] S. Sheng, J. Wu, X. Cong, W. Li, J. Gou, Q. Zhong, P. Cheng, P. Tan, L. Chen, and K. Wu, Phys. Rev. Lett. 119, (2017). [46] L. Feng, K. Yabuoshi, Y. Sugimoto, J. Onoda, M. Fukuda, and T. Ozaki, Phys. Rev. B 98, 195311 (2018). [47] Z.‐L. Liu, M.‐X. Wang, C. Liu, J.‐F. Jia, P. Vogt, C. Quaresima, C. Ottaviani, B. Olivieri, P. De Padova, and G. L. Lay, APL Mater. 2, 092513 (2014). [48] Z.‐L. Liu, M.‐X. Wang, J.‐P. Xu, J.‐F. Ge, G. L. Lay, P. Vogt, D. Qian, C.‐L. Gao, C. Liu, and J.‐F. Jia, New J. Phys. 16, 075006 (2014). [49] R. Arafune, C.‐L. Lin, K. Kawahara, Noriyuki Tsukahara, E. Minamitani, Y. Kim, N. Takagi, and M. Kawai, Surf. Sci. 608, 297 (2013). [50] J. Qiu, H. Fu, Y. Xu, Q. Zhou, S. Meng, H. Li, L. Chen, and K. Wu, ACS Nano 9, 11192 (2015). [51] C. Hogan, O. Pulci, P. Gori, F. Bechstedt, D. S. Martin, E. E. Barritt, A. Curcella, G. Prevot, and Y. Borensztein, Phys. Rev. B 97, (2018).
24 [52] A. Dawiec, Y. Garreau, J. Bisou, S. Hustache, B. Kanoute, F. Picca, G. Renaud, and A. Coati, J. Instrum. 11, P12018 (2016). [53] O. Robach, Y. Garreau, K. Aïd, and M. B. Véron‐Jolliot, J. Appl. Crystallogr. 33, 1006 (2000). [54] P. Giannozzi, S. Baroni, N. Bonini, M. Calandra, R. Car, C. Cavazzoni, D. Ceresoli, G. L. Chiarotti, M. Cococcioni, I. Dabo, A. Dal Corso, S. de Gironcoli, S. Fabris, G. Fratesi, R. Gebauer, U. Gerstmann, C. Gougoussis, A. Kokalj, M. Lazzeri, L. Martin‐Samos, N. Marzari, F. Mauri, R. Mazzarello, S. Paolini, A. Pasquarello, L. Paulatto, C. Sbraccia, S. Scandolo, G. Sclauzero, A. P. Seitsonen, A. Smogunov, P. Umari, and R. M. Wentzcovitch, J. Phys.‐Condens. Matter 21, 395502 (2009). [55] J. P. Perdew, K. Burke, and M. Ernzerhof, Phys. Rev. Lett. 77, 3865 (1996). [56] G. Kresse and D. Joubert, Phys. Rev. B 59, 1758 (1999). [57] J. Tersoff and D. R. Hamann, Phys. Rev. B 31, 805 (1985). [58] T. Hahn and Internationale Union für Kristallographie, editors , International Tables for Crystallography. Vol. A: Space‐Group Symmetry, 5. ed., reprinted with corrections (Springer, Dordrecht, 2005). [59] A. Acun, B. Poelsema, H. J. W. Zandvliet, and R. van Gastel, Appl. Phys. Lett. 103, 263119 (2013).
SUPPLEMENTARY INFORMATION
26
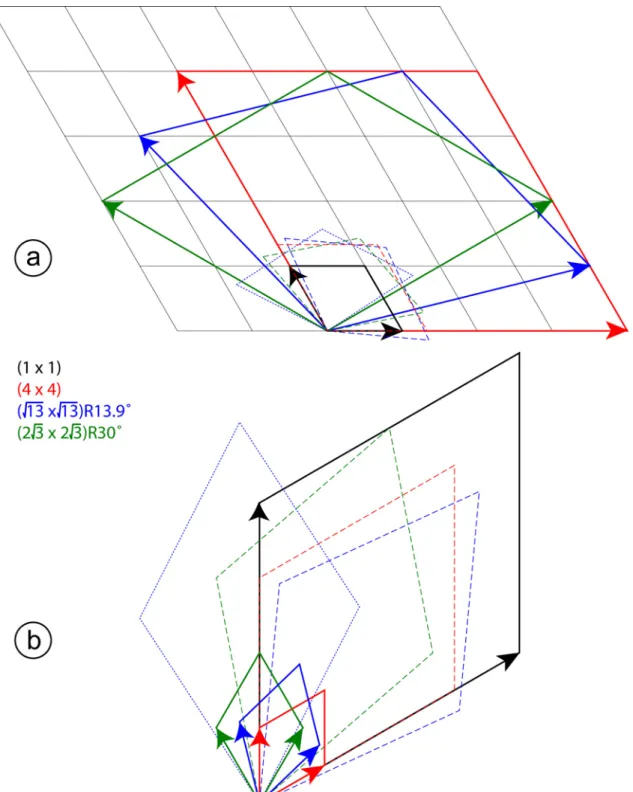
Figure S1 : Lattices in direct (a) and reciprocal (b) space for silicene, Ag(111) and the silicene/Ag(111) reconstructions. The (11), (44), ( 13 13)R13.9 and
2 3) 30 3
2
( R unit cells are indicated by black, red, blue and green parallelograms with
plain lines. The dashed unit cells correspond to the (44), ( 13 13)R13.9-II and
2 3) 30 3
2
( R silicene unit cells. The blue dotted unit cell corresponds to the
13) 13.9 13
Figure S2 : Structure factors for various rods of the (2 32 3)R30 structure grown at 570K. Comparison between experimental (black dots) and computed values, using the models simulated by DFT. Red continuous line: h1t1t'1, blue dotted line: h2t2t'2, green dashed line: h3t3t'3.
Figure S3 : Structure factors for various rods of the ( 13 13)R13.9-type II structure grown at 543K. Comparison between experimental (black dots) and computed values, using the models simulated by DFT. Red continuous line: h1t3t'2, blue dotted line: t'1h3t2, green dashed line: t1t'3h2.
28 in Si B (Å2) BSiout(Å2) BAgin (Å2) BAgout(Å2) ) 4 4 ( h1h2h3 6.5 0.4 7.7 6.6 ) 4 4 ( t'1t'2t'3 3.2 8.4 6.9 2.0 ) 4 4 ( t1t2t3 4.2 14. 12. 0 II 13 h1t3t'2 3.7 5.9 0 20 II 13 t1t'3h2 0.82 20 4.2 0 II 13 t'1h3t2 1.6 5.2 0 20 3 2 h1t1t'1 2.2 4.5 6.4 14 3 2 h2t2t'2 0 7.0 20 20 3 2 h3t3t'3 6.4 7.0 1.3 1.8
Table S1 : Table of parameters used for fitting the experimental structure factors, using the different atomic models computed by DFT, and 5 free parameters: a scale factor and in-plane or out-of-plane Debye-Waller factors B for Si or Ag atoms. For the fits, B values have been limited to the [0,20] interval.