HAL Id: hal-02415490
https://hal.archives-ouvertes.fr/hal-02415490
Submitted on 17 Dec 2019
HAL is a multi-disciplinary open access archive for the deposit and dissemination of sci-entific research documents, whether they are pub-lished or not. The documents may come from teaching and research institutions in France or abroad, or from public or private research centers.
L’archive ouverte pluridisciplinaire HAL, est destinée au dépôt et à la diffusion de documents scientifiques de niveau recherche, publiés ou non, émanant des établissements d’enseignement et de recherche français ou étrangers, des laboratoires publics ou privés.
benchmark exercise
E. Studer, S. Abe, M. Andreani, Js. Bharj, B. Gera, L. Ishay, S. Kelm, J.
Kim, Y. Lu, P. Paliwal, et al.
To cite this version:
E. Studer, S. Abe, M. Andreani, Js. Bharj, B. Gera, et al.. Stratification break-up by a diffuse buoyant jet a CFD benchmark exercise. 12th International Topical Meeting on Nuclear Reactor Thermal-Hydraulics, Operation and Safety (NUTHOS-12), Oct 2018, Qingdao, China. �hal-02415490�
Abstract No: 31 Oral presentation or Poster □ Paper No.:
1
Stratification break-up by a diffuse buoyant jet: a CFD benchmark exercise
E. Studer
1, S. Abe
2, M. Andreani
3, J. S. Bharj
4, B. Gera
5, L. Ishay
6, S. Kelm
7, J. Kim
8,
Y. Lu
9, P. Paliwal
10, B. Schramm
11, H. Wang
12.
1 DEN/STMF, CEA Université Paris-Saclay, France, 2 Japan Atomic Energy Agency, Tokai, Japan, 3 Paul Scherrer Institute, Würenlingen, Switzerland, 4 Nuclear Power Corporation of India Limited, India,
5 Bhabha Atomic Research Centre, Mumbai, India, 6 Ben-Gurion University of the Negev, Israel,
7 Forschungszentrum Juelich GmbH, IEK-6, Juelich, Germany, 8 Korea Atomic Energy Research Institute, Daejeon, Korea,
9 Nuclear Power Institute of China, Chengdu, China. 10 Atomic Energy Regulatory Board, India,
11 Gesellschaft für Anlagen- und Reaktorsicherheit, Köln, Germany, 12 China Nuclear Power Engineering, Beijing, China,
Abstract:
Nuclear engineering research groups were interested in the phenomena of the interaction between a rising jet and a stratified layer located above in order to better understand the underlying mechanisms of hydrogen accumulation and dispersion in a nuclear reactor containment. Previous studies were performed with an upward jet of fluid heavier or lighter than the upper stratified layer. However, in real configurations, obstacles are present, and dissipate the initial momentum of the gas release. Consequently, the upward flow pattern can be considered "diffuse" and buoyant, neither pure jet nor pure plume. Therefore, this challenging issue was part of a project called HYMERES, which was launched and conducted in the OECD/NEA framework. Dedicated experiments were performed in the large-scale MISTRA facility (HM1-1 test series). These experimental results were offered for a blind and open benchmark exercise.
This calculation exercise with its two phases highlighted the difficulties in calculating this complex flow including an impinging lateral jet forming a diffuse upward buoyant flow pattern which interacts with a gas stratification. The results show that the erosion time is blindly predicted with a disparity of +/- 30% with an imposed turbulence model. This difference is greatly reduced when each user's specific experience is included in the choice of turbulence model. On this point, there is consensus to say that the standard k- model does not allow to model these complex phenomena and that a more elaborate model is then necessary without reaching a consensus on model choice. The gas temperature is generally overestimated by the models compared to the experiment without having really concluded on the origin of this overestimation. Heat exchange models and the effect of water vapor on radiative heat transfer were mentioned as possible sources of differences. To capture the flow structure generated by the impinging horizontal jet a minimal mesh density seems necessary not to diffuse too much the flow structures. Sharing the mesh in a future exercise seems to be essential for progress. The use of a common numerical model has made it possible to analyze that under the term 'standard' are hidden different models.
Keywords:
Abstract No: 31 Oral presentation or Poster □ Paper No.:
2
1. Introduction
Nuclear engineering research groups [1][2][3][4][5] were interested in the phenomena of the interaction between a rising jet and a stratified layer located above to better understand the underlying mechanisms of hydrogen accumulation and dispersion in a nuclear reactor containment. This gas species, produced by metal/steam reaction in the reactor core under severe accident conditions, can be released in the containment atmosphere and forms large combustible gas clouds, which can challenge its integrity in case of massive explosion as, illustrated recently in the Fukushima Dai-ichi accidents. These experimental and numerical studies were motivated by the production of detailed experimental results and the associated assessment of CFD tools used to support the nuclear safety demonstrations for present and future reactors.
At CEA, Deri et al. [1] had first conducted small scale experiments to study the erosion of a helium rich stratified layer by a vertical upward air jet. Then, larger scale experiments were performed in the MISTRA facility [3] to study the same phenomenon and to assess the scaling effect.
Both studies were performed with an upward jet of fluid heavier than the upper stratified layer. However, in real configurations i.e. the inner part of nuclear containment, obstacles such as pipes, components as pumps or reservoirs and walls are present and can dissipate the initial momentum of the gas release. Consequently, the upward flow pattern can be considered "diffuse" and buoyant neither pure jet nor pure plume. Therefore, a new project called HYMERES has been launched and conducted in the OECD/NEA framework to study in a dedicated test series, the interaction between a diffuse buoyant jet and a two-layer stratification. Large-scale experiments in the MISTRA facility, HM1-1 test series, were performed in which the erosive flow pattern came from a horizontal hot air jet impinging on a vertical cylinder. These experimental results were used to perform a calculation exercise with CFD numerical simulation tools. This work was divided into two phases: a blind phase during which the results of the tests are not known, which makes it possible to evaluate the predictive character of the models, and an open phase in which all the test results were provided and the participants could adjust their models and explain these adjustments. Several calculation exercises have already been organized on the erosion of a gas stratification by upward flow. Examples include those organised around the results of the THAI experiments in [2] or [6]. In the first, the prediction of the dissolution of the light gas cloud showed wide variations. In the second, the duration until dissolution was already highly variable from the lower layer of the stratification and these differences became more important for the upper layers. In all cases, the open phase significantly improved the results of the calculations. More recently, the OECD/NEA exercise on PANDA test results [7] has also shown a surprisingly wide dispersion on the progress of the dissolution front within the stratification. Detailed comparisons including velocity and turbulence profiles were not able to determine the reasons for these differences.
Previous exercises did not consider erosion in the presence of obstructions. Recent work by Andreani et al [8] has shown that adding an obstacle greatly complicates the numerical problem. The use of fine-mesh models improved predictions and generally, good prediction of stratification erosion was the result of error compensating because no model predicted with the same accuracy, concentration, temperature and velocity. The test proposed in this article reinforces the importance of an obstacle and allows users to test the adjustment of their model on different conditions.
The paper is organized as follows. In section 2, we give a description of the MISTRA facility with the associated test sequence but also the initial and the boundary conditions and the main experimental results. The blind simulation phase results are analyzed in section 3 and compared with the experimental results. In section 4, the open simulation results significantly improved some blind contributions. Finally, the main conclusions of the work are summarized in section 5.
Abstract No: 31 Oral presentation or Poster □ Paper No.:
3
2. MISTRA test HM1-1
2.1 Experimental set-up
The MISTRA facility, operated by CEA since 1999, is a medium scale pressure vessel in which several issues related to containment thermal hydraulics have been investigated i.e. film condensation in presence of non condensible gases [9], containment spray efficiency [10], Passive Autocatalytic Recombiner (PAR) behaviour [11], and gas mixing related to hydrogen risk [3], [12].
(a) (b)
(c) (d)
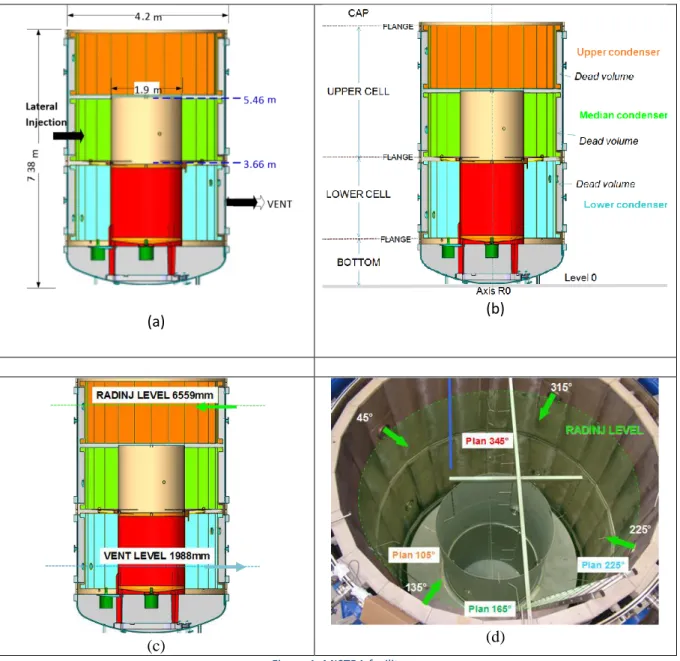
Figure 1: MISTRA facility
The main vessel is 7.4 m in height and 4.2 m in diameter resulting in a free volume of about 100 m3.
Three annular condensers are inserted inside the vessel and designed to ensure a constant temperature boundary condition. Only the inner surface of the condensers is used for heat and mass transfer whereas the outer surface facing the main vessel is insulated. For the present test series, a compartment (see Figure 1) was inserted into the MISTRA vessel. It comprises a vertical cylinder sealed on the bottom and opened on the top and an annular ring plate located between the lower and middle condensers elevation. A gap of 0,15 m was kept between the ring and the condensers in order to allow gas species transport between the bottom and the top of the vessel. Two injection lines were used during the HM1-1 tests:
Abstract No: 31 Oral presentation or Poster □ Paper No.:
4
the four radial injection pipes located around the upper condenser (Figure 1 - d) int=0.0226 m,
r=1.847 m, z=6.559 m and =45°, 135°, 225° and 315°) to build the helium rich stratified layer on the top of the facility;
a lateral injection line (Figure 1 – a, int=0,075 m at r=1.748 m, z=4.341 m and =315°) to
produce the buoyant hot air injection used to erode the stratified layer.
A 0.2 m in diameter vent line was located on the lower condenser opposite to the radial injection line (r=1.897 m, z=1.988 m and =135°) to keep the facility at atmospheric pressure during the tests. For the HM1-1 tests, the facility was initially filled with dry air at 1 bar and 23 °C. The initial steam content was less than 1 vol%. Then, the test sequence was divided into three phases:
phase 1: helium injection, 4.2 g/s, 23 °C during 360 s through the upper radial injection line; phase 2: stratification set-up and return to quiescent conditions;
phase 3: stratification erosion thanks to a buoyant diffuse source, 25 g/s, 150 °C during 6000 s created by a lateral buoyant air jet impinging on the inner cylinder.
During these different phases, the temperature of the three condensers was adjusted to 22 °C.
The gas temperature as well as the wall temperatures were monitored by more than 200 type K thermocouples and two different devices recorded the gas composition at several locations: 30 mini katharometers measuring the change of thermal conductivity of the gaseous mixture produced by helium addition and 54 gas sampling lines coupled with a quadrupole mass spectrometer.
2.2 Experimental results of test HM1-1
During the helium injection phase, 915 grams of helium were injected through the four lateral injection pipes located in the upper part of the facility. The resulting stratified layer (Figure 2) at the end of Phase 2 displays a steep vertical gradient between 5.8 and 6.8 meters with a maximum measured helium concentration at the top equal to 42 vol%. Highly reproducible results were achieved in the build-up of the stratified layer, and the helium concentration was measured with an accuracy of less than 1 vol%. Integration of the stratified profile provide a global measurement of the mass of helium injected during this first phase and comparison with the integration of the sonic nozzle flow rate versus time leads to a relative accuracy of the mass balance of less than 4%.
The natural evolution of this stratification was studied during the SETH-2 project tests [3]. In these experiments, the driving force for helium transport was molecular diffusion as shown by comparison with a 1D analytical solution.
Abstract No: 31 Oral presentation or Poster □ Paper No.:
5
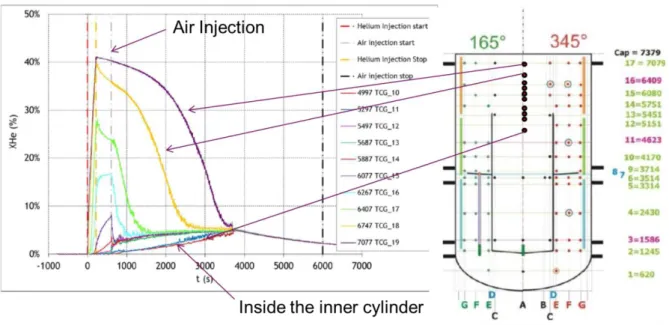
Figure 2: HM1-1 - Helium stratified layer
During the helium dissolution phase, the convection flow associated to the lateral hot air jet impinging on the inner cylinder causes a progressive erosion of the helium-rich cloud (Figure 3). Thereby, helium was entrained from the top into the convective flow and is homogeneously mixed in the fluid layer located above the annular ring plate thanks to the gas concentration measurements located between the injection level and lower part of the stratified layer. Within the inner cylinder, helium gas was transported much slowly due to reduced convective flow (Figure 3). The complete erosion of the upper layer was achieved about 3200 s after the start of the erosive process and this result is highly reproducible from tests to tests.
Figure 3: HM1-1 - Erosion process along the centreline.
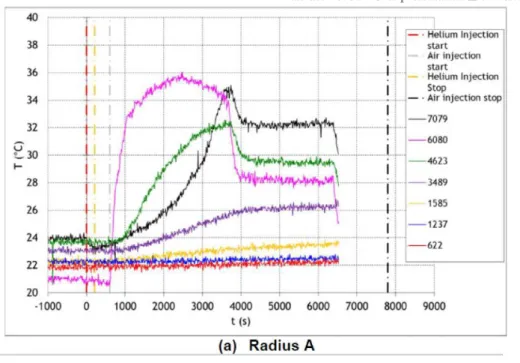
Gas temperature measurements (Figure 4) confirms the total erosion of the stratified layer after less than one hour with the rapid change of the slope at 7.08 m. The completion of the dissolution is not changing the structure of the buoyant air jet as confirmed by temperature measurements below the lateral injection, in the momentum dominated zone and in the rising flow along the inner cylinder.
Abstract No: 31 Oral presentation or Poster □ Paper No.:
6
Figure 4: HM1-1 - Thermal behaviour of the gaseous volume along the centreline.
Heat absorption by the inner cylinder was monitored by some thermocouples attached to the wall. The asymmetry between the close side of the injection and the opposite side of the injection is clearly visible (Figure 5). It should also be noted that at the end of the stratification erosion, the temperature for the sensors at the top of the cylinder shows a change of slope indicative of a modification in the flow pattern. Relative humidity was also measured to quantify a possible effect of the water vapour content. The measurements show an initial relative humidity of 25% with a drop to 10% during hot air injection.
Figure 5: HM1-1 – Wall temperature along the inner cylinder.
3. Blind simulation phase
This fluid mechanics problem has several difficult points for computer simulation. First of all, the presence of a horizontal jet with the development of turbulent flow around the potential cone. This jet then impacts a convex structure with all the difficulties of heat exchange and turbulence control at the impact. The flow that has lost part of its inertia will therefore preferentially rise upwards along the cylinder due to buoyancy. Finally, this ascending structure will encounter and interact with gas stratification.
Abstract No: 31 Oral presentation or Poster □ Paper No.:
7
The results of the tests described above were processed to provide initial and boundary conditions for a blind calculation exercise. One of the first objectives was to test the predictive character of numerical simulation tools on this problem of erosion of a gas stratification by a diffuse buoyant jet.
3.1 Participants and numerical set-up
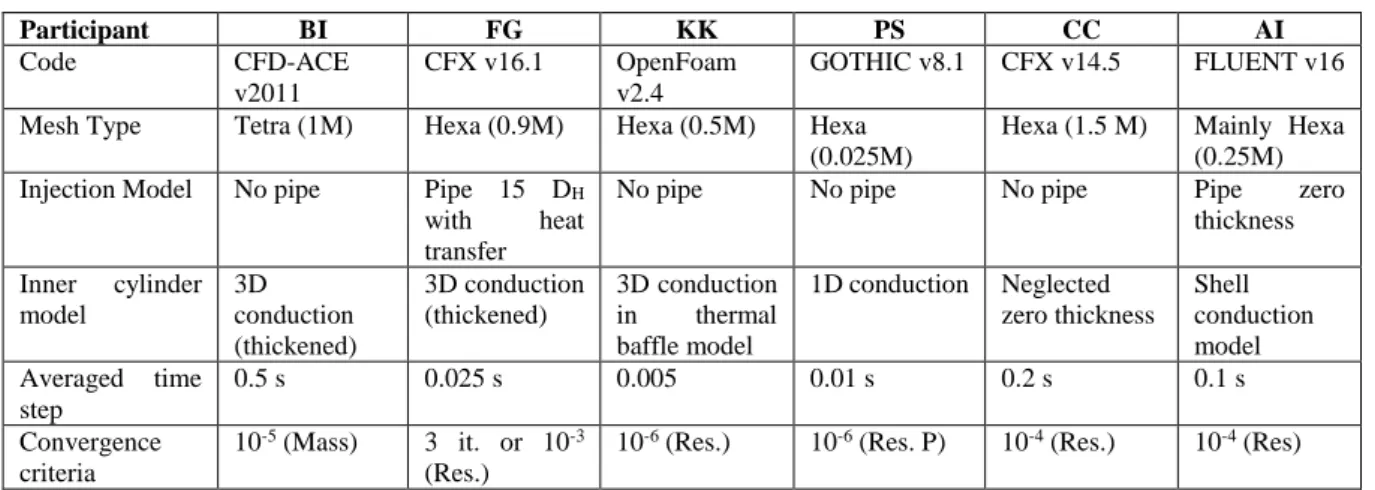
Six organizations participated in this blind exercise. The main characteristics of their calculations are given in Table 1. They all modelled the experiment without hypothesis of flow symmetry. The meshes are mainly hexahedral and comprise between half and one million cells except for the GOTHIC code and the contribution with the FLUENT code (Figure 6). All the information were not available but we assume that the participants applied the best practice guidelines for CFD simulation. Various choices have been made to model the inner cylinder thermal behavior and lateral injection piping.
Participant BI FG KK PS CC AI Code CFD-ACE v2011 CFX v16.1 OpenFoam v2.4 GOTHIC v8.1 CFX v14.5 FLUENT v16
Mesh Type Tetra (1M) Hexa (0.9M) Hexa (0.5M) Hexa
(0.025M)
Hexa (1.5 M) Mainly Hexa
(0.25M)
Injection Model No pipe Pipe 15 DH
with heat
transfer
No pipe No pipe No pipe Pipe zero
thickness Inner cylinder model 3D conduction (thickened) 3D conduction (thickened) 3D conduction in thermal baffle model 1D conduction Neglected zero thickness Shell conduction model Averaged time step 0.5 s 0.025 s 0.005 0.01 s 0.2 s 0.1 s Convergence criteria 10-5 (Mass) 3 it. or 10-3 (Res.)
10-6 (Res.) 10-6 (Res. P) 10-4 (Res.) 10-4 (Res)
Table 1 : Details of the blind CFD contributions (Common Model).
For the modelling issues participants have agreed to provide a so-called "Common model" analysis involving standard k- turbulence model and imposed properties, such as helium diffusion coefficient and turbulent Schmidt and Prandtl numbers. Participants were also allowed to deliver a "Best estimate" contribution to the benchmark exercise by the use of more advanced and relevant models. These second set of contributions will not been discussed in this blind phase section but, it will be described in the open one.
Figure 6: HM1-1 – Meshes used by the different participants (Blind simulations).
3.2 Evaluation of the blind simulation results
In order to evaluate as accurately as possible the different contributions, we detailed the results by following the different flow structures between injection and stratification.
Abstract No: 31 Oral presentation or Poster □ Paper No.:
8
(a) (b)
(c) (d)
(e) (f)
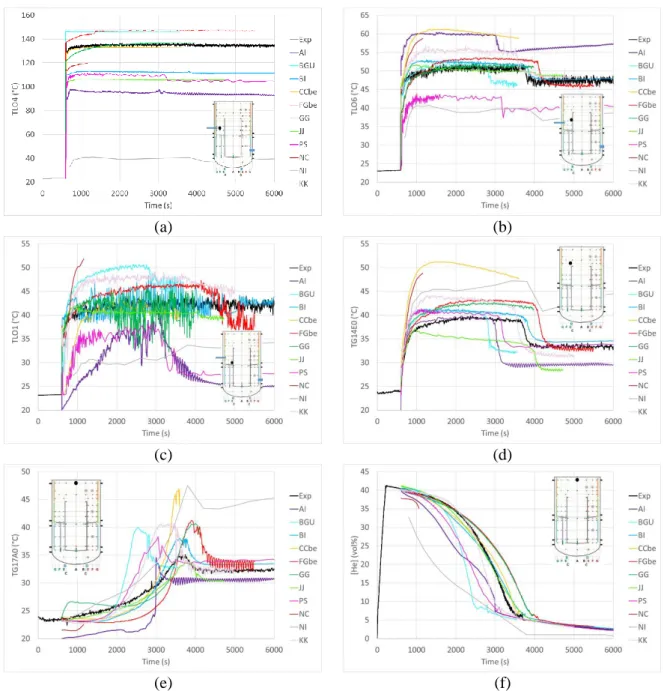
Figure 7: HM1-1 – Main results of blind simulations.
First, for the development of the jet near the injection we compared the measured and the computed temperatures at the TL04 sensor (r=1.423 m, z=4.347 m and =315°) located about 4.3 diameters from the outlet of the injection pipe and thus at the end of the potential cone.
Experimentally, in this zone, the temperature gradients were important with measured temperature values of 80°C at 4 cm below the sensor, 140°C at 1.4 cm below and 100°C at 4 cm above. It therefore appears that the injection was not completely horizontal. Numerically, the differences are very important (Figure 7 (a)), the temperature varies between 60°C and 150°C. Part of the reason was that some participants had used an injection pipe to impose conditions at the inlet while others had directly imposed boundary conditions at the outlet of the pipe. The mesh size is also an important point because the coarser the mesh size the more difficult it is to capture the potential core of the jet. Taking into account the thermal behavior of the pipe in its non-thermally regulated part (FG contribution) leads to a transient of about 1000 seconds as measured experimentally. It is not easy to draw some rules on the importance of modeling the temperature in TL04 to capture the mixing transient; the effects regarding the different contributions are not the same, as we will see later.
Abstract No: 31 Oral presentation or Poster □ Paper No.:
9
In order to characterize the impact, we further compare the gas temperature just above the impact point TL06 (r=0.993 m, z=4.665 m and =315°) and the recirculation zone above the injection with TL01 (r=0,993 m, z=3,803 m and =315°).
For BI, the coarse mesh size seems to be the reason for the strong underestimation of temperatures in these two points (Figure 7 (b) and (c)). For PS and AI in TL01, the downward jet penetration limit is near this measurement point. As a result, when the stratification erosion ends, the flow restructuring leads to a small shift in the penetration and therefore to a significant change in the calculated temperature. This change is not measured experimentally on TL01, which tends to indicate that this sensor must largely be immersed in the downward recirculation zone (result of KK). For level TL06, the effect of restructuring at the end of erosion is measured and is predicted by all simulations (except BI). Neglecting the internal cylinder thermal behavior leads to a strong overestimation of the temperature up to 15°C (CC results). For others, using fine mesh sizes, the temperature is generally overestimated between 5 and 10°C. Note that FG seems to calculate a much longer equilibrium time than in the experiment.
For the ascending structure, we have a TG14E0 sensor (r=1.101 m, z=5.751 m and =345°) located in the ascending part of the flow near the inner cylinder and just above it.
Again, all contributions predict the effect of flow restructuring at the end of erosion at variable times (Figure 7 (d)), as we will see later. Except both CFX contributions (FG and CC), the calculated temperature is very close to the measured temperature for the other four contributions. The difference between the two results with CFX comes mainly from the thermal modelling of the inner cylinder. The overestimation of the temperature for FG can be related to the modelling of the heat exchange in the common model and to the effect of initial humidity on the radiative heat transfer [13].
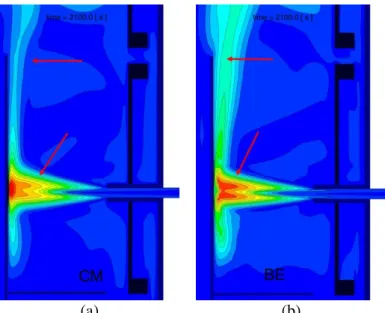
Finally, for interaction with gas stratification, we will first look at the helium concentration at the TCG19 point (r=0,012 m, z=7,077 m and =0°) and then at the temperature at the same point (TG17A0). The concentration at point TCG19 is not directly affected by the buoyant jet and follows a 'diffusion' type evolution (Figure 7 (f)). However, this transport is faster than molecular diffusion [3]. All contributions calculate this type of transient (AI had a problem of equilibrium of the initial conditions). On the other hand, the erosion rate is very different according to calculations (+/- 30% compared to experience). First, both CFX contributions tend to overestimate mixing time. For the major part, this overestimation is due to the use of the standard k- turbulence model. As shown in Figure 8, there is a visible difference on the turbulent kinetic energy near the jet stagnation point affecting the eddy viscosity and increasing the turbulent thermal and mass diffusions. For the common model, the buoyant jet resulting from the impact is therefore much thinner than when using a more elaborate model ("Best-estimate" contribution). In other contributions, the use of a standard k- model generally leads to an underestimation of mixing time. This suggests that there must be differences in the implementation of the so-called "standard" models between the different codes. KK mentioned the limitation on the turbulent kinetic energy production which is important in the jet stagnation region. Despite significant differences in the simulation of the impinging air jet, BI predicts a mixing time very close to that of the experiment. This result could be related to the correct temperature prediction in TG04E0. But PS which is also good on this temperature calculates a much faster erosion. This last result is in line with PS's experience in simulating tests dedicated to this phenomenon in the HYMERES project. However, the exact reason has not been fully identified: the difference probably comes from the three-dimensional structure of the buoyant jet due to the convex shape of the obstacle. The temperature at the same point
Abstract No: 31 Oral presentation or Poster □ Paper No.:
10
(TG17A0 - Figure 7 (e)) reflects the mixing time and does not provide additional information except that AI and BI have an initial condition problem.
(a) (b)
Figure 8: HM1-1 – Effect of the turbulence model on the effective mass diffusion coefficient - FG contributions (a) Common Model k- (b) Best-Estimate Model SST.
Additional variables were compared during the exercise but they are not detailed in this paper.
4. Open simulation phase
4.1 Participants and modelling improvements
Eleven institutes participated in the open phase of the exercise, the previous six and five new institutes (Table 2).
First, for lack of time to carry out complementary simulations CC and FG considered that the result of the blind phase but with the "best-estimate" model, i.e. an SST type turbulence model, constituted their contribution to the open phase. FG also showed that a refinement of the mesh near the air jet had an effect on the velocity and turbulent kinetic energy profiles. However, jet trajectory and momentum of the diffuse flow seems to be insensitive to mesh resolution, injection line length and CFL number. AI and BI have refined the mesh. BI has significantly increased the number of meshes near the injection and near the inner cylinder. These two institutes also fixed their problems with the initial conditions identified during the blind phase. BI also tried to reduce the thickness of the central cylinder without noticeable effect on the results.
KK has tried to use more precise injection profiles but it has a minor influence. Mesh refinement close to the inner cylinder to resolve the boundary layers has also a minor effect on the results. Different turbulence models including also different buoyancy terms were investigated: the realizable k- model associated with generalized gradient hypothesis for the buoyancy term led to better agreement on the mixing time but still overestimated values for the temperature fields. Modifications of constants following Nam et al [14] can also lead to some improvement with the lack of generality.
PS considered the reduced area of the gap between the condensers and a finer mesh for the cylinder. The only notable difference is that the diffusion of helium inside the inner cylinder was reduced without affecting the upper behavior.
Abstract No: 31 Oral presentation or Poster □ Paper No.:
11
Participant AI BGU BI CCbe FGbe GG
Code FLUENT v16 FLUENT v17.2
CFD-ACE+ CFX v14.5 CFX v16.1 CFX v16 Mesh Type Mainly Hexa
(0.41M)
Hexa (3.45M, symmetrical plane)
Tetra (1,15M) Hexa (1.5 M) Hexa (0.9M) Hexa (1,9M)
Injection Model Pipe zero thickness Pipe zero thickness
No pipe No pipe Pipe 15 DH and
heat transfer Pipe zero thickness Inner cylinder model Shell conduction model Shell conduction model 3D conduction Thickened Neglected Zero thickness 3D conduction Thickened 3D conduction Averaged time step 0,2 s 0.05 s 0,5 s 0,2 s 0.025 s 0,01-0,1 s Turbulence Model
k- k- k- SST SST and buoyancy SST and buoyancy
Participant JJ KK PS NI NC Code OpenFoam v2.3.1 OpenFoam v2.4 GOTHIC v8.1 PHOENICS v2014 FLUENT v14.5
Mesh Type Hexa (0,95M) Hexa (0.5M)
Hexa (0.028M) Hexa (0,6M) Hexa (1.5M)
Injection Model
No pipe No pipe No pipe No pipe
Inner cylinder model 3D conduction 3D conduction in thermal baffle model
1D conduction 3D conduction 1D conduction
Averaged time step 0.0011 s 0.005 0,01 s 0,2 s 0.25 s Turbulence Model k- with buoyancy and dynamic Sct and Prt Realizable k- with GGDH buoyancy k- with buoyancy k- k- with buoyancy
Table 2 : Details of the open CFD contributions.
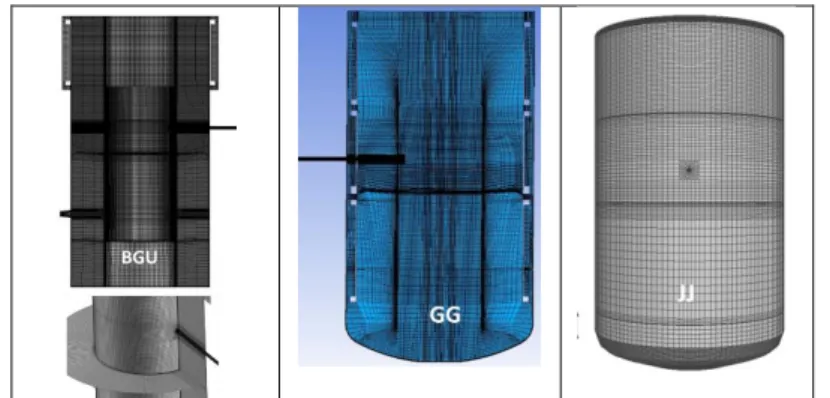
Among the new entrants, we have two new contributions with the ANSYS/Fluent code, a new contribution with CFX and a new contribution with OpenFoam code. In this open phase, not all participants followed the rule of providing two contributions and therefore, in this article we only compare the "best estimate" results. They essentially consist of the use of more elaborate turbulence models than the standard k-model (realizable k- SST model or dynamic calculation of turbulent Prandl and Schmidt numbers). Finally, the meshes used for these new contributions are shown in the Figure 9.
Figure 9: HM1-1 – Meshes used by some of the new participants (Open simulations).
4.2 Evaluation of the open simulation results
For the simulation of the lateral jet, the use of refined meshes allows to better predict the temperatures at the different measuring points (Figure 10 (a), (b) and (c)). However, the differences remain significant for the coarser meshes, and further refining the mesh size induces a significant cost in computing time. Moreover, as BI points out, the benefit on the prediction of mixing time is marginal. For new
Abstract No: 31 Oral presentation or Poster □ Paper No.:
12
contributors, the mesh used by NI is too coarse to catch the lateral jet structure. GG captures well the temperature in these three locations. BGU and JJ obtain satisfactory results for the thermal structure of the lateral jet. NC only calculated the first 1000 seconds of the transient and showed a strong overestimation of the temperature in TL06 and TL01 probably indicative of a deficiency in the thermal behavior of the inner cylinder. The restructuring of the flow following the end of erosion is visible on all the contributions in TL06 and generally absent in TL01 as the experience had shown.
(a) (b)
(c) (d)
(e) (f)
Figure 10: HM1-1 – Main results of open simulations.
For the rising part of the buoyant jet (Figure 10 (d)), the deviations from the blind phase have generally narrowed, indicating that there is a cumulative effect of the improvements. However, most participants except JJ obtain a slight overestimation of temperature. For AI, the initial temperature change shifted the results downwards without any real improvement. BI, PS and BGU predict values very close to the experimental results.
The next issue concerns the erosion of the stratification (Figure 10 (e) and (f)). PS and AI have not obtained any improvement and they still underestimate the mixing time by about 1000 seconds. The
Abstract No: 31 Oral presentation or Poster □ Paper No.:
13
contributors with the CFX code (CC, FG and GG) have significantly reduced the overestimation of erosion time. They even produce the same result as of FG and GG although the temperature field are slightly different. We do not have all the results to explain that but compensations probably play a role. CC is closer to the experimental results although the temperature field is strongly overestimated. One could mention a more significant contribution of buoyancy, but in the blind phase FG and CC obtained very close results with different temperatures. Here again, phenomena must compensate each other and a more detailed analysis must be carried out to identify the reasons for these differences. The contributions with FLUENT (AI, BGU and NC) tend to strongly underestimate erosion time probably due to the use of k- model. For AI, a contribution to helium transport is identified within the stratification (Figure 12), which is probably of numerical origin (balance between the pressure gradient and the buoyancy source term in the momentum equation). Finally, BI and JJ obtain results very similar to the experiment.
(a) (b)
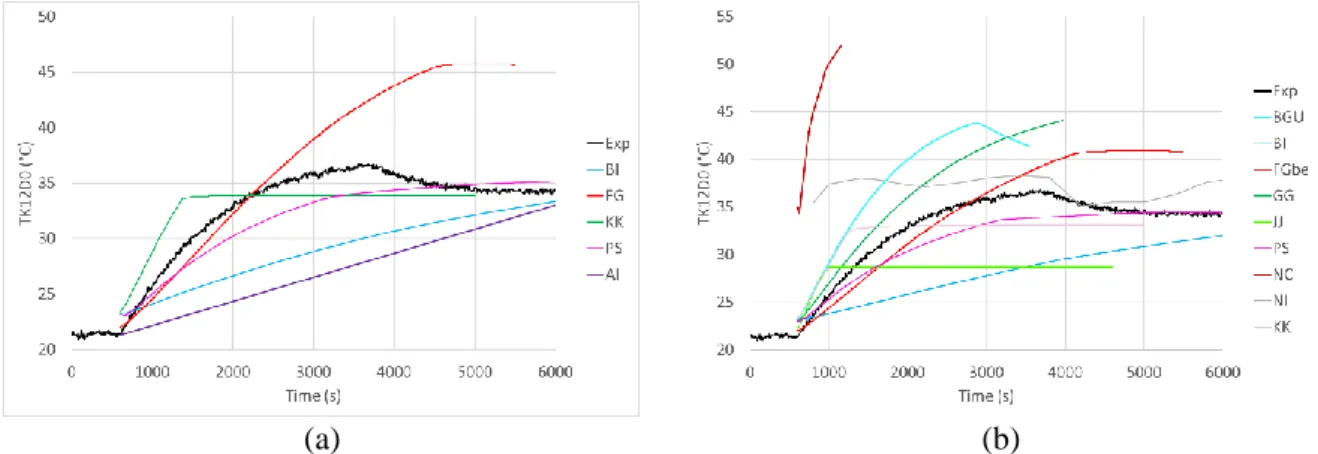
Figure 11: HM1-1 – Wall temperature for blind (a) and open (b) simulations.
It is also interesting to focus on the prediction of the inner cylinder temperature. We have few measurement points in the experiment. The evolution of the wall temperature at point TK12D0 (r=0.953 m, z=5.151 m and =345°) is shown in Figure 11 for both phases of the calculation exercise. The evolution of temperature is roughly reproduced by some contributions. The local temperature depends on heating on the buoyant jet side, conduction and natural convection cooling on the inner side of the cylinder. We have seen that completely neglecting the heating of the inner cylinder leads to a significant overestimation of gas temperatures. However, the weight of the heat exchange models used on gaseous temperature and stratification erosion results is difficult to estimate. BI for example, strongly underestimates the wall temperature at this point with predicting accurately the overall behavior. Is it a local effect or is the energy absorbed by the cylinder underestimated? To answer this question, more thermocouples were needed in the experiment.
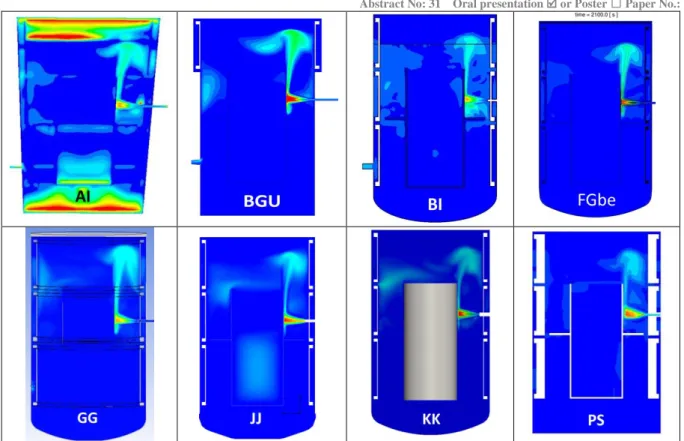
Code to code comparison of some key variables can also be of interest. We focus on two variables at the time t= 2100 seconds before the end of the erosion of the stratification. The first quantity is the effective diffusion coefficient (sum of the molecular contribution and the turbulent contribution - Figure 12). We have already discussed the strange behavior within the gas stratification for AI. One can also note a zone probably not resolved enough below the lateral jet in the BI contribution. Then, the other results are similar with an upward buoyant jet that detaches from the inner cylinder in its upper part. An outflow effect behind the upper condenser (KK and AI) is also identified in some contributions.
Abstract No: 31 Oral presentation or Poster □ Paper No.:
14
Figure 12: HM1-1 – Effective mass diffusion coefficient (0-0.01 m²/s) at t=2100 seconds .
The temperature field in the mid-plane (=315°) at this particular time is the second variable of interest (Figure 13). The chosen scale allows to identify the temperature differences for the different contributions. BGU, KK and FG predict higher temperatures than GG and JJ. BI calculates a more extended jet recirculation below the injection than other contributors.
Abstract No: 31 Oral presentation or Poster □ Paper No.:
15
Finally, GG carried out a sensitivity study to consider radiative transfer. The results show that the gas temperature in the upper parts decreases and the mixing time is reduced, making them more consistent with the experimental results. However, properties such as emissivity and absorption coefficient must be consolidated.
5. Conclusions
This calculation exercise with its two phases highlighted the difficulties in calculating this complex flow including an impinging lateral jet forming a diffuse upward buoyant flow pattern which interacts with a gas stratification.
The results show that the erosion time, blindly predicted, has a disparity of +/- 30% with an imposed turbulence model. This difference is greatly reduced when each user's specific experience is included in the choice of turbulence model. On this point, there is consensus to say that the standard k- model does not allow to model these complex phenomena and that a more elaborate model is then necessary without reaching a consensus on which model. The gas temperature is generally overestimated by the models compared to the experiment, without having really concluded on the origin of this overestimation. Heat exchange models and the effect of water vapor on radiative heat transfer were mentioned as possible sources of differences. To capture the flow structure generated by the impinging horizontal jet, a minimal mesh density seems necessary in order not to diffuse too much the flow structures.
The use of a common numerical model has made it possible to make a conclusion that under the term 'standard' are hidden different models. Sharing the mesh in a future exercise seems to be essential for progress. We also need to think about how to better characterize CFD contributions. An attempt to compare the flow evolutions through internal surfaces did not give any satisfactory results. We will also probably have to look at integral quantities to better understand the differences.
It is also important to specify that this work is still ongoing beyond the HYMERES project because additional tests have been carried out in order to examine the models for parameter variation [15]. For example, the air injection rate was varied, as was the strength of the stratification. This is to verify that the model adjustment made on one case remains valid for other initial and boundary conditions.
Acknowledgements
The authors wish to acknowledge the CEA staff who carried out these experiments: D. Adbo, O. Norvez and J.L. Widloecher. Acknowledgements are also extended to all OECD/NEA countries that supported the HYMERES project and to the members of the Management Board for releasing data of the HM1-1 test and thus involving a larger number of institutes in this calculation exercise.
References
[1] E. Deri, D. Abdo, and B. Cariteau, “Air fountains in the erosion of gaseous stratifications,” Int. J. Heat Fluid Flow, vol. 31, no. 5, pp. 935–941, 2010.
[2] S. Schwarz, K. Fischer, A. Bentaib, and R. Liang, “Benchmark on hydrogen distribution in a containment based on the OECD-NEA THAI HM-2 experiment,” Nucl. Technol., vol. 175, no. 3, pp. 594–603, 2011.
[3] E. Studer, J. Brinster, I. Tkatschenko, G. Mignot, D. Paladino, and M. Andreani, “Interaction of a light gas stratified layer with an air jet coming from below: Large scale experiments and scaling issues,” Nucl. Eng. Des., vol. 253, pp. 406–412, 2012.
[4] M. Andreani, R. Kapulla, and R. Zboray, “Gas stratification break-up by a vertical jet: Simulations using the GOTHIC code,” Nucl. Eng. Des., vol. 249, pp. 71–81, 2012.
Abstract No: 31 Oral presentation or Poster □ Paper No.:
16
[5] S. Abe, M. Ishigaki, Y. Sibamoto, and T. Yonomoto, “Experimental and numerical study on density stratification erosion phenomena with a vertical buoyant jet in a small vessel,” Nucl. Eng. Des., vol. 303, pp. 203–213, 2016.
[6] M. Freitag, E. Schmidt, S. Gupta, and G. Poss, “Simulation benchmark based on
THAI-experiment on dissolution of a steam stratification by natural convection,” Nucl. Eng. Des., vol. 299, pp. 37–45, 2016.
[7] M. Andreani, A. Badillo, and R. Kapulla, “Synthesis of the OECD/NEA-PSI CFD benchmark exercise,” Nucl. Eng. Des., vol. 299, pp. 59–80, 2016.
[8] M. Andreani et al., “Synthesis of a blind CFD benchmark exercise based on a test in the PANDA facility addressing the stratification erosion by a vertical jet in presence of a flow obstruction,” presented at the Proceedings of the 6th OECD/NEA Workshop on Computational Fluid Dynamics for Nuclear Reactor Safety (CFD4NRS-6), MIT, Cambridge, MA_USA, 2016.
[9] E. Studer, J. P. Magnaud, F. Dabbene, and I. Tkatschenko, “International standard problem on containment thermal–hydraulics ISP47: Step 1—Results from the MISTRA exercise,” Nucl. Eng. Des., vol. 237, no. 5, pp. 536–551, 2007.
[10] J. Malet et al., “Sprays in containment: Final results of the {SARNET} spray benchmark,” Nucl. Eng. Des., vol. 241, no. 6, pp. 2162–2171, 2011.
[11] E. Studer et al., “Hydrogen mobilization by Passive Autocatalytic Recombiners,” in NUTHOS-11: The 11th International Topical Meeting on Nuclear Reactor Thermal Hydraulics, Operation and Safety, Gyeongju, Korea, October 9-13, 2016.
[12] F. Dabbene et al., “Experimental Activities on Stratification and Mixing of a Gas Mixture under the Conditions of a Severe Accident with Intervention of Mitigating Measures Performed in the ERCOSAM-SAMARA Project,” in International Congress on Advances in Nuclear Power Plants (ICAPP 15), Nice, France May 3-6, 2015.
[13] A. S. Filippov, S. Grigoryev, and O. V. Tarasov, “On the possible role of thermal radiation in containment thermal-hydraulics experiments by the example of CFD analysis of TOSQAN T114 air-He test,” Nucl. Eng. Des., vol. 310, pp. 175–186, 2016.
[14] S. Nam and R. G. Bill, “Numerical simulations of thermal plumes,” Fire Saf. J., vol. 21, pp. 231– 256, 1993.
[15] S. Abe, E. Studer, M. Ishigaki, Y. Sibamoto, and T. Yonomoto, “Sratification breakup by a diffuse buoyant jet: the MISTRA HM1-1 and 1-1bis experiments and their CFD analysis,” Nucl. Eng. Des., vol. 331, pp. 162–175, 2018.