HAL Id: cea-02614125
https://hal-cea.archives-ouvertes.fr/cea-02614125
Submitted on 20 May 2020HAL is a multi-disciplinary open access archive for the deposit and dissemination of sci-entific research documents, whether they are pub-lished or not. The documents may come from teaching and research institutions in France or abroad, or from public or private research centers.
L’archive ouverte pluridisciplinaire HAL, est destinée au dépôt et à la diffusion de documents scientifiques de niveau recherche, publiés ou non, émanant des établissements d’enseignement et de recherche français ou étrangers, des laboratoires publics ou privés.
Impact of experimental correlation on transposition
method carry out with critical integral experiments
T. Nicol, C. Carmouze
To cite this version:
T. Nicol, C. Carmouze. Impact of experimental correlation on transposition method carry out with critical integral experiments. ICNC 2019 - 11th International conference on Nuclear Criticality Safety, Sep 2019, Paris, France. �cea-02614125�
ICNC 2019 - 11th International conference on Nuclear Criticality Safety
September 15-20, 2019 – Paris, France
IMPACT OF EXPERIMENTAL CORRELATION ON TRANSPOSITION
METHOD CARRIED OUT WITH CRITICAL INTEGRAL EXPERIMENTS
Tangi NICOL
(1)*, Coralie CARMOUZE
(1)(1)
CEA, DEN, DER, SPRC, Cadarache, F-13108 SAINT-PAUL-LEZ-DURANCE, FRANCE
* [email protected]
ABSTRACT
In order to estimate the bias on the effective multiplication factor (keff) of a criticality
application case, and the associated uncertainty due to Nuclear Data (ND), a method which takes advantage of the integral experiments information and is based on ND sensitivity/uncertainty analyses and adjustment, has been implemented in a tool called RIB (Représentativité, Incertitude, Biais). Such methodology has been worldwide studied for years in various fields. The RIB tool, developed at CEA, is related to the experimental validation database of the French criticality-safety package, CRISTAL V2.0, containing more than 2000 experiments from the International Criticality Safety Benchmark Evaluation Project handbook (ICSBEP) and French experimental programs. In most cases, even if a correlation is identified between the experiments, the value of this correlation might not be known.
Validation tests of the RIB tool, in particular by arbitrary applying strong correlations between integral experiments (>0.9), point out some unrealistic results: a strong deviation of the bias with significant reduction of the uncertainty due to ND. To check the RIB tool implementation, transposition method equations have been implemented in Matlab. Another tool developed at CEA and dedicated to ND evaluation, CONRAD (COde for Nuclear Reaction Analysis and Data Assimilation), has also been used to estimate bias and uncertainty due to ND through the transposition method using integral experiments. Results obtained with these three tools from several combinations « Application case/integral experiments », have been compared, confirming the RIB observed tendencies. Focusing on the post-adjustment ND, it seems that such phenomenon is associated to a strong variation of the cross sections which may be due to Peelle’s pertinent puzzle effect. This paper describes the different tools and presents the results obtained for the tested combinations « Application case/integral experiments » in function of the experimental correlation factor. Some potential explanations of the observed results, using strong experimental correlation factors, are discussed.
KEY WORDS
Statistical adjustment, Experimental correlation, CRISTAL.
1. INTRODUCTION
Criticality studies cover a wide range of application. One of the main issues of criticality-safety studies concerns the calculation tools validation and its applicability according to the studied configuration. In this context, discussions are being held at an international level and more particularly within the former expert group on Uncertainty Analyses on Criticality Safety Assessment (EG-UACSA) [1] of the OECD NEA Working Party on Nuclear Criticality Safety (WPNCS).
The CRISTAL V2 criticality-safety package [2] [3], mainly used by industries in France, is associated with an experimental validation database of over 2000 experiments from International Criticality Safety Benchmark Evaluation Project handbook (ICSBEP) [4] and French experimental programs. A method based on Nuclear Data (ND) adjustment [5] [6], offers the possibility to take advantage of this database in order to estimate the bias and the associated uncertainty due to ND of an application case. Such methodology has
2
been studied for years in the criticality safety field [1]. More details and examples of ND adjustment methodologies used worldwide are given in the OCDE report from Subgourp 33 of the Working Party on International Nuclear Data Evaluation Co-operation (WPEC) [7]. Among many other one, the method relies heavily on the hypothesis that calculation method does not introduce any bias, and thus discrepancies between calculations and experiments are only due to ND. Furthermore, the quality of the results is strongly dependent on the ND, experimental uncertainties and correlation reliability. Moreover, the correlations factor applied between the integral experiments are still an issue [8] [9].
In order to apply this method in the frame of the CRISTAL V2 criticality-safety package, the RIB (Représentativité, Incertitude, Biais) tool [10] has been developed by CEA and attached to the CRISTAL V2 experimental validation database. ND variance and covariance are based on JEFF-3.1.1 [11] evaluation and the CEA COMAC library [12]. The correlations between experiments from the database come from DICE [13]. Even if a correlation is identified between the experiments, the correlation factor is, in most cases, unknown. It can be noticed that the purpose of such tool is not ND adjustment; however the method implies ND modification in order to improve the agreement between calculated and measured integral parameters. This paper follows up the test phase of the RIB tool, which shows some unrealistic results. During this test phase, several tests were performed, in particular an analysis of the impact of the experimental correlation factors on the results. Illogical variations of the ND bias and unrealistic reduction of the ND uncertainty have been pointed out in some cases involving strong experimental correlation factors. Indeed, in such cases, the resulting ND bias is much higher than the calculation/experiment ratio of the correlated integral experiments and/or the posterior ND uncertainty is lower than the one obtained without experimental correlation.
The purpose of this paper is to highlight the configurations conducting to such unrealistic results and to explain these trends and their causes.
Firstly, the method is introduced. Secondly, the various tools and configurations considered in this study are described. Indeed, to exclude any implementation issues, the proper operation of the RIB tool has been confirmed by contrasting the results from different tools such as MATLAB [14], or CONRAD (dedicated to ND evaluation) [15]. Finally, the ND bias on the integral parameter and the nuclear data uncertainty reduction, as a function of experimental correlation factor, are discussed. In a first approach, the impact of the chosen application case and integral experiments is investigated. Then a closer look is taken at the impact on post-adjustment cross sections.
2. METHODOLOGY
The method is based on the ND statistical adjustment method and allows the assessment of ND calculation bias and posterior uncertainty [5] [6]. This is based on the Bayes theorem generalized to continuous variables which can be resumed as equation (1) resulting in equation (2) with the hypothesis that prior and likelihood are Gaussian, and equation (3) by making the hypothesis that posterior is also Gaussian.
𝑝𝑜𝑠𝑡𝑒𝑟𝑖𝑜𝑟 ∝ 𝑝𝑟𝑖𝑜𝑟 × 𝑙𝑖𝑘𝑒𝑙𝑖ℎ𝑜𝑜𝑑 ∝ exp (−1 2[( 𝜎 − 𝜎𝑝 𝜎𝑝 ) 𝑇 ∙ 𝐷𝜎−1∙ ( 𝜎 − 𝜎𝑝 𝜎𝑝 ) + (𝐶(𝜎) − 𝐸 𝐸 ) 𝑇 ∙ 𝐷𝐸−1∙ ( 𝐶(𝜎) − 𝐸 𝐸 )]) ∝ exp (−1 2( 𝜎 − 𝜎∗ 𝜎∗ ) 𝑇 ∙ 𝐷𝜎∗ −1∙ ( 𝜎 − 𝜎∗ 𝜎∗ )) (1) (2) (3)
With 𝜎 the multi-group ND vector, 𝜎𝑝 the prior ND vector (used in calculation), 𝐷𝜎 the prior ND covariance
matrix, 𝐶(𝜎) the integral parameter vector, 𝐸 the measured integral parameter vector, 𝐷𝐸 the experimental
3
The analytical solution is then given by minimising the equation (4) (generalised least-squares) :
𝜒𝐺𝐿𝑆2 = ( 𝜎 − 𝜎𝑝 𝜎𝑝 ) 𝑇 ∙ 𝐷𝜎−1∙ ( 𝜎 − 𝜎𝑝 𝜎𝑝 ) + (𝐶(𝜎) − 𝐸 𝐸 ) 𝑇 ∙ 𝐷𝐸−1∙ ( 𝐶(𝜎) − 𝐸 𝐸 ) (4)
Using the assumption that the integral parameter can be represented by a linear function
𝐶(𝜎) − 𝐶(𝜎𝑝)
𝐶(𝜎𝑝)
= 𝑆𝑇∙ (𝜎 − 𝜎𝑝 𝜎𝑝
)
(5)
With S the integral parameter sensitivities vector to ND, defined by equation (6) 𝑆 =𝜕𝐶(𝜎)
𝜕𝜎 ∙ 𝜎𝑝
𝐶(𝜎𝑝) (6)
The solution of the minimization is given by equation (7)
𝜎∗− 𝜎𝑝
𝜎𝑝
= 𝐷
𝜎∙𝑆
∙(𝐷
𝐸+ 𝑆
𝑇∙𝐷
𝜎∙𝑆)
−1∙ (𝐸 −
𝐶(𝜎𝑝) 𝐶(𝜎𝑝)) (7)
And the associated covariance matrix can be writing as equation (8) or (9)
𝐷
𝜎∗ −1= 𝐷
𝜎−1+ 𝑆
∙𝐷
𝐸−1∙𝑆
𝑇𝐷
𝜎∗= 𝐷
𝜎− 𝐷
𝜎∙𝑆
∙(𝐷
𝐸+ 𝑆
𝑇∙𝐷
𝜎∙𝑆)
−1∙𝑆
𝑇∙𝐷
𝜎(8) (9)
The computational ND bias y* and its associated posterior uncertainty εA* are given by:
𝑦∗=𝐶(𝜎 ∗) − 𝐶(𝜎 𝑝) 𝐶(𝜎𝑝) = 𝑆𝐴𝑇∙ ( 𝜎∗− 𝜎𝑝 𝜎𝑝 )
(𝜀
𝐴∗)
2=
𝑆 𝐴 𝑇∙𝐷
𝜎∗∙
𝑆𝐴 (10) (11)Introducing the following notations:
- ND uncertainty of the application case A and the integral experiment Ei
4
- Similarity factor between the integral experiment Ei and the application case A [6]
𝑟𝑖 =
𝑆𝐴𝑇𝐷𝜎𝑆𝐸𝑖
𝜀
𝐴×𝜀
𝐸𝑖(13)
- Similarity factor between the two integral experiment E1 and E2 with experimental uncertainties 𝛿𝐸1
and 𝛿𝐸2 and an experimental correlation F
𝑟̂ =12
𝑆𝐸1𝑇 𝐷𝜎𝑆𝐸2+ 𝛿𝐸1𝛿𝐸2𝐹
𝜀
𝐸1×𝜀
𝐸2(14)
- The « weight » of each integral experiment 𝑤𝑖
𝑤𝑖 =
1 1 + 𝛿𝐸𝑖²
𝐸𝑝𝑠𝐸𝑖²
(15)
Similarity factor and weight have a strong meaning in case of one integral experiment. If the latter is very similar to the considered application case (r1≈1), the experiment would influence the result as much as its
experimental uncertainty is low compare to the ND uncertainty (w close to 1).
It can be noticed that the interpretation of such parameters using two, or more, integral experiments, is more difficult due to cross-terms between the two experiments, as shown in equation (16) and (17), respectively for the posterior ND bias and its associated posterior uncertainty.
𝑦∗=
𝜀
𝐴 1 − 𝑟̂ 𝑤12 1𝑤2 [𝑟1𝑤1𝜀
𝐸1 × 𝑌𝐸1+ 𝑟2𝑤2𝜀
𝐸2 × 𝑌𝐸2− 𝑟̂ 𝑤12 1𝑤2( 𝑟2𝜀
𝐸1× 𝑌𝐸1+ 𝑟1𝜀
𝐸2× 𝑌𝐸2)] (16)𝜀
𝐴∗²𝜀
𝐴² = 1 − 1 1 − 𝑟̂ ²𝑤12 1𝑤2 (𝑟1√𝑤1− 𝑟2√𝑤2) 2 − 2√𝑤1𝑤2 1 − 𝑟̂ √𝑤12 1𝑤2 𝑟1𝑟2 (17) 3. TOOLSkeff sensitivities to nuclear data are calculated using the First Order Perturbation Theory implemented in
APOLLO2 [16], using the JEFF-3.1.1 evaluation [11]. Nuclear datavariance and covariance are based on the JEFF-3.1.1 evaluation and the CEA COMAC library [12]. Sensitivity coefficients to the cross sections and multiplicities of the main isotopes were derived on the European JEF 15-group structure. Furthermore, only capture, fission, multiplicity, and scattering reactions have been considered.
The method is implemented in a java tool developed by CEA, named RIB for Représentativité, Incertittude, Biais. This tool, based on equations (7) and (9), is integrated to the experimental validation database of the French criticality-safety package CRISTAL V2.0. This package is now available on request on the OCDE website.
MATLAB [14] is a platform allowing direct matrix or array calculation implementation. Equations (16) and (17) have been implemented with MATLAB to check the results obtained with the RIB tool.
5
CONRAD [15] (COde for Nuclear Reaction Analysis and Data Assimilation) is a C++ code developed at CEA, dedicated to nuclear data assimilation. This code is also able to analyze integral experiment in order to adjust nuclear reaction model parameters or to adjust multigroup cross-sections. In this study, we mainly focused on the transposition results on the integral parameter (keff bias and posterior uncertainty due to
nuclear data).
4. EXPERIMENTAL CORRELATION IMPACT
For this study, several arbitrary “Application case/Integral experiments” have been considered. The so called “application case” refers to a numerical configuration (calculated multiplication factor and corresponding sensitivities coefficients to ND). The method is performed on the latter in order to estimate its ND bias and associated posterior uncertainty. In this study, the method has been applied only on the basis of data from two integral experiments (calculation/experiment ratios, sensitivity coefficients to ND, uncertainties). On the grounds of efficiency, keff sensitivities coefficients to ND for “application case” were taken from the
experiment validation database of CRISTALV2.0. To ensure significant similarity factor between the application case and integral experiments, it was decided to keep the same type of fissile material, physical form and neutron spectrum, with the ICSBEP handbook notation [4] (Pu : plutonium; Sol : solution; Therm : thermal neutron spectrum). Table I summarizes the chosen configurations. Its is also mentioned in this table the similarity factors of the integral experiment with the chosen application case (r1 and r2, cf. equation (13)), as well as the one between the two integral experiments (r12), calculated with no experimental
correlation, see equation (14) with F=0. Finally, the experimental correlation information from the Database of the International handbook of evaluated Criticality safety benchmark Experiments (DICE) [12] is given. The ‘+’ sign means that correlation exists between experiments but no correlation factor is mentioned. Similarity factors equal to 1 correspond to a value higher than 0.99. For these three configurations, Table II gives the calculation over experiment ratios and experimental uncertainties of the integral experiments, as well as the uncertainty due to nuclear data (equation (12)) of the application case and integral experiments. Calculation over experiment ratios corresponds to the Monte-Carlo calculation route of CRISTAL V2.0.
Table I. "Application case/integral experiments" tested configurations, and the corresponding similarity factors from equations (13) and (14).
Case n° Application case Integral experiment 1 r1 Integral experiment 2 r2 DICE r12 1 Pu-Sol-Therm-021-10 Pu-Sol-Therm-001-1 0.95 Pu-Sol-Therm-001-3 0.92 + 1
2 Pu-Sol-Therm-002-7 Pu-Sol-Therm-001-1 1 Pu-Sol-Therm-001-3 1 + 1
3 Pu-Sol-Therm-021-10 Pu-Sol-Therm-001-1 0.95 Pu-Sol-Therm-009-3 0.92 + 0.80
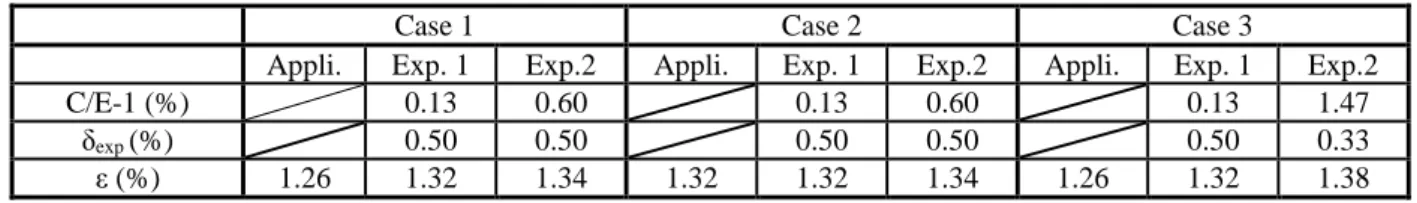
Table II. Uncertainties due to nuclear data (equation 12), experimental uncertainties and calculation/experiment relative ratios for the three configurations
Case 1 Case 2 Case 3
Appli. Exp. 1 Exp.2 Appli. Exp. 1 Exp.2 Appli. Exp. 1 Exp.2
C/E-1 (%) 0.13 0.60 0.13 0.60 0.13 1.47
δexp (%) 0.50 0.50 0.50 0.50 0.50 0.33
ε (%) 1.26 1.32 1.34 1.32 1.32 1.34 1.26 1.32 1.38
The method has been applied on the different cases imposing an experimental correlation factor of 0; 0.25; 0.5; 0.75 and 1. In case of CONRAD, for the resolution of equation (8), experimental covariance matrix must be regular, and then instead of 1, a value very close to 1 has been considered (0.9999).
First we focused on Case 1 which consists on arbitrary imposed experimental correlation between two integral experiments from the same experimental series. ND data bias and posterior uncertainty, obtained with the different tools for the considered experimental correlation factor, are given on Table III.
6
As shown in this table, except a few rounding effect, all three tools gives the same results for all the cases and all considered experimental correlation factors. Thus, the proper operation of the RIB tool has been confirmed.
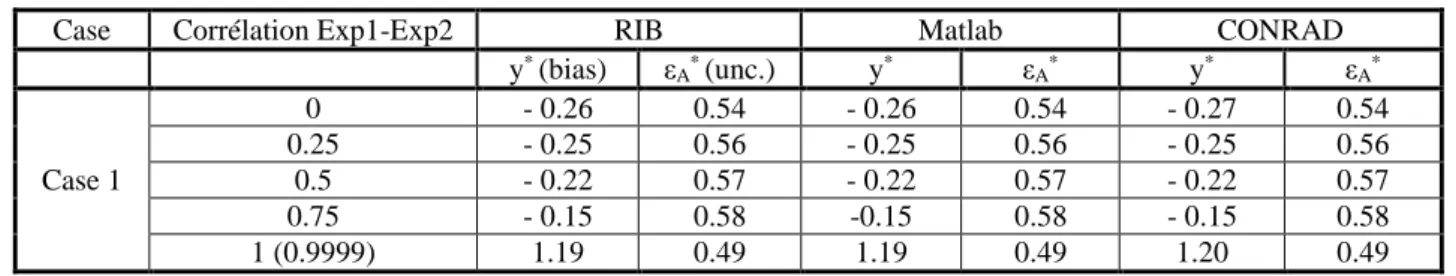
Table III. Posterior bias (%) and uncertainty due to nuclear data for all tested configurations, for five different experimental correlation factors and using Matlab, RIB or CONRAD
Case Corrélation Exp1-Exp2 RIB Matlab CONRAD
y* (bias) ε A* (unc.) y* εA* y* εA* Case 1 0 - 0.26 0.54 - 0.26 0.54 - 0.27 0.54 0.25 - 0.25 0.56 - 0.25 0.56 - 0.25 0.56 0.5 - 0.22 0.57 - 0.22 0.57 - 0.22 0.57 0.75 - 0.15 0.58 -0.15 0.58 - 0.15 0.58 1 (0.9999) 1.19 0.49 1.19 0.49 1.20 0.49
As expected with the use of similar experiments (similarity factors > 0.9, cf. Table I), we noticed a significant reduction of the uncertainty due to nuclear data. However, the variation of the bias is becoming very significant as the correlation factor is approaching to 1, and at the same time, the ND posterior uncertainty is significantly decreasing. One can notice that the sign of the bias is even changing with the increasing correlation factor. The latter seems unrealistic since measurements of two highly similar integral experiments appear underestimated by calculations. Let’s remember that calculation/experiment discrepancies are supposed to be only due to nuclear data. Nonetheless, the posterior results seem coherent with integral experiment data in respect to uncertainties. On the other hand, the expected posterior uncertainty due to nuclear data is not expected to decrease with increasing experimental correlation and even less expected to become lower than the one obtained without any experimental correlation. This might be a case of Peelle’s pertinent puzzle effect [17] which results in a posterior value out of range of the data, due to uncertainty considerations. An example of such phenomenon, observed on the adjustment of the first resonance of 239Pu capture cross-section, is given in [18]: due to systematic uncertainties, the effective cross
section after adjustment deviates from measurement points.
To understand the origin of these deviations, one way is to analyze the impact of the major data by performing sensitivity analyze. Then, it is interesting to consider:
i- Another ‘application case’, while keeping the same experimental cases than Case 1 (cf. Case 2). The ‘application case’ comes, in fact, from the CRISTAL experimental validation database.
ii-
Another experimental case, by changing only one of the two integral experiments and whilekeeping the same ‘application case’ than Case 1 (Case 3). For the latter, one can argue that it seems unrealistic to strongly correlated two experiments from different series. However, this might show if the observed variations are due to the use of a too high correlation factor between two experiments.
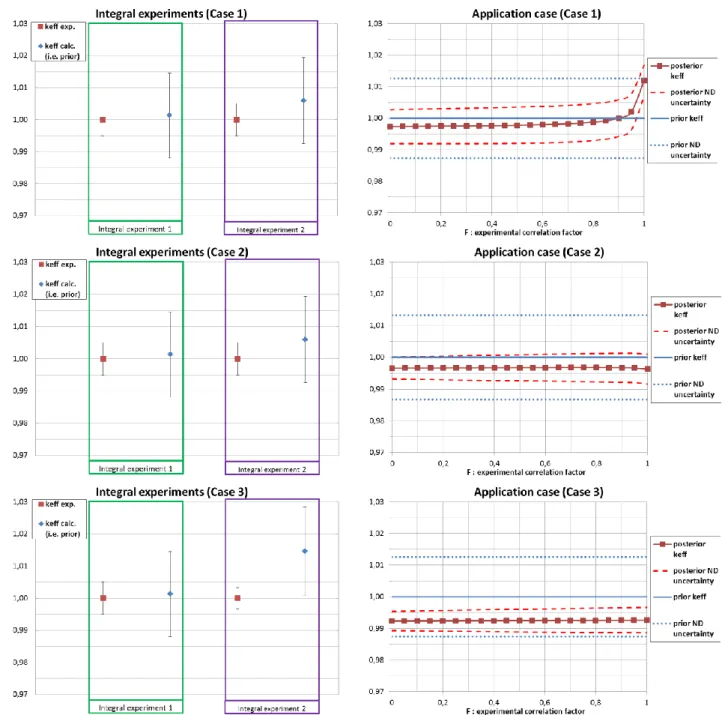
Using equations (16) and (17), it is easy to plot the posterior keff value, i.e. the keff application case modified
from the ND bias, and its corresponding uncertainty, i.e. ND posterior uncertainty, as functions of the correlation factor between the two integral experiments. Those plots are shown on the right part of Figure 1. The prior keff value and associated uncertainty due to nuclear data are also represented on the same plots. The
left part of Figure 1 confront the calculated keff with ND uncertainty, and the measured keff with
experimental uncertainty, of the two integral experiments from each of the three cases describes earlier. All uncertainties are given at 1σ.
7
Figure 1. On the left, experimental and calculated keff with their respective experimental uncertainty
and ND uncertainty. On the right, application case prior keff and ND uncertainty (in blue straight and
dot lines), and the posterior keff and ND uncertainty as a function of the correlation factor (in red
squares and dash line). Uncertainties are given at 1σ.
As well as for Case 1, a strong reduction of the ND uncertainty is observed for Case 2 and Case 3. On the other hand, for those two last cases, there is no strong variation of the application case ND bias, and the posterior ND uncertainty does not decrease with the increasing experimental correlation factor. On can notice that, in Case 3, the ND bias is not covered by the ND posterior uncertainty at 1σ. This is due to the strong calculation over experiment discrepancy of the second integral experiment used in this case (C-E ≈ 1.5%).
Furthermore, after testing several “application case/Integral experiments” configurations, no clear criterion connecting the experimental correlation factor values and the unrealistic trends have been highlighted. Nonetheless, using equation (16), it is possible, in the case of two integral experiments, to identify an experimental correlation factor value that would induce a bias due to ND that would only be a function of the calculation/experiment ratio of only one of the two experiments.
8
𝐹𝑙𝑖𝑚𝑖𝑡= 𝑚𝑖𝑛 [ (𝜀
𝐸𝑖2+ 𝜎
𝐸𝑖2)×
𝑆𝐴𝑇𝐷𝜎𝑆𝐸𝑗− 𝑆𝐴𝑇𝐷𝜎𝑆𝐸𝑖× 𝑆𝐸𝑖𝑇𝐷𝜎𝑆𝐸𝑗 𝑆𝐴𝑇𝐷𝜎𝑆𝐸𝑖× 𝜎𝐸𝑖× 𝜎𝐸𝑗 ] (18) with (i, j) = (1, 2) or (2, 1)For Case 1, equation (18) gives a Flimit value of about 0.8. Then, for this value of experimental correlation
factor (F=Flimit), the application ND bias will not be a combination of the calculation/experiment ratio of the
two experiments, but only related to one experiment. Furthermore, for higher value of the experimental correlation factor, this bias would somehow be a combination of the calculation/experiment ratio of one experiment and the opposite ratio of the other experiment. For Case 2 and Case 3, Flimit is higher than one.
Then, the experimental correlation factor will not reach such value, and the ND bias of the application case would stay a combination of both calculation/experiment ratios, for any experimental correlation factor value.
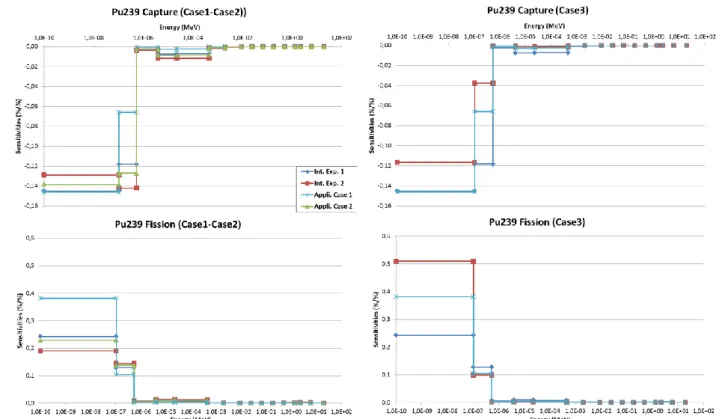
As shown before, the hypothesis that a too high experimental correlation factor has been arbitrary fixed between two different experiments does not seem to explain the whole behavior of Case 1. We then focused on the keff sensitivities profile of the different experiments, and on the corresponding cross-section trends
resulting from the methodology (equation (7)), respectively plot on Figure 2 and Figure 3. Since Case 1 and Case 2 are based on the two same integral experiments, they are plotted on the same graph (left part of Figure 2 and Figure 3).
It is clear then, that for Case 1, and even Case 2, applying strong experimental correlation between the two integral experiments induces some significant variation of the cross-sections, even higher than their uncertainties. Indeed, the highest uncertainties on 239Pu capture and fission cross-sections, in the 15 energy
groups COMAC covariance matrices, for energy groups lower than 10 keV, is about 7% and 3.5% respectively. This seems to support the hypothesis of Peelle’s pertinent puzzle effect occurrence.
Figure 2. 15 energy groups keff sensitivities (in %/%) to 239Pu capture and fission cross sections of the
integral experiments and application cases used in Case 1 and Case 2 (on the left), and Case 3 (on the right) configurations.
9
Figure 3. Trends (in %) on 239Pu capture and fission cross section from the adjustment methodology
using integral experiments from Case 1 and Case 2 (on the left), and Case 3 (on the right) configurations, and for five different value of experimental correlation (0, 0.25, 0.5, 0.75, and 1)
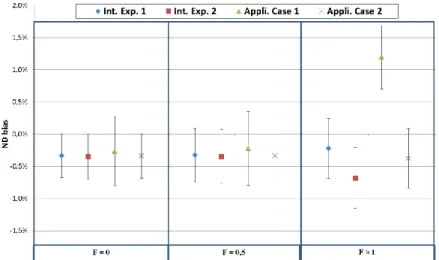
The significant variation observed on the ND bias and corresponding posterior uncertainty of Case 1, for high experimental correlation factor (see Figure 1), seems to be linked to a strong cross-section variation from adjustment methodology (of several percent, as shown in the figure above). Nonetheless, this link is not so obvious. Indeed, application of the method in Case 2 results in same significant post-adjustment cross-section variation as for Case 1, but no deviations were observed on the ND bias and corresponding posterior uncertainty (see Figure 1). As shown on Figure 2, the application case used in Case 2 has almost the same keff sensitivities to ND than the integral experiments (i.e. r ≈ 1). Then, ND bias (relative ratio
between integral parameter value before and after transposition) is about the same order for the application case than for the integral experiments, see Figure 4. Thus, no deviations are observed on the integral parameter for strong experimental correlation, on the opposite of Case 1. Error bars on Figure 4 are estimated using equation (12) with prior or posterior ND covariance matrices.
Figure 4. ND bias and corresponding posterior uncertainties (for three values of experimental correlations: 0; 0.5; and 1) for application cases and integral experiments from Case 1 and Case2.
10
5. CONCLUSIONSIn order to estimate the bias and the associated uncertainty due to nuclear data of a specific criticality application case, a method, based on nuclear data adjustment, has been implemented in a plugin related to the CRISTAL V2 criticality-safety package experimental validation database. By supposing that discrepancies between calculation and experiment from the database are only due to nuclear data, this plugin offers the possibility to take advantages of the experiments from the CRISTAL V2 experimental validation database (more than 2000 experiments from ICSBEP and French experimental programs).
To check the implementation of the RIB tool, several tests were performed, in particular to analyse the impact of the experimental correlation factors on the results. During this test phase, some unrealistic results have been pointed out such as illogical variations of the ND bias and unrealistic reductions of the ND uncertainty for some cases involving strong experimental correction factors. Indeed, in such cases, the resulting ND bias is much higher than the calculation/experiment ratio of the correlated integral experiments and/or the posterior ND uncertainty is lower than the one obtained without experimental correlation.
The purpose of this paper is to highlight the configurations leading to such unrealistic results and to explain these trends and their causes.
First, to exclude any implementation issues, the proper operation of the RIB tool has first been confirmed by contrasting the results from different tools such as MATLAB [14], or CONRAD (dedicated to nuclear data evaluation) [15]. It has been confirmed that these results were not due to RIB implementation. However the unrealistic trends appear when the experimental cases are strongly correlated. After testing several configurations, no specific criterion on the experimental correlation factor has been found. Nevertheless, from the simplified equation using two integral experiments it has been noticed that, in some cases, it is possible to found an experimental correlation value which cancels the contribution of one of the two integral experiments.
Moreover, the analysis of the macroscopic results (keff ND bias and posterior uncertainty) of various tested
configurations has shown that the hypothesis assuming a correlation between highly correlated experiments and unrealistic results was not trivial. For some configurations presented in this paper, unrealistic results are not observed by using highly correlated experiments. Furthermore, by focusing on the trends on the cross-section induced by the adjustment methodology, it appears that those behaviours on the integral parameter of the application case correspond to very strong cross-section variation. The latter being out of range of the cross-section uncertainties, this suggests Peelle’s pertinent puzzle. Further studies may be performed to try to adapt methods, such as marginalisation, which has shown its ability to counter this effect in nuclear data assimilation [18]. This study has also shown that, under certain conditions, post-adjustment ND behaviors that would suggest some adjustment issues do not result in unrealistic behaviors on the integral parameter. However, works, such as performed by the OECD NEA WPNCS subgroup 1 to study the role of Integral Experiment Uncertainties and Covariance Data in Criticality Safety Validation [19], might somehow avoid the appearance of such anomalous results as the determination of the correlation factor might probably not result in such a high value as thus imposed in this study. This work confirmed that the method’s reliability also depends strongly on the not so easy task of experimental correlation determination. Until those experimental correlation factors are fully determined, for the use of the RIB tool, it has been decided to recommend avoiding the use of correlated experiment.
ACKNOWLEDGMENTS
The authors wish to thank ORANO and EDF for their partial financial support. REFERENCES
[1] “Overview of approaches used to determine calculational bias in criticality safety assessment,” NEA/NSC/WPNCS/DOC(2013)7, OECD-NEA, (2013).
[2] J.M. Gomit et al., “CRISTAL V2: New package for criticality calculations,” Proceeding of the Nuclear
11
[3] E. Gagnier, F.X. Giffard, N. Leclaire, I. Duhamel, C. Carmouze,, C. Riffard, “Experimental validation of the CRISTAL V2.0 French criticality calculation package,” Proceeding of International Conference on
Nuclear Criticality and Safety, ICNC 2015, Charlotte, North Carolina, USA, September 13 - 17, (2015).
[4] “International Handbook of Evaluated Criticality Safety Benchmark Experiments,” NEA/NSC/DOC(95)03, OECD-NEA, September 2011 Edition.
[5] Gandini, A., M. Petilli, M. Salvatores, “Nuclear Data and Integral Measurement. Correlation for Fast Reactors. Statistical Formulation and Analysis of Methods. The Consistent Approach.” Symposium of
Physics of Fast Reactors, Tokyo, Japan (1973).
[6] V.V. Orlov et al., “Problems of Fast Reactors Physics Related to Breeding,” Atomic Energy Review, Vol. 184, pp. 989-1077 (1980).
[7] “Methods and issues for the combined use of integral experiments and covariance data,” NEA/NSC/WPEC/DOC(2013)445, OECD/NEA, (2013).
[8] T.T. Ivanova, M.N. Nikolaev, K.F. Rasbach, E.V. Rozikhin, and M. Tsiboulia, “Influence of the correlations of experiments uncertainties on criticality prediction”, Nuclear Science and Engineering, Vol. 145, pp. 97-104 (2003).
[9] E. Peters, F. Sommer, M. Stuke, “Modeling of critical experiments and its impact on integral covariance matrices and correlation coefficients,” Annals of Nuclear Energy, Vol. 92, pp. 355-362 (2016).
[10] C. Venard, A. Santamarina, A. Leclainche, C. Mounier, “The RIB tool for the determination of computational bias and associated uncertainty in the CRISTAL criticality-safety package,” Proceeding of the
Nuclear Criticality-Safety Division Topical Meeting, NCSD 2009, Richland, Washington, USA,
Sepetember 13-17 (2009).
[11] A. Santamarina et al., “The JEFF-3.1.1 Nuclear Data Library NEA Data Bank,” JEFF Report 22, OECD-NEA data bank (2009).
[12] P. Archier et al., “COMAC Nuclear data covariance matrices library for reactor applications,”
Proceeding of the International Conference PHYSOR 2014, Kyoto, Japan, September 28 –October 3 (2014).
[13] “Database for the International Criticality Safety Benchmark Evaluation Project (DICE),” OECD-NEA, September 2016 Edition, build 2.8, (2016)
.
[14] MATLAB and Statistics Toolbox Release 2015a, The MathWorks, Inc., Natick, Massachusetts, United States.
[15] C. de Saint Jean, B. Habert, O. Litaize, G. Noguere, C. Suteau, “Status of CONRAD, a nuclear reaction analysis tool,” International Conference on Nuclear Data for Science and Technology, ND 2007, Nice, France, April 22-27 (2007).
[16] R. SANCHEZ et al., “APOLLO2 year 2010,” Nuclear Engineering and Technology, vol. 42, pp. 474-499 (2010).
[17] R. Peelle, “Peelle’s Pertinent Puzzle,” Oak Ridge National Laboratory Memorandum, Washington DC, USA (1987).
[18] C. De Saint Jean et al., “Evaluation of Neutron-induced Cross Sections and their Related Covariances with Physical Constraints,” Nuclear Data Sheets, Vol. 148, pp. 383-419 (2018).
[19] A. Hoefer et al., “Proposal for Benchmark Phase IV Role of Integral Experiment Covariance Data for Criticality Safety Validation,” Benchmark proposal, OECD-NEA (2015).