HAL Id: hal-01308598
https://hal.sorbonne-universite.fr/hal-01308598
Submitted on 28 Apr 2016
HAL is a multi-disciplinary open access archive for the deposit and dissemination of sci-entific research documents, whether they are pub-lished or not. The documents may come from teaching and research institutions in France or abroad, or from public or private research centers.
L’archive ouverte pluridisciplinaire HAL, est destinée au dépôt et à la diffusion de documents scientifiques de niveau recherche, publiés ou non, émanant des établissements d’enseignement et de recherche français ou étrangers, des laboratoires publics ou privés.
Comparison of different methods for measuring the
passive film thickness on metals
Marie Benoit, Christian Bataillon, B. Gwinner, Frédéric Miserque, Mark E.
Orazem, Carlos Sánchez-Sánchez, Bernard Tribollet, Vincent Vivier
To cite this version:
Marie Benoit, Christian Bataillon, B. Gwinner, Frédéric Miserque, Mark E. Orazem, et al.. Compar-ison of different methods for measuring the passive film thickness on metals. Electrochimica Acta, Elsevier, 2016, 201, pp.340-347. �10.1016/j.electacta.2015.12.173�. �hal-01308598�
C
OMPARISON OF DIFFERENT METHODS FOR MEASURING
THE PASSIVE FILM THICKNESS ON METALS
Marie BENOIT,
1,2Christian BATAILLON,
3Benoit GWINNER,
2Frédéric
MISERQUE,
3Mark E. ORAZEM,
4Carlos M. SÁNCHEZ-SÁNCHEZ,
1Bernard
TRIBOLLET,
1Vincent VIVIER
1,*1 Sorbonne Universités, UPMC Univ Paris 06, CNRS, Laboratoire Interfaces et Systèmes
Electrochimiques, 4 place Jussieu, F-75005, Paris, France
2 CEA, DEN, DANS, DPC, SCCME, Laboratoire d’Etude de la Corrosion Non Aqueuse,
F-91191 Gif-sur-Yvette, France
3 CEA, DEN, DANS, DPC, SCCME, Laboratoire d’Etude de la Corrosion Aqueuse, F-91191
Gif-sur-Yvette, France
4 Department of Chemical Engineering, University of Florida, Gainesville, Florida 32611,
USA
Abstract
In situ electrochemical impedance spectroscopy (EIS) and ex situ X-ray photoelectron
spectroscopy (XPS) measurements on electrogenerated zirconium oxide films on zirconium (Zr/ZrO2) were used to quantify the oxide film thickness and resistivity profiles through the
oxide. The EIS analysis presented here takes advantage of the high-frequency domain at which the constant-phase element (CPE) behavior of the oxide film reverts to a capacitive response and the Cole-Cole representations of the complex capacitance to extract the high-frequency capacitance of the oxide film without reference to the nature of the time-constant distribution within the oxide film. The film thickness of the ZrO2 samples measured from the
high-frequency capacitance of EIS were in good agreement with the thickness obtained from XPS. Moreover, the EIS analysis presented is based on the use of the integral solution of the power law model, which allows to obtain in one single EIS experiment, both the film thickness and the resistivity profile in the ZrO2 film. This work suggests a convenient
graphical method to extract film properties and serves to validate a key assumption of the power-law model for interpretation of CPE parameters in terms of physical properties.
1. Introduction
The film thickness of passive layers represents a critical parameter in many relevant applications in electrochemistry such as photovoltaic or corrosion [1]. For this reason, several techniques have been employed to accurately measure the film oxide thickness on different metals. Those techniques are mainly based on either optical (ellipsometry) [2,3,4], electronic (X-ray photoelectron spectroscopy (XPS)) [5,6] or electric (electrochemical impedance spectroscopy (EIS)) [7,8] properties. Among them, EIS is a widely used technique, which allows investigation of different processes at the electrode/electrolyte interface [9]. Moreover, the use of an electrical equivalent circuit may represent a convenient approach for the analysis of electrochemical impedance data. However, it may result in difficulties for physical interpretation as soon as a time-constant distribution appears [10,11], which is usually represented in the equivalent circuit by a constant phase element (CPE). For instance, in the simplest case of a blocking film on the electrode surface, the electrochemical impedance Z can be expressed as described in equation 1.
𝑍 𝜔 = 𝑅%+ ()'*+ (1)
where Re is the Ohmic resistance of the electrolyte, and 𝑄 and 𝛼 are the CPE parameters (independent of the frequency ω). Eq.1 can also be generalized to any electrochemical process, but for any final expression of the impedance, the CPE only corresponds to a pure capacitance when 𝛼 = 1. For this reason, we try to point out in this work the different limitations in the use of a CPE in the equivalent circuit for measuring the passive film thickness. Moreover, we provide a novel approach to exploit the EIS data, which allows to obtain both the film thickness and the resistivity values in the electrode/film and the film/electrolyte interfaces. So far, different formulas have been devised to extract an effective capacitance from the CPE parameters [12,13], since a CPE cannot be directly substituted by a
capacitance. Nevertheless, such a transformation must be based on assumptions regarding the physical origin of the time-constant distribution. For instance, the Hsu and Mansfeld formula [13] has been used to investigate the electronic properties of passive films on Ni and Ti electrodes [14], or the inhomogeneous distribution of charge in the catalyst layer of a polymer electrolyte fuel cell [15]; whereas, the Brug formula [12] has been used to study the surface roughness of Au porous electrodes [16], to investigate differential capacitance on Ag [17] and Cu [18] single crystal electrodes, but also for the properties of passive films formed on Cr and C22 alloy electrodes [19]. The feasibility of some of those formula have been already discussed in Ref. [11], where it was highlighted that a key point for data analysis is to identify the origin of the time-constant distribution. In their seminal work, Jorcin et al. have used local electrochemical impedance spectroscopy (LEIS) to discriminate between radial and normal surface distributions [20], knowing that the latter corresponds to a distribution of physical properties inside of a thin layer such an oxide film. This approach has then been used to devise a power-law model that accounts for the influence of resistivity distribution along the normal direction to the electrode surface [21]. The power-law model has been already successfully applied in several systems such as aluminum oxides, oxide films on stainless steel, and human skin [22, 23]. However, the use of a power-law model in a passive film on a pure metal with bounded resistivity values for the electrode / oxide film interface and oxide film / solution interface (namely 𝜌1 and 𝜌2, respectively) introduces a large number of parameters that are difficult to determine experimentally. In particular, the application of this model brings up the product 𝜌2 '34 ×𝛿, in which 𝛿 is the thin film thickness. Thus, it is not straight forward from this product to know the resistivity values or the film thickness independently. For this reason, we used here the integral expression for the power law model, which takes into account the high-frequency domain and allows to overcome that problem obtaining the film thickness from the high-frequency capacitance value. Finally, in order to
validate the thickness value obtained by EIS in the high-frequency domain, another spectroscopic technique, XPS, was used independently to estimate ex situ the passive film thickness of the Zr/ZrO2 samples. Furthermore, a specific attention has been devoted to the
interpretation of the CPE behavior observed experimentally in terms of effective capacitance using an appropriate representation of the EIS data.
2. Experimental
2.1 Materials
The samples consisted of a pure Zr grade 702 rod (provided by CEZUS; chemical composition and heat treatment are given in Table 1) that were machined to a cylindrical electrode 0.4 cm in radius. The lateral wall was insulated with Teflon, exposing a disk electrode of 0.5 cm2 surface area. The surface of the sample was
polished in four successive steps using P2000 and P4000 SiC abrasive papers, and then diamond paste (3 µm) and alumina paste (0.03 µm). The Zr was then rinsed and degreased in an ethanol bath and in an ultrasonic ethanol bath for 15 min. The native oxide layer (ZrO2) thickness was about 4 nm (vide infra), as is usually
observed in the literature. The ZrO2 film was electrochemically formed in nitric acid solution (4 M at 40 °C).
The ZrO2 film was grown by applying a constant potential to the sample (1.15 or 1.5 V/NHE), and varying the
treatment duration in order to vary its thickness (between 20 min and 2 hours). These experimental conditions were selected to obtained film thicknesses lower than 10 nm.
Table 1: chemical composition and heat treatment of Zr grade 702 (Heat treatment: 15 min at 1060 °C with cooling under argon atmosphere)
Zr + Hf (wt%) Hf (wt%) Fe + Cr (wt%) O (wt%) C (ppm) Cu (ppm) H (ppm) N (ppm) Ni (ppm) ≥ 99.2 ≤ 1.0 ≤ 0.1 ≤ 0.135 ≤ 58 ≤ 10 ≤ 25 ≤ 29 ≤ 18 2.2 Methods
All the experiments were performed in a 250 mL cell in a usual 3-electrode configuration. The working and the counter electrodes were a zirconium disk-electrode and a platinum basket, respectively. The reference was a mercury sulfate electrode (Hg-Hg2SO4 - MSE, E =
are given vs. NHE. The electrochemical device used for all the experiments was a VMP workstation (Biologic). The electrolytic solution was a 4 mol/L HNO3 solution prepared by
diluting R.P. NORMAPUR PROLABO 52.5% solutions with demineralized water.
2.3 Characterization
EIS was performed during the deposition procedure and at the end of the oxide growth procedure. Due to the fact that the phase shift shows a clear CPE behaviour in high frequency range, those experimental results were analyzed using the power law model [21,22], which allows the interpretation of EIS spectra and specially the oxide film characterization to be performed on a physical basis. XPS analyses were also performed on the Zr/ZrO2 samples
providing information about chemical composition and oxidation state of the element forming the outer layer (~ 10 nm analysis depth). XPS analyses were carried out with a Thermofisher Escalab 250 XI spectrometer using a monochromatic X-ray Al Kα source. The instrument was calibrated in energy with the silver Fermi-level (0 eV) and the 3d5/2 core level of metallic silver (368.3 eV). The C-1s signal was used to correct a possible charge effect: the C-C/C-H contribution of C-1s spectra was fixed at 285.0 eV. The analysis zone consisted in a 900 µm in diameter spot. The data processing was performed using the commercially available Avantage software, which allowed the estimation of the oxide layer thickness.
3. Results and discussion
3.1. Film formation and XPS characterization
The surface oxide thickness (δ) was estimated from the analysis of the XPS spectrum using the Zr 3d (Zr-3d5/2 = 183.2 eV and Zr-3d3/2 = 185.6 eV) to metal (Zr-3d5/2 = 179.2 eV and Zr-3d3/2 = 181.6 eV) peak ratio 789
7:;< according to the relationship described in equation 2.
𝛿 = 𝜆>?𝑐𝑜𝑠 𝜃 𝑙𝑛 FF:;< 89 G:;< G89 789 7:;<+ 1 (2)
where F:;<
F89 is the ratio of the volume densities of Zr atoms in metal to oxide, θ is the angle
between the normal of the sample surface and the analyzer (set at 0° in this work), and 𝜆H%I and 𝜆>? are the inelastic mean free paths (corresponding to the average distance of an electron between two inelastic collisions) in the metal and in the oxide, respectively. In Eq. 2, the major uncertainty lies in the determination of the mean free path values, which can be evaluated depending on the model from empirical correlations [24] or from ab initio calculations [25,26]. The different values of the mean free path used in this work are reported in Table 2 and correspond to 3 different models commonly used in the literature. Fig. 1 shows the XPS spectra obtained for 4 different pristine Zr/ZrO2 samples after the polishing
procedure (i.e. after an identical preparation procedure for the sample). The oxide to metal peak ratio was between 2.9 and 3 leading to native oxide film thickness of 4.20 ± 0.05 nm, 3.30 ± 0.05 nm, and 3.70 ± 0.05 nm for model 1 to 3, respectively. This shows the good reproducibility of the preparation procedure, but also reveals the small discrepancy in thickness due to the model used for the mean free path (δ = 3.7 ± 0.5 nm).
Similarly, XPS analysis were performed on different Zr/ZrO2 electrogenerated samples at
different potentials and for different durations of electrolysis (some XPS spectra are shown as examples in Fig. 2). The thicknesses of the films were then determined applying the different models and are compared in the following section to the thicknesses obtained by in situ EIS. It should be mentioned that in the literature, the combination of EIS and XPS has already been used for the estimation of film thickness, e.g. for Ni-based alloys [27], Ti alloys [28], or W [29]. From XPS measurements, these authors determined the thickness of the oxide film formed on the metal, which in turn was used for the simulation of EIS spectra.
Table 2: Zr-3d electron mean free path values in metallic Zr and ZrO2 calculated according to three
λmet (nm) λox (nm) SD–model in Ref. [24] 2.3 4.9 TPP–model in Ref. [25] 2.6 2.3 G–model in Ref. [26] 3.1 2.4
Figure 1: XPS Zr-3d core levels spectra obtained on 4 pristine Zr/ZrO2 samples after the polishing
Figure 2: Zr-3d core levels spectra obtained on a Zr/ZrO2 electrogenerated sample.
3.2. EIS characterization
EIS measurements on Zr/ZrO2 samples were performed during the electrochemical oxide
growth or at the end of the oxide growth. In both cases, the impedance diagrams obtained show a CPE behavior. Regressions were performed under the assumption that a resistivity distribution inside the oxide thin film of thickness 𝛿 follows the power-law model [21,22] as described in equation 3. We used this model for data analysis since it provided the best fits for
ZrO2oxide film. However, in the following, we will show that the thickness of the film can be
obtained without any assumption on the model used, which is the main point of this article. The resistivity was expressed as
𝝆 𝝃 = 𝝆𝜹 𝝆𝜹 𝝆𝟎N 𝟏3 𝝆𝜹 𝝆𝟎 𝝃𝜸 (3)
where the bounded values of the resistivity, 𝜌1 and 𝜌2, account for the resistivity of the metal / oxide and oxide / solution interfaces, respectively, 𝜉 =?2 is the dimensionless position (𝜉 = 0 at the metal / oxide interface), and 𝛾 is a constant characterizing how sharply the resistivity varies inside the film.
Under the assumption of a uniform dielectric constant, and neglecting the double layer capacitance (this assumption is usually valid because the capacitance associated to the thin film is smaller than the double layer capacitance), the impedance of the interface is given by the integral formula described in equation 4.
𝑍T 𝜔 = 𝛿 'N()WWU V
XU V
'
1 𝑑𝜉 (4)
For the frequency domain corresponding to 𝑓 < 𝑓2 with 𝑓2 =\]U'
^__X, a simplified analytic
expression of the impedance can be obtained as [9]: 𝑍T 𝜔 = 𝑔 2U^a/c
UXdaN()WWX cda /c
(5)
in which g is a parameter that depends on 𝛾 according to an interpolated formula shown in equation 6.
𝑔 = 1 + 2.88 𝛾3\.hij (6)
Interestingly, this expression of the impedance accounts for a CPE behavior (with 𝛼 =k3' k ) that is associated with an axial distribution of the time constants, and has already been used for the analysis of different systems [11]. However, as stated above, this formula is only valid in a restricted frequency domain. In addition, a close inspection of this formula indicates that 𝛿 and 𝜌2 cannot be determined independently, and complementary experiments using another
technique (such as XPS, which allows an independent evaluation of the film thickness) are required to access both of these values. In most cases, the use of the analytic expression in the literature is justified because it is easy to handle, and it avoids difficulties encountered for fitting experimental results with commercial software (usually provided with the potentiostat) using the integral expression (equation 4). However, as we describe here the integral expression allows all the parameters (film thickness and resistivities) to be extracted from one single set of experiments.
Equation 3 was obtained from a set of synthetic data that simulated a CPE behavior and which consisted in a finite number of Voigt elements in series [21]. Such an electrical equivalent circuit has two well-defined boundaries. In the low frequency range, the impedance tends towards a real value corresponding to the resistive path of the electrical circuit; whereas, the high-frequency limit is a pure capacitance. Interestingly, the capacitance obtained in the high frequency domain is independent of the model used for data analysis in order to describe the frequency dispersion (in this case we apply the power law model, but it would be also possible to use other models without affecting the accuracy in the film thickness determination). In other words, the bounded value for the capacitance should reflect the capacitive properties of the oxide film independently of the physical origin of its heterogeneous properties. The main difficulty is that these values are not always in the frequency domain accessible experimentally and usable in electrochemistry. As an example, simulations of EIS diagrams were performed with a high value for 𝜌1 (1016 Ωcm), a small value for 𝜌2 (102 Ωcm), and a film thickness of 100 nm (simulation is presented in Figure 3).
This simulation shows that the capacitance at high-frequency would be only measured for frequencies larger than 1 GHz, which is obviously not possible with a potentiostatic regulation of the interface. These results also show that the CPE domain is well described by
the analytical expression but this latter no longer holds in the high-frequency domain, which represents an evident limitation in the use of the analytical expression.
Figure 3: EIS data obtained for the integral relation and the analytical solution of the impedance in the case of a power law. The parameters are similar to those used in the calculations presented in
[21]: 𝜌1 =1016Ωcm, 𝜌
2 = 102Ωcm, 𝛾 = 20, 𝜀 = 10, and a film thickness of 100 nm.
When the simulations are performed for 𝜌1 = 1016 Ωcm, a small value for 𝜌2 = 106 Ωcm, and a film thickness of 100 nm (Fig. 4), that is with values for the resistivity that are in the range of those usually encountered for a passive film, and of the same order of magnitude of the
native film formed on the Zr electrode, the shape of the simulated curves remain similar to those observed in Fig. 3. However, the transition frequency from the CPE behavior to a pure capacitance is now at about 50 to 100 kHz, which is in a frequency domain that can be investigated experimentally. This result demonstrates the feasibility of the integral formula (equation 4) to provide the high-frequency capacitance for conventional passive oxide films, which is necessary to obtain the film thickness. Interestingly, this transition frequency is independent of the oxide film thickness and only depends on the physical properties of the layer.
Figure 4: EIS data obtained for the integral relation and the analytical solution of the impedance in the case of a power law. 𝜌1 =1016Ωcm, 𝜌
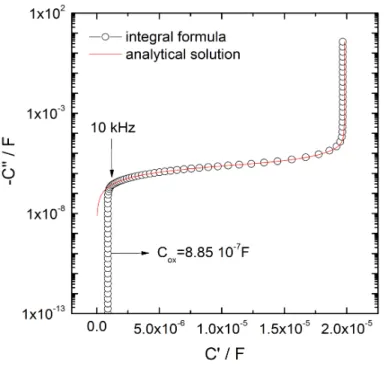
In a previous paper [30], Orazem et al. emphasized the importance of the representation of impedance data. In the case of a CPE behavior that is for a pseudo-capacitance, the Cole-Cole representation can outline the main characteristic of the system [31,32]. Fig. 5 shows the capacitance plots corresponding to the data presented in Fig. 4, and was obtained using the following transformation of the impedance spectrum (corrected from the electrolyte resistance, 𝑅%) in a capacitance spectrum
𝐶 𝜔 = () o ) 3p'
; (7)
This figure shows that the use of the integral formula (equation 4) allows the high frequency capacitance to be determined for a frequency larger than 25 kHz leading to a capacitance value 𝐶q = 8.85 103i F. Thus, assuming a permittivity 𝜀 = 10, the thickness of the oxide layer can be easily obtained using equation 8.
𝛿 =WWX
tu (8)
leading to 𝛿 = 100 nm (i.e. the initial value of the oxide film used for the simulation). As a result, we conclude that is possible to extract from the impedance diagram the oxide film thickness and the resistivity parameter accounting for the distribution of the time constant inside the film.
Figure 5: Cole-Cole plots corresponding to EIS spectra presented in Fig. 4. 𝜌1 =1016Ωcm, 𝜌
2 = 106
Ωcm, 𝛾 = 7, 𝜀 = 10, and a film thickness of 100 nm.
Figure 6: Cole-Cole plots in linear (a) and semi-log (b) coordinates corresponding to EIS spectra for values obtained for synthetic data with the following parameters: 𝜌1 =1010Ωcm, 𝜌
2 = 107Ωcm, 𝛾 =
Fig. 6 shows synthetic data for the capacitive plot calculated with mean values obtained experimentally on a ZrO2 oxide film. The thickness of the film was 7 nm, the power law
parameters obtained from the model fitting were 𝜌1 =1010 Ωcm, 𝜌2 = 107 Ωcm, and 𝛾 = 5, and the permittivity 𝜀 = 22. The analysis of the curve obtained from the calculation of the integral formula (Equation 4, circle symbols) indicates that it is possible to explore the high frequency domain of the capacitive plot in order to get an accurate value of the thickness of the oxide film, which is obviously not possible if the analytical expression is used (Equation 5, plain curve). Indeed, the extrapolation to the HF of the analytical expression gives a zero value for the capacitance, which is obviously not correct.
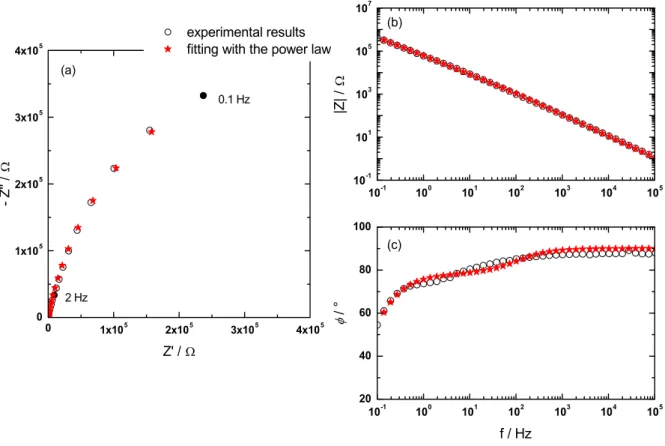
Figures 7 shows the experimental results obtained on an electrogenerated ZrO2 thin layer and
the fitting using the integral formula (Equation 4) for the power law in Nyquist and Bode representation, respectively. A good agreement was obtained over the entire frequency range. From this analysis, the power law model allows a satisfactory explanation of the time-constant distribution through the zirconium oxide film thickness.
Figure 7: Nyquist plot (a) and Bode plots (b & c) obtained on an electrogenerated ZrO2 thin layer (2
hours at 1.15 V/NHE in 4 mol/L HNO3 solution at 40°C). Experimental results and fit with the power
law (integral formula, Equation 4)
In addition, Figure 8 shows the capacitive plot obtained with the fitted value of the EIS data presented in Fig. 7. The high-frequency capacitance value obtained (2.8 10-6 F cm-2) there
allows determining a ZrO2 film thickness of 6.9 nm. Interestingly, the comparison value
obtained by XPS measurement on the same sample was 7.5 nm. It should also be mentioned that assuming a double layer capacitance of 30 10-6 F cm-2 (in series with the capacitance of the oxide film), an oxide film thickness of 6.4 nm could be determined. Neglecting the double layer capacitance results in an error between 5 to 10 % in the oxide film thickness determination, but no direct measurement allows the deconvolving of the two capacitances. The same uncertainty was obtained from XPS analysis as previously described.
Figure 8: Cole-Cole plots corresponding to EIS spectra (same experimental values obtained on ZrO2
thin layer grown 2 hours at 1.15 V/NHE in 4 mol/L HNO3 solution at 40°C presented in Fig. 7).
Fig. 9 shows the comparison of the film thickness obtained from EIS measurements (equation 7) using the high-frequency capacitance value reached by solving the integral formula (equation 4) for the power law model and from XPS analysis using 3 different theoretical models (SD, G and TPP). Interestingly, even if a small discrepancy can be noticed, specially when the SD model is used for the XPS analysis, we can conclude that XPS and EIS allow a precise determination of the passive oxide layer thickness. Furthermore, from the Cole-Cole representation of EIS results, it has been demonstrated that it possible to determine the thickness of the oxide layer (without any assumption on the model to account for resistivity distribution), and in a second step, by fitting the EIS data with the power law model the resistivity distribution in the passive film interfaces can be also obtained.
Figure 9: Comparison of the film thickness measurement by EIS and XPS (3 different models) of 4 different electrogenerated ZrO2 oxide films (growth conditions: 20 min to 2 hours at 1.15 V/NHE in 4
mol/L HNO3 solution at 40°C).
4. Conclusions
The analysis presented in this work was based on the use of the power law model and a graphical representation in order to describe the non-ideal behavior of a capacitive system. This allows extraction, in one single EIS experiment, of values for the film thickness, the resistivity profile in the oxide layer, and, in particular, the resistivity values at the electrode/film and the film/electrolyte interfaces. The high frequency domain of the EIS data leads to the determination of a pure capacitance independently of the model used. This provides a unique way for an in situ determination of thin film thickness so long as the time constant is in the frequency domain that can be investigated experimentally. This work
suggests a graphical method to extract film properties and serves to validate a key assumption of the power-law model for interpretation of CPE parameters in terms of physical properties. Finally, the thickness values obtained by EIS in the high-frequency domain were validated by another spectroscopic technique, XPS. This technique is usually employed for analyzing the chemical composition at the oxide surface [33], but using the proper theoretical method can be also successfully employed for measuring the passive film thickness of the same model system (Zr/ZrO2) studied here.
References
1. H. Frey, H.R. Khan (Eds.), Handbook of Thin-Film Technology, Springer-Verlag, Berlin, 2015.
2. N. Sato, K. Kudo, Ellipsometry of the passivation film on iron in neutral solution, Electrochim. Acta 16 (1971) 447.
3. X. Shan, D. Ren, P. Scholl, G. Prentice, Coulometric and ellipsometric measurements of passive film thickness on zinc electrodes in KOH solution, J. Electrochem. Soc. 136 (1989) 3594.
4. T. Kaneko, N. Akao, N. Hara, K. Sugimoto, In situ ellipsometry analysis on formation of Al2O3-Ta2O5 films
in ion beam sputter deposition, J. Electrochem. Soc. 152 (2005) B133.
5. S. Hüfner, Photoelectron Spectroscopy: Principles and Applications, 3rd ed., Springer-Verlag, Berlin, 2010.
6. M.R. Alexander, G.E. Thompson, X. Zhou, G. Beamson, N. Fairley, Quantification of oxide film thickness at the surface of aluminum using XPS, Surf. Interface Anal. 34 (2002) 485.
7. S. Cattarin, N. Comisso, M. Musiani, B. Tribollet, Electrodes coated by passive oxide films with a thickness profile: modeling and measurement of the impedance response, J. Electrochem. Soc. 155 (2008) C543.
8. S. Cattarin, M. Musiani, B. Tribollet, V. Vivier, Impedance of passive oxide films with graded thickness: influence of the electrode and cell geometry, Electrochim. Acta 54 (2009) 6963.
9. B. Tribollet, M.E. Orazem, Electrochemical impedance spectroscopy, 2008, Hoboken, John Wiley & Sons.
10. G. Galicia, N. Pébère, B. Tribollet, V. Vivier, Local and global electrochemical impedances applied to the corrosion behaviour of an AZ91 magnesium alloy, Corros. Sci., 51 (2009) 1789-1794
11. B. Hirschorn, M. E. Orazem, B. Tribollet, V. Vivier, I. Frateur, M. Musiani, Determination of effective capacitance and film thickness from constant-phase-element parameter, Electrochim. Acta, 55 (2010) 6218-6227.
12. G.J. Brug, A.L.G. van den Eeden, M. Sluyters-Rehbach, J.H. Sluyters, The analysis of electrode impedances complicated by the presence of a constant phase element, J. Electroanal. Chem. 176 (1984) 275-295.
13. C.H. Hsu, F. Mansfeld, Concerning the conversion of the constant phase element parameter Y-0 into a capacitance, Corrosion 57 (2001) 747-748.
14. S.P. Harrington, T.M. Devine, Analysis of Electrodes Displaying Frequency Dispersion in Mott-Schottky Tests, J. Electrochem. Soc. 155 (2008) C381-C386.
15. S. Cruz-Manzo, R. Chen, P. Greenwood, An impedance model for analysis of EIS of polymer electrolyte fuel cells under hydrogen peroxide formation in the cathode, J. Electroanal. Chem. 745 (2015) 28-36.
16. R. Jurczakowski, C. Hitz, A. Lasia, Impedance of porous Au based electrodes, J. Electroanal. Chem. 572 (2004) 355-366.
17. V.D. Jovic, B.M. Jovic, EIS and differential capacitance measurements onto single crystal faces in different solutions Part I: Ag(111) in 0.01 M NaCl, J. Electroanal. Chem. 541 (2003) 1-11.
18. V.D. Jovic, B.M. Jovic, EIS and differential capacitance measurements onto single crystal faces in different solutions Part II: Cu(111) and Cu(100) in 0.1 M NaOH, J. Electroanal. Chem. 541 (2003) 13-21.
20. J.-B. Jorcin, M.E. Orazem, N. Pébère, B. Tribollet, CPE analysis by local electrochemical impedance spectroscopy, Electrochim. Acta 51 (2006) 1473-1479.
21. B. Hirschorn, M.E. Orazem, B. Tribollet, V. Vivier, I. Frateur, M. Musiani, Constant-Phase-Element behavior caused by resistivity distributions in films. I. Theory, J. Electrochem. Soc. 157 (2010) C452-457.
22. B. Hirschorn, M.E. Orazem, B. Tribollet, V. Vivier, I. Frateur, M. Musiani, Constant-Phase-Element behavior caused by resistivity distributions in films. II. Application, J. Electrochem. Soc. 157 (2010) C458-463.
23. M.E. Orazem, I. Frateur, B. Tribollet, V. Vivier, S. Marcelin, N. Pébère, A.L. Bunge, E.A. White, D.P. Riemer, M. Musiani, Dielectric properties for materials showing constant-phase-element (CPE) impedance response, J. Electrochem. Soc., 160 (2013) C215-C225.
24. M.P. Seah and W.A. Dench, Quantitative electron spectroscopy of surfaces: A standard data base for electron inelastic mean free paths in solids, Surf. Interface Anal. 1 (1979) 2-11.
25. S. Tanuma, C.J. Powell, D.R. Penn, Calculations of electron inelastic mean free paths. V. Data for 14 organic compounds over the 50-2000 eV range, Surf. Interface Anal. 21 (1993) 165-176.
26. W.H Gries, A universal predictive equation for the inelastic mean free pathlengths of X-ray photoelectrons and Auger electrons, Surf. Interface Anal. 24 (1996) 38-50.
27. M. Bojinov, A. Galtayries, P. Kinnunen, A. Machet, P. Marcus, Estimation of the parameters of oxide film growth on nickel-based alloys in high-temperature water electrolytes, Electrochim. Acta, 52 (2007) 7475-7483.
28. M. Bojinov, M. Stancheva, Coupling between dissolution and passivation revisited - Kinetic parameters of anodic oxidation of titanium alloys in a fluoride-containing electrolyte, J. Electroanal. Chem. 737 (2015) 150-161.
29. I. Betova, M. Bojinov,V. Karastoyanov, P. Kinnunen, T. Saario, Estimation of kinetic and transport parameters by quantitative evaluation of EIS and XPS data, Electrochim. Acta, 55 (2010) 6163-6173.
30. M.E. Orazem, N. Pébère, B. Tribollet, Enhanced Graphical Representation of Electrochemical Impedance Data, J. Electrochem. Soc. 153 (2006) B129-136.
31. A.K. Jonscher, Admittance Spectroscopy of Systems Showing Low-Frequency Dispersion, Electrochim. Acta, 35 (1990) 1595-1600.
32. A.K. Jonscher, Dielectric characterisation of semiconductors, Solid-State Electronics, 33 (1990) 737-742. 33. L.-A. Näslund, C.M. Sánchez-Sánchez, A.S. Ingason, J. Bäckström, E. Herrero, J. Rosen, S. Holmin, The role of TiO2 on RuO2-coated electrodes for the water oxidation reaction, J. Phys. Chem. C 117 (2013) 6126-6135.
Table 1: chemical composition and heat treatment of Zr grade 702 (Heat treatment: 15 min at 1060 °C with cooling under argon atmosphere)
Zr + Hf (wt%) Hf (wt%) Fe + Cr (wt%) O (wt%) C (ppm) Cu (ppm) H (ppm) N (ppm) Ni (ppm) ≥ 99.2 ≤ 1.0 ≤ 0.1 ≤ 0.135 ≤ 58 ≤ 10 ≤ 25 ≤ 29 ≤ 18
Table 2: Zr-3d electron mean free path values in metallic Zr and ZrO2 calculated according to three
different models. λmet (nm) λox (nm) SD–model in Ref. [24] 2.3 4.9 TPP–model in Ref. [25] 2.6 2.3 G–model in Ref. [26] 3.1 2.4
Figure 1: XPS Zr-3d core levels spectra obtained on 4 pristine Zr/ZrO2 samples after the polishing
Figure 3: EIS data obtained for the integral relation and the analytical solution of the impedance in the case of a power law. The parameters are similar to those used in the calculations presented in
[21]: 𝜌" =1016Ωcm, 𝜌
Figure 4: EIS data obtained for the integral relation and the analytical solution of the impedance in the case of a power law. 𝜌" =1016 Ωcm, 𝜌# = 106 Ωcm, 𝛾 = 7, 𝜀 = 10, and a film thickness of 100 nm.
Figure 5: Cole-Cole plots corresponding to EIS spectra presented in Fig. 4. 𝜌" =1016Ωcm, 𝜌
# = 106
Figure 6: Cole-Cole plots in linear (a) and semi-log (b) coordinates corresponding to EIS spectra for values obtained for synthetic data with the following parameters: 𝜌" =1010Ωcm, 𝜌
# = 107Ωcm, 𝛾 =
Figure 7: Nyquist plot (a) and Bode plots (b & c) obtained on an electrogenerated ZrO2 thin layer (2
hours at 1.15 V/NHE in 4 mol/L HNO3 solution at 40°C). Experimental results and fit with the power
Figure 8: Cole-Cole plots corresponding to EIS spectra (same experimental values obtained on ZrO2
Figure 9: Comparison of the film thickness measurement by EIS and XPS (3 different models) of 4 different electrogenerated ZrO2 oxide films (growth conditions: 20 min to 2 hours at 1.15 V/NHE in 4
mol/L HNO3 solution at 40°C).