HAL Id: tel-01477617
https://tel.archives-ouvertes.fr/tel-01477617
Submitted on 27 Feb 2017HAL is a multi-disciplinary open access archive for the deposit and dissemination of sci-entific research documents, whether they are pub-lished or not. The documents may come from teaching and research institutions in France or abroad, or from public or private research centers.
L’archive ouverte pluridisciplinaire HAL, est destinée au dépôt et à la diffusion de documents scientifiques de niveau recherche, publiés ou non, émanant des établissements d’enseignement et de recherche français ou étrangers, des laboratoires publics ou privés.
Galaxy and Search for their Sources
Gwenael Giacinti
To cite this version:
Gwenael Giacinti. Propagation of Ultrahigh Energy Cosmic Rays in the Galaxy and Search for their Sources. High Energy Astrophysical Phenomena [astro-ph.HE]. Universite Paris Diderot-Paris VII, 2011. English. �tel-01477617�
DE L’
UNIVERSIT´
E PARIS. DIDEROT (Paris 7)
pour obtenir le grade de
DOCTEUR DE L’UNIVERSIT´
E PARIS. DIDEROT (Paris 7)
Mention Champs, Particules, Mati`eres
Pr´esent´ee par
Gwenael GIACINTI
ECOLE DOCTORALE: ED517 - ”Particules, Noyaux et Cosmos” Sous la direction de Professeur DMITRI SEMIKOZ
PROPAGATION OF ULTRAHIGH ENERGY
COSMIC RAYS IN THE GALAXY AND
SEARCH FOR THEIR SOURCES
Th`ese soutenue le 28 Juin 2011 devant le jury compos´e de: Pr´esident:
´
Etienne PARIZOT Professeur `a l’Universit´e Paris Diderot (Paris 7) Rapporteurs:
Francesco MINIATI Senior Staff `a l’ETH Z¨urich
Peter TINYAKOV Professeur `a l’Universit´e Libre de Bruxelles Examinateurs:
Martin LEMOINE Directeur de Recherches `a l’Institut d’Astrophysique de Paris Guy PELLETIER Professeur ´Em´erite `a l’Universit´e de Grenoble 1
Contents . . . . 3
1. Cosmic Rays at Ultra-High Energies . . . . 7
1.1 Introduction to cosmic rays . . . 9
1.2 Extensive air showers and hadronic interactions . . . 13
1.3 Measurements: techniques and experiments . . . 20
1.4 UHECR spectrum and cutoff . . . 24
1.4.1 Photon backgrounds, pair and pion production . . . 24
1.4.2 Measured spectrum and implications . . . 28
1.5 Theoretical models and composition . . . 30
1.5.1 Detection of the ankle . . . 30
1.5.2 Extragalactic UHECR protons model and HiRes/TA measure-ments . . . 30
1.5.3 Mixed composition model . . . 32
1.5.4 Auger 2009 results . . . 35
1.6 Source candidates and acceleration mechanisms . . . 38
1.7 Ultra-high energy cosmic rays in the light of a multimessenger study . 41 2. Ultra-High Energy Cosmic Rays: Propagation and search for the sources . 45 2.1 Cosmic magnetic fields and UHECR arrival directions . . . 47
2.1.1 Cosmic ray deflections . . . 47
2.1.2 Measurements of cosmic magnetic fields . . . 47
2.1.3 Extragalactic magnetic fields . . . 50
2.1.4 Galactic magnetic field: Observations and modeling . . . 55
2.2 Anisotropies in arrival directions and search for the sources . . . 59
2.2.1 Search for point sources . . . 59
2.2.2 Search for extended sources and global anisotropy . . . 63
3. Search for Ultra-High Energy Proton or Light Nuclei Sources . . . . 67
3.1 Introduction . . . 69
3.2 Simulation of the signal from a single source on top of background . . 70
3.2.2 Background . . . 74
3.3 Method to find the source on top of background . . . 75
3.3.1 Source detection and background rejection . . . 75
3.3.2 Optimization of the parameters of the method . . . 79
3.3.3 Reconstruction of the source position . . . 82
3.4 Results . . . 82
3.4.1 Detection of the source: dependence on parameters . . . 82
3.4.2 Reconstruction of the source position and of the regular GMF deflection power . . . 87
3.5 Conclusions of the chapter . . . 88
4. Search for Ultrahigh Energy Heavy Nuclei Sources . . . . 91
4.1 Introduction . . . 93
4.2 Method to search for heavy nuclei sources . . . 94
4.3 Application to the data of the Pierre Auger Observatory: Virgo as a heavy nuclei source ? . . . 98
4.4 Cross-check with a “blind-like” analysis . . . 104
4.5 Discussion . . . 107
4.6 Conclusions and Perspectives . . . 112
5. Propagation of Ultrahigh Energy Nuclei in the Galactic Magnetic Field . . 115
5.1 Introduction . . . 117
5.2 Models of the regular Galactic Magnetic Field . . . 118
5.2.1 Models . . . 118
5.2.2 Extragalactic magnetic fields . . . 124
5.3 Modelling of the turbulent Galactic magnetic field . . . 125
5.3.1 Models . . . 125
5.3.2 Plots of the field . . . 126
5.3.3 Tests of rms deflections in the turbulent field . . . 128
5.3.4 Impact of the field configuration and of the number of back-traced particles . . . 132
5.3.5 Summary of the tests . . . 133
5.4 Backtracing heavy nuclei in the Galactic magnetic field . . . 135
5.4.1 In the regular GMF only . . . 135
5.4.2 In the turbulent GMF . . . 139
5.5 (De-) magnification of source fluxes and blind regions . . . 141
5.5.1 Impact of the regular Galactic magnetic field component . . . 141
5.5.2 Impact of the turbulent component . . . 148
5.6 Images of astrophysical sources of heavy nuclei . . . 150
5.6.2 Qualitative consequences of deflections in the turbulent GMF
for source searches . . . 156
5.6.3 Can all UHECR measured at Earth come from a sole nearby extragalactic source ? . . . 161
5.7 Conclusions and Perspectives . . . 164
6. Summary . . . 167
Summary:
In this chapter, we present a brief and up-to-date overview of the field of Ultra-High Energy Cosmic Rays (UHECR).
After discussing the composition and probable origins of cosmic rays at all energies, we focus on the ultra-high energies (E > 1018eV). The detection techniques, hadronic
interaction models and the experiments dedicated to their detection are presented. The detection by HiRes experiment of the cutoff in the spectrum at E > (4− 6)× 1019eV, and its confirmation by Auger, is presently the main and most recent
milestone in the field.
The photon limits together with the measurements of the depth of shower maxi-mum prove the hadronic composition of UHECR. The exact composition of the flux at the highest energies is however a controversial topic. Auger, the experiment which currently has the largest exposure, claimed in 2009 that there is a shift from a light composition (a priori protons) to heavier nuclei at the highest energies, above 1019eV.
This result is contradicted by HiRes that claims its results are compatible with a pro-ton composition at the very highest energies. We discuss how one could theoretically account separately for each possibility.
We review the main acceleration mechanisms which have been formulated and the candidate astrophysical sources which are potentially able to accelerate particles to such extreme energies.
We finally show how one could study UHECR within a multi-messenger approach, using neutrinos and gamma rays.
1.1 Introduction to cosmic rays
The Earth is constantly hit by extraterrestrial energetic particles, called cosmic rays. These primary particles enter the Earth upper atmosphere and interact with oxygen and nitrogen nuclei of the air molecules. Each interaction leads to a cascade of secondary particles. Such cascades are known as air showers. The primary cosmic ray flux mostly consists of charged hadronic particles, such as protons, light and heavy nuclei. A smaller fraction of the flux is composed of electrons and gamma rays.
The existence of such energetic radiation was found at the beginning of the twen-tieth century. Its extraterrestrial origin was proved in 1912 by Victor Hess. In 1938, Pierre Auger and Roland Maze discovered coincidences in terms of particle arrival times between two distant detectors, proving they had a common origin. The exis-tence of air showers had been found. The developments in the field led to the discovery of new particles created in air showers, such as muons, pions and positrons. The first primary cosmic ray entering our atmosphere with E >∼ 1019eV was measured in 1962
by John Linsley. It proved that cosmic rays have a wide range of energies, and can even reach nearly macroscopic energies (ultra-high energies).
Nowadays, the exact composition and the sources of cosmic rays are still open questions, especially at very and ultra high energies.
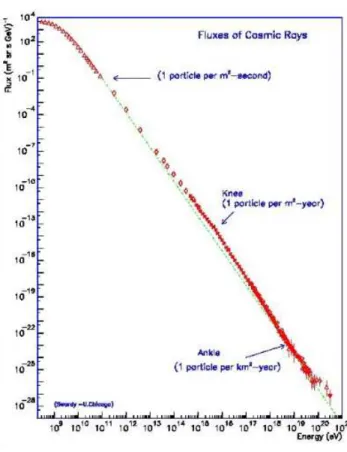
The flux of cosmic rays is shown in Figure 1.1. It drops with increasing energies and nearly follows a power law on about ten orders of magnitude in energies. Small breaks in the slope, such as the knee and the ankle can be seen. Depending on the energy range, the power law can be written as 1/Eα with α ≃ 2.7 to 3.3.
Cosmic rays below a few GeV are dominated by the Sun and are influenced by its wind. Cosmic rays of larger energies originate outside our Solar system. Up to the knee (E ≃ 3 × 10¹⁵eV), cosmic rays are believed to have a Galactic origin. At
the very highest energies (E >∼ 1019eV) they should have an extragalactic origin. At
such energies, they cannot be confined in our Galaxy because their Larmor radius RL is larger than the Galactic disk width. For a particle of momentum p, charge Ze,
gyrating in a magnetic field of strength B, RL= p ZeB ≃ 5.4 kpc 2 µG B E Z × 1019 eV . (1-1)
B ≃ 2 µG is the order of magnitude of the large scale Galactic magnetic field strength at Earth. For such a field, the Larmor radius of 1019eV protons is larger than the
thickness of the Galactic disk: RL∼ 5.4 kpc.
The energy at which the transition between Galactic and extragalactic cosmic rays occurs is still unknown and is a topic of ongoing research.
At low energies E <∼ 100 TeV, the cosmic ray (CR) flux is large enough to be detected directly by space experiments such as AMS, or balloon-borne experiments
Fig. 1.1: Flux of cosmic rays as a function of their energy, in the range E ∼ 108− 1021eV. The green dashed line represents a 1/E2.7 spectrum. Figure from S. Swordy, University of Chicago, according to Ref. [1].
Energy (eV/particle) 13 10 1014 15 10 1016 1017 18 10 1019 1020 1021 ) 1.5 eV -1 sr -1 s -2 J(E) (m 2.5 Scaled flux E 13 10 14 10 15 10 16 10 17 10 18 10 19 10 (GeV) pp s Equivalent c.m. energy 2 10 103 104 105 106 RHIC (p-p) -p) γ HERA (
Tevatron (p-p) 7 TeV14 TeV LHC (p-p) ATIC PROTON RUNJOB KASCADE (QGSJET 01) KASCADE (SIBYLL 2.1) KASCADE-Grande 2009 Tibet ASg (SIBYLL 2.1)
HiRes-MIA HiRes I HiRes II Auger 2009
Fig. 1.2: Cosmic ray spectrum multiplied by E2.5, from Ref. [2]. Three breaks in its slope (knee, ankle, cutoff) are easier to see. The upper energy scale corresponds to the equivalent center of mass energy √spp for p-p collisions in man-made particle accelerators. The LHC is the first accelerator to be able to probe energies above the knee. The first 7 TeV data have been recently recorded.
such ATIC and RUNJOB experiments. At energies above∼ 100 TeV, CR can produce air showers which can be detected by experiments in mountains such as TIBET experiment. At larger energies, air showers can be measured at lower altitudes.
Figure 1.2 shows the CR flux at energies E ≥ 1012eV, and multiplied by E2.5. It is
made of a compilation of all recent experimental data of leading experiments. One can see three or four breaks in the slope. The knee at E ∼ 3×10¹⁵eV (α≃ 2.7 → α ≃ 3.0),
the second knee -not clearly- at E ∼ 5 × 10¹⁷eV (α ≃ 3.0 → α ≃ 3.3), the ankle at
E ∼ 3 × 10¹⁸eV (α≃ 3.3 → α ≃ 2.7), and the cutoff above ∼ (4 − 6) × 1019eV.
In case cosmic rays at the highest energies are protons accelerated up to maximum energies Emax> 1020eV, the cutoff above∼ (4 − 6) × 1019eV corresponds to the GZK
cutoff. The GZK cutoff is the result of energy losses suffered by UHECR producing pions on CMB photons above E ∼ 4 × 10¹⁹eV = 40 EeV, see Section 1.4. The other
breaks may be linked with for example changes of composition, of accelerators or the Galactic-extragalactic origin transition. The knee may correspond to the high-est energy to which Galactic sources can accelerate protons. The ankle may either be the signature of the Galactic-extragalactic origin transition or the consequence of extragalactic UHE proton energy losses by photoproduction of e± pairs. Cosmic rays
Fig. 1.3: Overall cosmic ray flux and contributions of different nuclei multiplied by E2.5 as measured by KASCADE and KASCADE-Grande experiments. Superimposed figures from KASCADE and KASCADE-Grande experiments, taken from Ref. [3]. The black dots represent the total CR flux. The red, yellow, green and blue symbols represent the contribution of primaries with different masses to the total flux. The primary mass increases from protons to heavy nuclei in the following order: red, yellow, green and blue.
(CR) below the knee are believed to be protons accelerated in Galactic supernovae remnants at shock fronts. Beyond the ankle, the CR flux should be dominated by extragalactic sources because CR cannot be confined in the Galaxy. Their Larmor radius is larger than the width of the Galactic disk. The composition above the ankle will be discussed in Section 1.5. The region between the knee and the ankle may either be dominated by protons from extragalactic sources or heavier nuclei accelerated in Galactic supernovae remnants. Due to their higher charge, nuclei can in principle be accelerated to Z times higher energies than protons in the same astrophysical sites. The KASCADE and KASCADE-Grande experiments (have) respectively explore(d) the energy ranges E = 1015 − 1017eV and E = 1016 − 1018eV. They both claim
that the composition tends to become gradually heavier in this energy range. If the knee corresponds to the maximum energy for Galactic protons, one should see the successive cutoffs of Galactic He, C, N, O, Si and Fe elements in this energy range. Figure 1.3 presents with black dots the total cosmic ray flux as measured by KAS-CADE and KASKAS-CADE-Grande experiments in the energy range E = 1015− 1018eV.
The red, yellow, green and blue symbols represent the contribution of primaries with different masses to the total flux. The primary mass increases from protons to heavy nuclei in the following order: red, yellow, green and blue. The flux is dominated at low energies E ∼ 1015eV by light elements. Its primary composition becomes
grad-ually dominated by more and more heavy nuclei. It is dominated by heavy nuclei (most probably iron) around E ∼ 1017eV. These successive cutoffs may be
inter-preted as the detection of the respective rigidity-dependent knees of proton, helium, CNO and Fe elements. KASCADE-Grande experiment also gives some indications of a lightening of the composition for E → 1018eV. This is in line with the composition
measurements of experiments at larger energies, see for instance Fig. 1.17 (left panel).
1.2 Extensive air showers and hadronic interactions
Let us now focus on the Ultra-High Energies (UHE) E >∼ 1018eV for the rest of
this thesis. Ultra-High Energy Cosmic Rays (UHECR) produce large air showers when they enter the upper part of our atmosphere and interact with the oxygen or nitrogen nuclei of air molecules. The total depth of the atmosphere at sea level is ≃ 1.0 × 10³g.cm−2 along a vertical axis. The first interaction takes place at depths
≃ 60 − 80 g.cm−2, which typically corresponds to altitudes ≃ 20 − 40 kilometers.
Figure 1.4 presents a simplified sketch of the development of an air shower trig-gered by an UHECR. After the first hadronic interaction with an oxygen or nitrogen nucleus of a molecule, hadrons and mesons are produced. They consist of protons, neutrons, light nuclei and both neutral and charged pions and kaons. For simplicity, we will not discuss here channels involving kaons. Along the axis of the shower de-fined by the direction of the primary CR, the produced energetic hadrons and mesons continue to interact with other O and N nuclei of air molecules up to the ground. It is the hadronic component of the shower. Its typical lateral extension when reaching the ground is only a few tens of meters. It just contains a few percent of the total shower energy, but fuels the two other shower components which are described below. Charged pions π± decay into (anti-) muons µ−, µ+ and muon (anti-) neutrinos ν.
Muons that are enough energetic can reach the ground. They represent the muonic component of the shower, which contains ∼ 10% of the shower energy. The (anti-) muons that are not enough energetic decay and produce electrons e− or positrons
e+. Neutral pions π0 decay in two gammas γ. Gammas produce electron-positron
pairs, which produce again gammas through bremstrahlung until the average energy of electron-positron pairs reaches ≃ 81 MeV. At this energy, the rate of energy loss due to collisions and ionization starts to exceed that due to radiation. This third component is the electromagnetic one and carries most of the energy of the shower -about∼ 90%. Contrary to the hadronic component, the muonic and electromagnetic (EM) ones extend up to several kilometers from the shower axis at the ground level. During the first stage of the shower development, the number of particles increases. It reaches a maximum of ∼ 1010−11 low energy particles of ∼ 100 MeV. For a primary
Primary Cosmic Ray n,p, ...π n,p, ...π γ γ γ e e e π γ e e e γ γ e e e e e e γ γ γ hadrons π γ ν µ ν µ o + + + + + + + + − π− − − − − − − Hadronic Ground level O, N nuclei of air molecules π ν e ν ν µ Muonic
component component Electromagnetic component
Fig. 1.4: Simplified sketch showing the development in the atmosphere of an extensive air shower triggered by an UHECR. It consists of three components: the muonic, hadronic and electromagnetic ones.
produced. Once the average energy of e± pairs has reached≃ 81 MeV, the number of
particles in the shower starts to decrease due to energy losses. The point at which the number of shower particles is the largest is an important parameter. It is measured as the depth of atmosphere Xmax at which the shower maximum happens. For protons
or nuclei of Ultra-High Energies, one expects Xmax ∼ 700 − 800 g.cm−2.
Both the mean value of the depth of shower maximum Xmax and its fluctuations
from a shower to another depend on the primary composition. For primary nuclei with mass A, every shower is equivalent to averaging A proton showers with energies E/A. Fluctuations for showers initiated by iron nuclei of energy E are smaller than for protons of energy E. The particle ratios in the shower also depend on the pri-mary composition. Therefore, numeric simulations of the shower development in the atmosphere and their confrontation with experimental measurements can enable one to deduce the primary cosmic ray nature (proton, light or heavy nuclei).
Figure 1.5 presents the results of an air shower simulation. Muon trajectories are in blue, gamma ray ones in green, and electron/positron ones in red. One can see that most particles stay along the central axis, within a few kilometers.
The exact structure of air showers strongly depends on particle interaction models. The main uncertainties come from the first hadronic interactions at very and ultra-high energies. Quantum chromodynamics (QCD) has been proved to be an excellent theory to describe the strong interaction, i.e. the quark-gluon interactions. However, further investigations on hadronic matter can be complicated. It is not possible to derive directly the cross-sections of hadron-hadron interactions. To study them, one needs phenomenological modellings of such interactions. At low energies, models can be confronted with and tuned to the particle accelerators data, but the energies involved with UHECR are still far larger than those reached by accelerator data. As shown in Figure 1.2, the energies involved in the Fermilab proton-proton data are still 300 times lower than those of the highest energy cosmic rays. The 14 TeV LHC data explores energies ≃ 10 times larger than those at Fermilab. As pointed out in Figure 1.5, the shower mostly develops along its central axis. This implies that one is interested in processes with low transverse momentum, diffractive processes. The particle production is dominated by forward and soft QCD interactions. These interactions are usually modelled with Pomeron (a Regge trajectory) exchanges. The Pomeron is an hypothetical composite particle, which has still not been detected and which nature is not clear. It may for instance be two gluons in a color-singlet state or a gluon ladder.
A present compilation of accelerator data for proton-pron and proton-antiproton cross sections, and their extrapolations to the highest energies are shown in Figure 1.6 (left panel). The black dots represent the experimental measures of the cross sections. The two highest energy dots are measurements from Fermilab. These two measures are unfortunately inconsistent with each other, which complicates the extrapolation
Fig. 1.5: Simulation of an extensive air shower. Muon trajectories are in blue, gamma ray ones in green, and electron/positron ones in red. Figure taken from Ref. [4].
(Energy/eV)
10
log
0.5 1 1.5 2 2.5 3 3.5 4 4.5 5 5.5
Total Cross Section [mb]
0 50 100 150 200 250 [GeV] s 10 102 3 10 104 5 10 Donnachie−Landshoff Landshoff 2007 Pancheri 2007 LHC (pp) accelerators tot σ ) accelerators p (p tot σ (Energy/eV) 10 log 13 14 15 16 17 18 19 20
Cross section (proton−air) [mb]
200 300 400 500 600 700 800 QGSJET01c EPOS 1.61 SIBYLL 2.1 QGSJETII.3 Energy [eV] 13 10 14 10 15 10 16 10 17 10 18 10 19 10 20 10 [GeV] pp s Equivalent c.m. energy 3 10 4 10 5 10 Tevatron LHC
accelerator data (p−p) + Glauber
Fig. 1.6: Left panel: Accelerator data for proton-pron and proton-antiproton cross sec-tions, and their extrapolations to the highest energies, from Ref. [9]. The black dots represent a compilation of experimental measures of the cross sections. The two highest energy dots are measurements from Fermilab. The central blue solid line represents the conventional model of Pomeron parametrization by Donnachie and Landshoff [5]. The two extreme dashed lines stand for the extreme extrapo-lations proposed by Pancheri et al. [6], and by the two-pomeron model of Land-shoff [7,8]. The vertical dashed line shows the position corresponding to the 14 TeV data from the LHC; Right panel: Proton-air cross sections computed within the framework depicted in Ref. [10]. Figure from Ref. [9]. The four lines correspond to the extrapolations of four usual models used in cosmic ray physics. The shaded area corresponds to the area delimited by the two extreme extrapolations shown in the left panel.
to higher energies. The central blue solid line represents the conventional model of Pomeron parametrization by Donnachie and Landshoff [5]. The two extreme dashed lines stand for the extreme extrapolations proposed by Pancheri et al. [6], and by the two-pomeron model of Landshoff [7, 8]. The vertical dashed line shows the position corresponding to the 14 TeV data from the LHC. The range of possible extrapolations of p-p cross section at energies corresponding to the cutoff at E ∼ (4 − 6) × 1019eV
is huge. The predicted p-p cross sections may differ by a factor of four. One can see that the future LHC data will enable one to significantly reduce the range of possible p-p cross section even at trans-GZK energies.
The main models that are currently used in cosmic-ray physics are QJSJET 01 [11, 12], QJSJET II [13–15], SIBYLL [16–18], and EPOS [19]. These models differ from
one to another by their phenomenological assumptions. A review of these assumptions can be found in Ref [2]. Their free parameters are tuned to the existing accelerator data, so as to reproduce it. Their goal is to extrapolate known hadronic cross-sections to the ultra-high energies at the end of the cosmic ray spectrum, where no accelerator data is available [2, 9].
Figure 1.6 (right panel) shows the extrapolations of proton-air cross sections by QJSJET 01, II, EPOS and SIBYLL. The proton-air cross sections are computed from the proton-proton cross sections within the framework depicted in Reference [10]. For comparison, the Donnachie and Landshoff extrapolation is shown by the blue line, and the region within the two extreme extrapolations presented in the left panel is shaded in blue. The extrapolations of the four models differ from one to another, but all are more or less close to the medium conventional extrapolation.
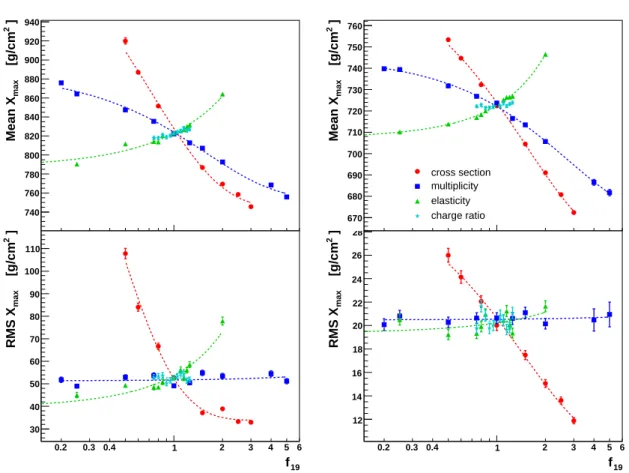
The parameters that are measured experimentally are the depth of shower max-imum Xmax and the width of its distribution, RMS(Xmax). Figure 1.7 presents the
variations induced on the values of Xmax and RMS(Xmax) predicted by shower
com-putations with the SIBYLL model when one of the physical parameters is modified. Both proton and iron primaries are tested. The four tested physical parameters are p-air cross section, the multiplicity of particles produced after the interaction, the elasticity (i.e. the fraction of the primary energy taken by leading particle) and the pion charge ratio of hadronic interactions. Their values are modified by a factor f19
compared to their values used in the SIBYLL model. f19 ranges from 0.2
(parame-ter divided by 5) to 5 (parame(parame-ter multiplied by 5). The lines corresponding to the modification of the cross section, multiplicity, elasticity and pion charge ratio are respectively denoted by red, dark blue, green and light blue dashed lines.
Some of the first LHC 7 TeV data have still not been published yet. Reference [2] tests the predictions of cosmic-ray interaction models with the CMS 7 TeV data. It concludes that no model can presently fit correctly all tested experimental observables. The 7 TeV data is the first data at energies above the knee. The paper [2] shows that the alternative interpretation of the knee as a side-effect of rapidly changing hadronic interaction properties in this region is ruled out. The knee does have a true astrophysical origin.
The most important LHC data for cosmic ray physics is the data from LHCf and TOTEM experiments which are two detectors designed to measure particles in the forward region, i.e. with low transverse momenta. The LHCf experiment is located in the LHC tunnel, 140 meters away from the ATLAS interaction point. It is designed to detect neutral particles (photons, neutrons and π0) leaving the interaction point with
small angles with respect to the beam axis -less than 10◦. It will measure forward
particle production in p-p, p-Pb, and Pb-Pb collisions. The TOTEM experiment is located around the CMS interaction point and is designed to measure with a precision of 1% the total and elastic p-p cross sections. Their data are not available yet. The
] 2 [g/cm max Mean X 740 760 780 800 820 840 860 880 900 920 940 19 f 0.2 0.3 0.4 1 2 3 4 5 6 ] 2 [g/cm max RMS X 30 40 50 60 70 80 90 100 110 ] 2 [g/cm max Mean X 670 680 690 700 710 720 730 740 750 760 cross section multiplicity elasticity charge ratio 19 f 0.2 0.3 0.4 1 2 3 4 5 6 ] 2 [g/cm max RMS X 12 14 16 18 20 22 24 26 28
Fig. 1.7: Impact of hadronic interaction parameters on the predicted Xmaxand RMS(Xmax) of air showers, for proton primaries (left panel) and iron primaries (right panel) of energy 1019.5eV, from Ref. [9]. Dependence on cross section, multiplicity, elas-ticity and pion charge ratio denoted by respectively red, dark blue, green and light blue dashed lines.
LHCf collaboration presented in Refs. [20, 21] a first insight at some results of their preliminary 7 TeV data analysis. They find that the shape of the photon production cross section is well described by the SIBYLL and EPOS models, while the neutron production cross section is well described by the QGSJET codes.
1.3 Measurements: techniques and experiments
Any UHECR experiment shall measure the energies, arrival directions and compo-sition of the primary ultra-high energy cosmic rays. To do so, there are two main experimental techniques that can be either used separately or combined: surface de-tectors (SD) detecting particles at the ground level and fluorescence detection of the shower development (FD). Figure 1.8 presents a generic sketch of the two techniques. The shower is shown in red.
The SD detects secondary particles of the air shower. At E > 1018eV, around 1010−11 secondary particles are spread on ∼ 10km2. Therefore, putting a small
de-tector with an area of the order of ∼ 1m2 every ∼ 1km on a surface grid is
suffi-cient for UHECR detection. For the Auger experiment, the surface detectors consist of water tanks put every 1.5 km. This guarantees a full detection efficiency above E = 3× 10¹⁸eV. The water tanks detect the Cherenkov light emitted by secondary
(anti-) muons µ± or electron/positrons e±. The number of detected low energy
par-ticles is connected to the primary CR energy. The measurement by the SD of the shower front arrival time enable one to reconstruct the arrival direction of the primary on the celestial sphere. The comparison of the number of muons to the number of electrons gives information on the primary particle type.
The FD consists of fluorescence detectors that measure the fluorescence emission of N2 molecules excited by secondary e±in the shower. This technique can only work
during moonless nights. The total amount of light is connected to the primary CR energy. The plane containing the shower axis can be reconstructed by one fluorescence telescope. In order to reconstruct within this plane the direction of the shower axis one either needs a measurement from a second telescope, or shower front arrival time information from one ground detector. The shower axis gives the arrival direction of the primary cosmic ray. The lateral fluorescence emission strength measured along the shower axis can be fitted with phenomenological functions, such as the Gaisser-Hillas. The position of the emission maximum enables one to determine the value of the depth of shower maximum Xmax, which gives information on the primary type.
We review and describe below the main experiments designed to detect UHECR. The first three “large” UHECR experiments were Volcano Ranch, Haverah Park and the Sydney University array (SUGAR), respectively located in New Mexico (US), UK and New South Wales (Australia). They consisted of ground arrays, constructed
Fig. 1.8: Sketch of the two main experimental techniques used to measure the energy, arrival direction and composition of primary cosmic rays: Surface detectors and fluores-cence telescopes. The shower is presented in red. Figure taken from Ref. [22].
in the end of the 1950s for Volcano Ranch and in the 1960s for the two others. The Yakutsk EAS array is a Russian experiment using the SD technique, with ground and underground detectors spread over 12 km2. It is designed to detect CR
above 1017eV. It began taking data in 1970 and is currently still operational.
The AGASA (Akeno Giant Air Shower Array) experiment was a Japanese UHECR experiment consisting of ∼ 100 SD spaced by ∼ 1 km and spread over 100 km2. It
was operational from 1993 to 2003.
The High Resolution Fly’s Eye or HiRes was an experiment located in Utah, USA. It operated from 1997 to 2006. It consisted of two sets of fluorescence telescopes, HiRes 1 and HiRes 2, located on the tops of two small mountains.
The currently largest experiment, the Pierre Auger Observatory, is led by an international collaboration. The detector is located in the southern hemisphere, in Argentina. It is the first UHECR experiment to combine both SD and FD techniques. Its surface array consists of 1600 Cherenkov stations (water tanks and photomulti-pliers), with a 1.5 km spacing. They are spread over 3000 km2, which implies a thirty times larger flux sensitivity than AGASA. The FD consists in 24 telescopes put in 4 different enclosures, surrounding the region covered by the SD. Figure 1.9 (left panel) shows the locations of the Pierre Auger Observatory SD and FD on a map.
The Telescope Array (TA), located in Utah (US), is the second experiment to combine SD and FD. It aims at testing the discrepancy between AGASA and HiRes results. The SD consists of 576 plastic scintillation detectors, and the FD telescopes are located in three stations. TA sensitivity is smaller than the Auger one. It is about nine times the sensitivity of AGASA. TA is currently starting to record its first data. Auger North is a proposed SD and FD detector for the Northern hemisphere, and would collect 3− 5 times more statistics than Auger South. Its surface may be 10000 or 15000 km2. It is presently not supported.
The next generation of UHECR detectors will be represented by space experiments detecting the fluorescence emission of showers as seen from low Earth orbits. The leading international experiment is JEM-EUSO. Its fluorescence camera will be on board of the International Space Station. It may start to operate in 2015. Russia proposed the experiments TUS and KLYPVE. TUS will precede both JEM-EUSO and KLYPVE, and aims at testing the feasibility of space detection of air showers.
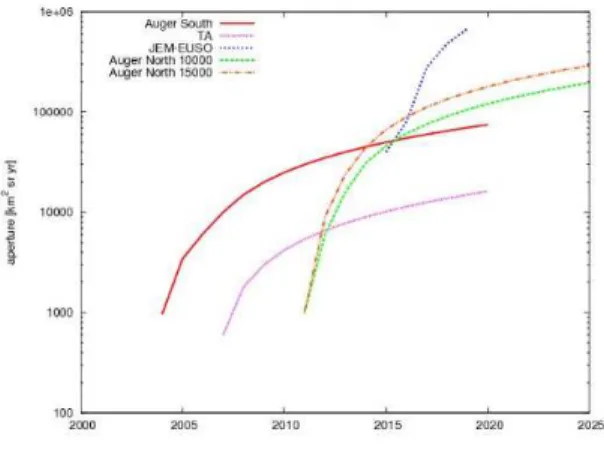
Figure 1.10 presents the integrated exposures at 1020eV for Auger, Telescope
Array and JEM-EUSO experiments. The integrated exposure is proportional to the number of collected particles. It shows that TA will not overcome Auger in terms of statistics, and that JEM-EUSO will have one order of magnitude more data than Auger after only a few years of data taking.
Fig. 1.9: Left panel: Map of the Pierre Auger Observatory. The red dots represent the locations of the 1600 tanks and the green lines denote the directions of each tele-scope. Figure from Ref. [22]; Right panel: Sketch of JEM-EUSO experiment detecting the fluorescence of an extensive air shower. Figure from Ref. [23].
Fig. 1.10: Integrated exposures at 1020eV for Auger South, Auger North (10000 km2 and 15000 km2 surfaces), Telescope Array and JEM-EUSO experiments. They are respectively represented by red, orange (10000 km2), green (15000 km2), magenta and blue lines. Figure taken from Ref. [4].
Fig. 1.11: Photon backgrounds energy densities at Z ∼ 0, from Ref. [24]. Blue distribution for visible and near infrared light from star emission, red for infrared from dust remission of star light, and grey for CMB photons. Radio background photons are not represented here.
1.4 UHECR spectrum and cutoff
1.4.1 Photon backgrounds, pair and pion production
Outside the large scale structure, the density of matter is very low. In practice, UHECR that travel in the extragalactic medium are mostly sensitive to the back-grounds of photons.
UHECR on their way to the observer may suffer energy losses due to interactions with the photon backgrounds and also due to redshifting -Universe expansion.
Figure 1.11 presents the energy densities of photon backgrounds. The Extragalac-tic Background Light (EBL) is represented at redshift Z ∼ 0. Blue distribution for visible and near infrared light from star emission, red for infrared from dust remis-sion of star light, and grey for the Cosmic Microwave Background (CMB) photons. Radio background photons are not represented in the figure. The most energetic pho-tons have energies of the order of 10 eV. Only propho-tons and nuclei at the very highest energies, E >∼ 1018eV, may suffer energy losses by interacting with them.
For proton primaries, only the CMB photons play a significant role. There are two main reactions with photons of the CMB. First, protons can produce electron-positron pairs, through the reaction
Since the e+e− pair is light, the proton energy loss y
pγ→ee = 2me/mp ≃ 10−3 is low.
The energy threshold of this reaction is Eth,pγ→ee = memp/ǫ0 ∼ 2 × 10¹⁸eV, where ǫ0
is the average CMB background energy:
ǫ0 = π4T0/30ζ(3)≃ 6.4 × 10⁻⁴ eV . (1-3)
The cross section of the reaction is σpγ→ee ∼ α3/m2e ∼ 6 × 10⁻²⁸cm2. The order
of magnitude of the interaction length for this reaction is 1/(nCMBσpγ→ee)∼ 1 Mpc,
where nCMB ≃ 400cm−3 is the CMB photon density. The energy loss distance is:
Lpγ→ee =
1
ypγ→ee× nCMB× σpγ→ee ∼ 1000 Mpc .
(1-4) The second set of reactions to consider are the pion and multi-pion photoproduc-tion by protons interacting with CMB photons. It was first theoretically predicted by K. Greisen [25], and by G. T. Zatsepin and V. A. Kuzmin [26]. It has therefore been called the Greisen-Zatsepin-Kuzmin (GZK) effect. The reactions are:
p + γCMB → ∆+→ p + π0, (1-5)
p + γCMB→ ∆+→ n + π+, (1-6)
p + γCMB → N + n π, with n ≫ 1. (1-7)
Single pion production starts above the energy threshold: Eth,pγ→Nπ =
m2
π + mpmπ
4ǫ0 ∼ 4 × 10
19 eV , (1-8)
where mp and mπ are respectively the proton and pion masses, and ǫ0 is the average
CMB background energy, defined in Eqn. (1-3).
The cross section of single pion production is σpγ→Nπ ≃ 5 × 1028cm2. The
inter-action length is 1/(nCMBσpγ→Nπ) ∼ 2 Mpc, which is comparable to the interaction
length of e+e− pair production. However, due to the higher mass of the pions, the
energy loss distance LpγNπ is much shorter:
LpγNπ =
1
ypγ→Nπ× nCMB× σpγ→Nπ ∼ 10Mpc ,
(1-9) where ypγ→Nπ = mπ/mp ≃ 0.2 is the proton energy loss for single pion production.
The multi-pion production cross section is about five times smaller, but the energy loss per interaction is ≃ 50%. Therefore, the order of magnitude of the energy loss distance for multi-pion production is the same: Lpγ→Nnπ ∼ 10 Mpc.
Fig. 1.12: Proton interaction and attenuation lengths due to photoproduction processes versus the UHE proton energy. Figure from Ref. [27]. The proton attenuation length for e+e− pair production is denoted by the thin solid line, and the atten-uation length for single and multi-pion production by the thick solid line. The interaction length for pion production is represented by the dashed line.
At energies below Eth,pγ→Nπ, photoproduction of pions is also possible due to the
EBL photons which have larger energies than CMB photons. This reaction is however less significant than the e+e−pair production, due to the low density of EBL photons:
nEBL ≃ 0.5cm−3.
Figure 1.12 presents the computations from Ref. [27] of the interaction and at-tenuation lengths of these photoproduction processes versus the UHE proton energy. Both EBL and CMB photon backgrounds are taken into account. Proton attenua-tion length for e+e−pair production is denoted by the thin solid line, and attenuation
length for single and multi-pion production by the thick solid line. The interaction length for pion production is represented by the dashed line. To summarize, one can expect a small attenuation of the UHECR proton flux around the ankle and a strong suppression of the flux above a few times 1019eV, called the GZK cutoff. As
shown by Figure 1.12, above ∼ (8 − 9) × 1019eV, protons do not travel more than
∼ 100 Mpc. Therefore, trans-GZK UHECR seen at Earth should mostly come from sources located in our local Universe, in the so-called GZK sphere. The size of this sphere depends on the energy. At such distances, ∼ 50 − 100 Mpc, the Large Scale Structure (LSS) of matter distribution is still anisotropic.
In case the UHECR flux at the highest energies is dominated by nuclei, one should also expect a “GZK-like” cutoff in the spectrum above a few times 1019eV.
Nuclei interact with EBL and CMB photons through several processes. At the energies relevant for UHECR, the dominant process is the Giant Dipolar Resonance
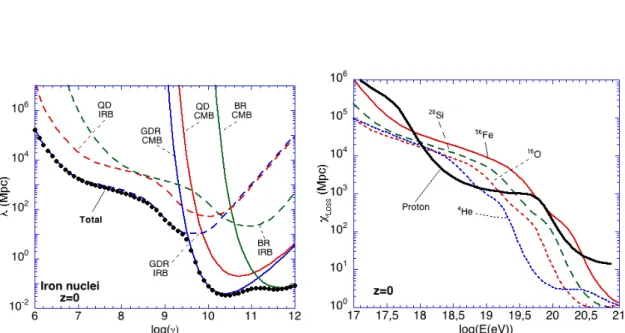
Fig. 1.13: Left panel: Interaction length for processes with iron nuclei at Z ∼ 0, versus the nuclei Lorentz factor γ, from Ref. [28]. Blue solid and dashed lines respectively for the GRD on CMB and infrared photon backgrounds. Green solid and dashed lines respectively for the pion photoproduction on the GRD on CMB and infrared backgrounds. Black dots for the total interaction length. Iron nuclei with energy E = 1020eV have a boost factor γ∼ 2 × 10⁹; Right panel: Attenuation lengths for proton, He, O, Si and Fe nuclei, as a function of the energy. Figure from Reference [29].
(GDR). It usually consists in the ejection of one nucleon A + γ → (A − 1) + N, or sometimes more than one nucleon for some types of nuclei. For iron nuclei, the threshold on CMB photons is ∼ 8 × 10¹⁹eV, but the flux suppression is non
negli-gible below this energy due to the GDR on EBL photons. Phenomenological GDR calculations for UHE nuclei are proposed in Reference [30]. The results of computa-tions from Ref. [28] on iron nuclei interaction length λ, versus their boost factor γ are presented in Figure 1.13 (left panel). Iron nuclei with energy E = 1020eV have
a boost factor γ ∼ 2 × 10⁹. The total interaction length is shown by the black dots,
while the contribution of the GDR on CMB is denoted by the solid blue line and the GDR on EBL (mostly infrared photons) by the dashed blue line. At very high energies (above observed energies), the GDR on CMB becomes subdominant and is replaced by the photoproduction of pions on the CMB. In Figure 1.13 (left panel), this process is represented by the green solid line denoted by “BR”. This process on infrared photons (green dashed line) is subdominent at any energy. Even if the composition is heavy, one should also see a cutoff in the UHECR spectrum above a few times 1019eV. Moreover, nuclei at the highest energies should also come from
sources located in our local Universe.
Figure 1.13 (right panel) presents the attenuation lengths for proton, He, O, Si and Fe nuclei, as a function of the energy. Computations are from Ref. [29]. The values strongly depend on the nuclei type. At the very highest energies E >∼ 1019.7eV, proton
and Fe nuclei can travel longer distances in the photon backgrounds than intermediate nuclei, such as He, (CN)O or Si nuclei.
To summarize, accelerated cosmic rays lose their energy during the propagation from the sources to the Earth due to pion production, e±pair production and
redshift-ing. These energy losses define the horizon - the typical distance from which cosmic rays can reach us with a final energy bigger than some value. The horizon value was discussed in Ref. [31], in the constant energy loss approximation. It was updated to realistic stochastic energy losses in Ref. [32]. Finally, the effects of the experimental energy resolution were taken into account in [33]. Assuming an energy resolution ∆E/E = 10%, 70% of sources would be located within ≃ 55 Mpc of the Earth for energies E > 1020eV, and within ≃ 180 Mpc of the Earth for E > 6 × 10¹⁹eV, both
for protons and iron nuclei.
1.4.2 Measured spectrum and implications
The first observation of a cutoff at E > (4− 6) × 1019eV in the UHECR energy
spectrum was reported in 2005 by HiRes experiment, and published in Refs. [34, 35]. Figure 1.14 (right panel) presents the final HiRes spectrum (black and red points), compared to the former AGASA spectrum (blue points). HiRes observed a statistically significant break in the spectrum. It does not confirm the flux excess at
log10(E (eV)) Flux*E 3/10 24 (eV 2 m -2 s -1 sr -1) AGASA HiRes-1 Monocular HiRes-2 Monocular 1 10 17 17.5 18 18.5 19 19.5 20 20.5 21
log10(E) (eV)
Integral Flux Ratio
HiRes-I Monocular HiRes-II Monocular 0 0.2 0.4 0.6 0.8 1 1.2 17 17.5 18 18.5 19 19.5 20 20.5 21
Fig. 1.14: Right panel: Final UHECR energy spectrum multiplied by E3 as measured by HiRes experiment. Black and red points respectively for HiRes-2 and HiRes-1. Blues points for the former AGASA spectrum. HiRes shows the existence of a cutoff and does not confirm the excess of AGASA; Left panel: Ratio of the measured flux to the flux expected without cutoff by extrapolating the values from the E ∼ 1018.6− 1019.7eV energy range. Figures from Ref. [36].
the highest energies measured by AGASA. This excess has never been cross-checked by FD and SD for the same showers. Telescope Array experiment can potentially do this. Contrary to Auger, TA measures the EM component of showers both in FD and SD. Figure 1.14 (left panel) presents the ratio of the measured flux to the flux expected without cutoff by extrapolating the values from the E ∼ 1018.6− 1019.7eV
energy range.
In 2008, the Auger experiment confirmed the cutoff existence [38]. The significance of the flux suppression due to the cutoff is currently larger than 20σ [37]. The Auger most recent spectrum is shown by black dots in Figure 1.15. Above ≃ 1019.5eV, the
spectrum may be fitted with the power law E−4.3±0.2 [37]. The HiRes spectrum is
denoted by the blue dots. In practice, the two spectra are consistent. They coincide if the Auger spectrum is shifted by ≃ +25% in energies. This roughly corresponds to the error on energies that one can expect with the reconstruction techniques.
These measurements of the cutoff, together with the measurements of the depth of shower maximum Xmax and of the limits on photon flux at UHE [39], prove that the
UHECR flux is dominated by hadrons. These are either protons or nuclei, accelerated in astrophysical sources. Other more exotic theoretical scenarios called “top-down” scenarios had been proposed before, especially after AGASA reported an unexpected flux excess at the highest energies. UHECR could for example have been Super Heavy Dark Matter particles. UHECR might also have been decay products of particles of mass close to the GUT scale, produced in the early Universe, possibly during reheating after inflation [27].
Energy [eV] 18 10 1019 1020 ] 2 eV -1 sr -1 yr -2 J(E) [km 3 E 37 10 38 10 (E/eV) 10 log 18 18.5 19 19.5 20 20.5 (E)=22% sys σ HiRes Auger power laws
power laws + smooth function
Fig. 1.15: Auger energy spectrum multiplied by E3 (black dots). HiRes energy spectrum is shown in blue. Figure from Ref. [37].
1.5 Theoretical models and composition
1.5.1 Detection of the ankle
Fly’s Eye experiment (the precursor of HiRes) reported in Ref. [40] the presence of a dip around a few 1018eV in the UHECR spectrum, the ankle. It was suggested
that this may be the signature of the Galactic-extragalactic UHECR origin transi-tion. References [41,42] showed that this break may be due to the e±pair production
of Eqn. (1-2). This suggests that CR with energies both below and above the an-kle may be extragalactic protons -see Section 1.5.2. Later, Ref. [43] claimed that composition measurements of < Xmax > are better fitted with a mixed composition
-see Section 1.5.3. In this model, the ankle corresponds to the Galactic-extragalactic transition. We present in Section 1.5.4 the latest composition measurements of the Pierre Auger Observatory. They show a shift towards a heavier composition above ∼ 1019eV, which represents a challenge to existing theoretical models of UHECR.
1.5.2 Extragalactic UHECR protons model and HiRes/TA measurements
The model presented by V. Berezinsky and his collaborators in Refs. [41,42] proposes that the CR flux is dominated by Galactic CR up to the second knee. The model suggests that Galactic sources can accelerate protons up to the knee and that between
Fig. 1.16: V. Berezinsky et al. cosmic ray model [41, 42]: Extragalactic protons can fit the data above energies E ∼ 1018eV. Dots for the data from Yakutsk, AGASA, Fly’s Eye and HiRes experiments. Solid lines stands for the predicted spectra in case UHECR are extragalactic protons.
the knee and the second knee, one observes consecutively the cutoffs of rigidity-dependant knees for more and more heavy nuclei. This model also proposes that above E >∼ 1018eV, the CR flux is dominated by protons of extragalactic origin. In practice,
this would require a low energy cutoff of the extragalactic component in the same region as the high energy cutoff of the Galactic component. References [44–46] first proposed and discussed the possibility that this low energy cutoff may be due to CR propagation in extragalactic magnetic fields, and may not be an injection processes consequence. In such a case, cosmic rays with low enough energies would diffuse in extragalactic magnetic fields, and only CRs from a small fraction of local sources within a magnetic horizon would be able to reach the Earth in less than a Hubble time. With a numerical simulation of extragalactic magnetic fields, Reference [47] also found that cosmic rays below E <∼ 1018eV may stay confined around their sources,
leading to a strong suppression of the extragalactic flux below such energies.
Reference [42] argues that the scenario of extragalactic protons above the second knee is well supported by the measured UHECR energy spectra. As explained in Section 1.4, the UHECR proton flux should be suppressed around the ankle in the energy range 1018 − 1019eV due to the e+e− pair production. A small dip in the
spectrum should be visible at such energies. The UHECR spectrum should also exhibit a clear GZK cutoff. At the time this paper was published, the cutoff at E > (4− 6) × 1019eV was still not measured with enough statistics by HiRes. On
the contrary, the dip around the ankle was already very clear in all tested data, from Yakutsk EAS Array, AGASA, Fly’s Eye and HiRes. The authors conclude it supports that the flux at UHE is dominated by extragalactic protons.
Figure 1.16 presents results from Ref. [42]. The dots represent the energy spectra of Yakutsk, AGASA, Fly’s Eye and HiRes experiments, multiplied by E3. The solid
lines stand for the predicted spectra in case UHECR are extragalactic protons. The shape of the dip is not very model dependant [42]. The AGASA excess at the highest energies is not confirmed by other experiments.
This theoretical model is compatible with the composition studies of HiRes [48] and with the preliminary results of Telescope Array [49]. They both report that their data are compatible with a proton composition above E >∼ 1018eV. The results of
HiRes show that both the distribution of the mean shower depth maximum < Xmax>
and the dispersion RMS(Xmax) are compatible with a proton composition at the
highest energies.
Figure 1.17 (left panel) presents the values of the mean Xmax versus the energy,
as measured by HiRes above E >∼ 1018eV and by HiRes/MIA in the E = 1017 −
1018eV range. Blue filled and open black dots respectively stand for 2009 and 2005
HiRes measurements of < Xmax>. Red filled dots represent HiRes/MIA data. Solid
black lines are QGSJet II predictions for protons and iron nuclei. This plot shows a transition of composition around ≃ 1018eV. Below this energy, the flux is more
heavy than protons -not very far from the QGSJet II predictions for iron nuclei at E ∼ 1017eV- and becomes lighter when the energy is increased. Above 1018eV, the
values of < Xmax > are consistent with the predictions of QGSJet II for protons.
Figure 1.17 (right panel) presents HiRes results for RMS(Xmax) versus the
en-ergy. Filled dots, open squares and open triangles respectively stand for HiRes data, QGSJet II predictions for protons, and QGSJet II predictions for iron nuclei. The values of RMS(Xmax) are also compatible with a proton composition above 1018eV.
1.5.3 Mixed composition model
The authors of Reference [43] claimed in 2005 that the measurements of < Xmax> are
better fitted with a mixed composition at sources than with a pure proton composition as presented above. They consider a UHECR composition made of a mix of protons (mostly), light and heavy nuclei up to iron nuclei (Z = 26). The composition they take is similar to the composition of Galactic cosmic rays at lower energies.
In such studies, one must take into account the energy losses of all types of nuclei. A fraction of the nuclei initially injected at the sources photodisintegrates into lighter nuclei. Figure 1.13 (right panel) presents the attenuation lengths for proton, He, O, Si and Fe nuclei, as a function of their energy.
Fig. 1.17: Left panel: Evolution of the mean shower depth maximum Xmax versus the en-ergy as measured with HiRes 2005 (open black dots), HiRes 2009 (blue filled dots) and HiRes/MIA data (red filled dots). The solid lines represent the QGSJet II predictions for protons (upper line) and iron nuclei (lower line). From Ref. [50]; Right panel: Evolution of the width of Xmaxdistributions, RMS(Xmax), versus the energy as measured by HiRes. Filled dots for HiRes data, and open squares and triangles respectively for QGSJet II predictions for protons and iron nuclei. Figure from Ref. [51].
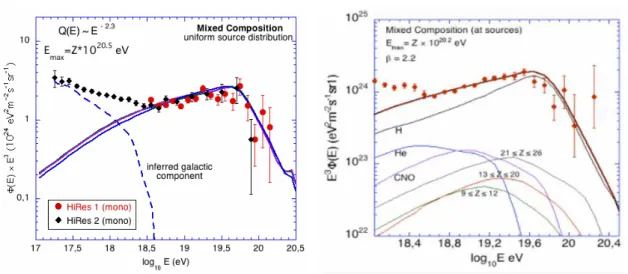
Fig. 1.18: Confrontation with the data of mixed composition and proton only models. Left panel: Mixed composition model (solid line) fitting the 20005 HiRes data (dots), as in Ref. [43]. Dashed line for the inferred Galactic component; Right panel: Mixed composition model fitting the final HiRes data (dots), as in Ref. [54].
production dip, except in the limit case of a large proton fraction [52, 53]. The ankle is the signature of the Galactic-extragalactic transition, while in the pure proton composition scenario, it corresponds to the pair production dip. Therefore, the mixed composition model proposes that the Galactic CR dominate the flux up to energies E ∼ 3 × 10¹⁸eV. The mixed composition extragalactic flux is represented with the
solid line fitting the higher energy part of the HiRes energy spectrum in Figure 1.18 (left panel), while the deduced Galactic component is represented with the dashed line. The maximum energy up to which extragalactic sources are able to accelerate nuclei of charge Z was taken as Emax = Z × 1020.5eV. Figure 1.18 (right panel)
presents another fit from Ref. [54] with the final HiRes data. The maximum energy was taken as Emax= Z× 1020.2eV. The contributions of each set of nuclei charges Z
to the total flux is represented by the H, He, CNO, 9 ≤ Z ≤ 12, 13 ≤ Z ≤ 20 and 21≤ Z ≤ 26 lines.
This scenario suggests that the UHECR flux is from Galactic origin up to the ankle. To be sufficiently confined, these Galactic CRs must be heavy nuclei. One needs to find Galactic sources able to accelerate iron nuclei up to E ∼ 3 × 10¹⁸eV.
The Galactic center, or very powerful SNR at the very beginning of their formation may for instance be potential sources.
There are also challenges to this model. For example, the data show that the anisotropy on the celestial sphere of cosmic ray arrival directions is very low at the
ankle energy. Moreover, no correlation of arrival directions with the Galactic plane has been reported. This implies that the turbulent component of the Galactic magnetic field (see Chapter 2) should be sufficiently strong and have a sufficiently large corre-lation length to randomize arrival directions of these Galactic CRs at Earth. Present simulations show that at the ankle energy, iron nuclei behaviour is intermediate be-tween diffusion and drift regime, for realistic Galactic magnetic field parameters.
Besides, Ref. [55] found that if UHECR sources are embedded in strongly mag-netized regions within the LSS, a mixed composition at sources is not necessarily incompatible with the ankle as the pair production dip. This is notably due to a less efficient escape of heavier nuclei from the source surroundings.
1.5.4 Auger 2009 results
Both previous models predict a UHECR flux dominated by protons at the very highest energies. However, Auger experiment published in 2009 composition measurements which show a clear shift towards heavy nuclei above 1019eV [56].
Figure 1.19 presents the results of Auger FD composition studies on the mean Xmax and the RMS(Xmax) versus the energy (denoted with black filled dots). The
data is confronted with the prediction of four hadronic interaction models for protons (red lines) and iron nuclei (blue lines). Even if one takes into account the uncer-tainties on the hadronic interaction models, both the variations of < Xmax > and
RMS(Xmax) favour this hypothesis. Moreover, the break in the slopes of < Xmax >
and RMS(Xmax) measurements cannot be explained without a composition change
towards heavier nuclei (except in the very exotic case of rapidly changing hadronic properties at this energy, due to unknown and unexpected new physics).
The Auger measurements of the mean Xmax may still be compatible with the
HiRes ones (denoted with black open dots), within the error bars. However, the Auger results on RMS(Xmax) tend to be incompatible with HiRes ones, see RMS(Xmax) from
HiRes in Fig. 1.17 (right panel).
The muon data of the Auger SD also tends to favour a shift towards a heavy com-position above 1019eV. In practice, it requires the energy calibration to be rescaled
by ≃ +30%. This rescaling would still be reasonable, since the systematic uncer-tainties on the energy reconstruction are ∼ ±25%. The muon number Nrel
µ (1000m)
is defined as the number of muons measured by the SD, divided by the number of muons predicted by QGSJet II for proton primaries. For QGSJet II iron nuclei, the muon number is≃ 1.3. Figure 1.20 shows for four different reconstruction techniques (denoted a, b, c and d) the inferred measured muon numbers at 10 EeV, versus the energy scale of the primary compared to the FD. Details on the reconstruction tech-niques are given in Ref. [57]. If the energy is rescaled by ≃ +30%, the Auger SD muon number can be compatible with an iron composition. It coincides with the
Fig. 1.19: Auger FD composition measurements (2009), from Ref. [56]. Black filled dots for Auger Xmax (upper panel) and RMS(Xmax) (lower panel) measurements. Black open dots for HiRes measurements of Xmax. Red lines for hadronic interaction models predictions for protons. Blue lines for iron nuclei. The data show a shift towards heavy nuclei above 1019eV.
Fig. 1.20: Auger SD composition measurements (2009) from Ref. [57]. Muon numbers at 10 EeV inferred from four different muon reconstruction methods (denoted a, b, c and d [57]), versus the SD energy scale compared to the FD. Magenta dashed line for QGSJet II protons and blue dashed line for QGSJet II iron nuclei. If the energy is rescaled by ≃ +30%, the muon data also favours a heavy composition.
blue dashed line, which represents the QGSJet II predictions for iron nuclei. In any case, the Auger muon data cannot be compatible with model predictions for proton primaries (magenta dashed line for QGSJet II protons).
The analysis of the Yakutsk EAS Array muon data gives results consistent with the Auger SD muon data. It reveals a significant heavy element fraction at energies above 1019eV [58].
Such a shift towards heavier nuclei at the highest energies is difficult to account for. One can for example suggest that the maximum energy to which sources can accelerate protons is low, of the order of 1019eV. In this case, nuclei of charge Z can
be supposed to be accelerated to Z times larger maximum energies, if they are able to escape their sources without been disintegrated. Therefore, in this scenario the overall flux is dominated by heavy nuclei above ∼ 1019eV. References [54, 59] show
that the energy spectrum of Auger experiment may be fitted with such a composition at injection. However, as shown in Ref. [60], fitting the Auger energy spectrum, < Xmax >, and RMS(Xmax) measurements at the same time is very complicated.
Recently, Ref. [61] reported that the Auger measurements on the mean Xmax
and RMS(Xmax) are in fact not consistent with each other, within the framework
of existing hadronic interaction models. This would imply that either the hadronic interaction models are not correct, or that the Auger data contains some systematic
error. This could explain why the authors of Reference [60] found that the most reasonable scenarios, such as mixtures of protons and iron nuclei, cannot fit the Auger data. They found that Auger data could be well fitted for sources accelerating primary intermediate mass nuclei (N or Si), with extragalactic magnetic fields of ≃ 0.3 nG strength and 1 Mpc correlation length.
Presently, the composition of ultra-high energy cosmic rays is still a controversial issue. In this thesis, both cases of UHE protons or light nuclei (Chapter 3), and of UHE heavy nuclei (Chapters 4 and 5) are considered.
1.6 Source candidates and acceleration mechanisms
Sources of UHECR are still unknown, and the deflections of cosmic rays in Galactic and extragalactic magnetic fields has prevented up until now their direct detection.
The standard mechanism proposed to accelerate protons or nuclei is the Fermi mechanism. It consists in transfering stochastically energy from non-homogeneous and rapidly moving magnetized structures to charged particles. The first version of this mechanism was suggested by Fermi in Ref. [62] and is now labelled as the “second order Fermi acceleration”. Particles scatter on magnetic clouds or centers which move with random velocities. They gain the energy ∆E ∝ E × (v/c)2 for each scattering,
where v is the velocity of the scattering center.
A more efficient acceleration mechanism is the so-called “first order Fermi accel-eration”, where particles are accelerated at shock waves as they go back and forth through it. It was proposed in Refs. [63–65]. For this process, the relative energy gain is proportional to v/c: ∆E ∝ E × (v/c).
Other processes have been proposed, such as “one-shot” particle acceleration along lines of rotation-induced electric fields. Reference [66] studied the efficiency of this mechanism to accelerate protons or nuclei to the highest energies around rotating supermassive black holes. Near a Kerr black hole (BH), for a magnetic field which is approximately aligned with the BH rotation axis, the rotational drag of the field generates an electric field close to the BH horizon. The induced electric field has a quadrupolar geometry and is aligned with the magnetic field along the rotation axis. The authors found that for some BH, protons and nuclei may be accelerated, in one shot, to energies above 1020eV along such field lines. They also found that the
conditions for nuclei acceleration are less stringent than those for protons.
Several other mechanisms have been proposed to accelerate cosmic rays to ultra-high energies.
Few astrophysical objects potentially have the ability to be UHECR accelerators. A basic criterion, proposed by Hillas [67], is that the source should be able to confine its cosmic rays. Therefore the UHECR Larmor radii RL should be smaller than the
size Rs of their accelerators: RL = E/(ZeB) ≤ Rs. This implies that the maximum
energy Emax up to which an object can confine an UHECR is:
Emax= ZeBRs ≃ 1 EeV · Z
B 1 µG
Rs
1 kpc . (1-10)
This Hillas criterion is not sufficient and the potential UHECR sources also have to satisfy several other conditions. For instance, some compact objects as magnetars may satisfy the Hillas criterion but are ruled out due to radiation losses. To summarize briefly, the characteristic acceleration time should be simultaneously smaller than the lifetime of the source, than the characteristic escape time of the UHECR from the source and than the energy loss time [68]. The escape time, ∼ R2
s/(2D) where
D is the diffusion coefficient, depends on the characteristics of the magnetic field, see References [69–73] for detailed studies. The constraints due to radiation losses have been reviewed in Reference [74]. Finally, one can also put conditions on the minimum power of the sources. The minimum total luminosity of sources able to accelerate UHECR to energies E ≥ 1020eV is usually found to be of the order of
∼ 1044−45erg·s−1 [75, 76]. Knowing the UHECR flux observed at Earth, conditions
on the density of UHECR sources in the Universe can be derived.
Figure 1.21 presents an updated Hillas plots from Ref. [74] with constraints from geometry and radiation losses for 1020eV protons (left panel) and 1020eV iron nuclei
(right panel). The plots show boxes which correspond to physical conditions (mag-netic field strength B and region size R) in several types of astrophysical objects. The boxes stand for conditions near neutron stars (NS), anomalous X-ray pulsars and magnetars (AXP). The immediate neighbourhood of supermassive central black holes (BH) of active galactic nuclei, the central parsecs (AD) of active galaxies and the jets (jets), are plotted for Seyfert galaxies (Sy), radio galaxies (RG) and blazars (BL). Gamma-ray bursts (GRB), starburst galaxies, giant shocks in galaxy clusters, as well as knots (K), hot spots (HS) and lobes (L) of powerful active galaxies (RG and BL) are also considered. The box corresponding to voids should be shifted to several orders smaller R and B values. Thus, voids cannot accelerate cosmic rays to UHE. The black line represents the limit below which sources are ruled out by the Hillas criterion. Shaded areas show regions that are still allowed when the radiation losses are taken into account. Light grey for one-shot acceleration in curvature-dominated regime only. Grey also allows one-shot acceleration in synchrotron-dominated regime. Dark grey allows both one-shot and diffusive (e.g. shock) acceleration.
The most promising sources are some types of AGNs and GRBs, as well as giant shocks in galaxy clusters occuring with structure formation. For active galaxies, UHECR may be accelerated near their supermassive central black hole, in the AGN jets, or in the giant lobes at the end of the jets. The most probable acceleration site is however presently unclear. Figure 1.21 shows that only some types of active galaxies
-15 -10 -5 0 5 LogHRkpcL -15 -10 -5 0 5 10 15 Log H B G L 1020 eV protons BHHSyL BHHRG,BLL AXP NS GRB ADHSyL jetsHSyL ADHRG,BLL jetsHRG,BLL K, HS, L starbursts clusters voids -15 -10 -5 0 5 LogHRkpcL -15 -10 -5 0 5 10 15 Log H B G L 1020 eV protons -15 -10 -5 0 5 LogHRkpcL -15 -10 -5 0 5 10 15 Log H B G L 1020 eV iron BHHSyL BHHRG,BLL AXP NS GRB ADHSyL jetsHSyL ADHRG,BLL jetsHRG,BLL K, HS, L starbursts clusters voids -15 -10 -5 0 5 LogHRkpcL -15 -10 -5 0 5 10 15 Log H B G L 1020 eV iron
Fig. 1.21: Updated Hillas plot from Ref. [74] with constraints from geometry and radiation losses for 1020eV protons (left panel) and 1020eV iron nuclei (right panel). Black line for the limit below which sources are ruled out by the Hillas criterion. Shaded areas are allowed regions when the radiation losses are taken into account. Light grey for one-shot acceleration in curvature-dominated regime only. Grey also allows one-shot acceleration in synchrotron-dominated regime. Dark grey allows both one-shot and diffusive (e.g. shock) acceleration. Boxes correspond to the conditions near neutron stars (NS), anomalous X-ray pulsars and magnetars (AXP) and in the immediate neighborhood of supermassive central black holes (BH) of active galactic nuclei, in the central parsecs (AD) of active galaxies, in jets (jets), for Seyfert galaxies (Sy), radio galaxies (RG) and blazars (BL). Gamma-ray bursts (GRB), starburst galaxies, giant shocks in galaxy clusters, as well as knots (K), hot spots (HS) and lobes (L) of powerful active galaxies (RG and BL) are also considered. The box corresponding to voids should be shifted to several orders smaller R and B values. Voids cannot be UHECR sources.
![Fig. 1.2: Cosmic ray spectrum multiplied by E 2.5 , from Ref. [2]. Three breaks in its slope (knee, ankle, cutoff) are easier to see](https://thumb-eu.123doks.com/thumbv2/123doknet/12893887.370850/12.892.229.640.193.500/cosmic-spectrum-multiplied-breaks-slope-ankle-cutoff-easier.webp)


![Fig. 1.19: Auger FD composition measurements (2009), from Ref. [56]. Black filled dots for Auger X max (upper panel) and RMS(X max ) (lower panel) measurements](https://thumb-eu.123doks.com/thumbv2/123doknet/12893887.370850/37.892.245.622.300.792/auger-composition-measurements-black-filled-auger-upper-measurements.webp)
