HAL Id: hal-02315592
https://hal.sorbonne-universite.fr/hal-02315592
Submitted on 14 Oct 2019
HAL is a multi-disciplinary open access archive for the deposit and dissemination of sci-entific research documents, whether they are pub-lished or not. The documents may come from teaching and research institutions in France or abroad, or from public or private research centers.
L’archive ouverte pluridisciplinaire HAL, est destinée au dépôt et à la diffusion de documents scientifiques de niveau recherche, publiés ou non, émanant des établissements d’enseignement et de recherche français ou étrangers, des laboratoires publics ou privés.
Revisiting the identification of commercial and historical
green earth pigments
Agathe Fanost, Alice Gimat, Laurence de Viguerie, Pauline Martinetto,
Anne-Claire Giot, Martin Clémancey, Geneviève Blondin, Fabrice Gaslain,
Helen Glanville, Philippe Walter, et al.
To cite this version:
Agathe Fanost, Alice Gimat, Laurence de Viguerie, Pauline Martinetto, Anne-Claire Giot, et al.. Revisiting the identification of commercial and historical green earth pigments. Col-loids and Surfaces A: Physicochemical and Engineering Aspects, Elsevier, 2020, 584, pp.124035. �10.1016/j.colsurfa.2019.124035�. �hal-02315592�
Revisiting the identification of commercial and historical
1
green earth pigments
2
Agathe Fanosta,b, Alice Gimata, Laurence de Vigueriea, Pauline Martinettoc, Anne-Claire 3
Giota, Martin Clémanceyd, Geneviève Blondind, Fabrice Gaslaine, Helen Glanvillea, 4
Philippe Waltera, Guillaume Mériguetb, Anne-Laure Rolletb, Maguy Jabera,* 5
6 a
Sorbonne Université, CNRS UMR 8220, LAMS, case courrier 225, 4 pl. Jussieu 75252 7
Paris cedex 05, France 8
b
Sorbonne Université, CNRS UMR 8234, PHENIX, case courrier 51, 4 pl. Jussieu 9
75252 Paris cedex 05, France 10
c
Univ. Grenoble Alpes, Inst NEEL, F-38042 Grenoble, France 11
CNRS, Inst NEEL, F-38042 Grenoble, France 12
d
Université Grenoble Alpes, CNRS, CEA, DRF/BIG/LCBM (UMR 5249), pmb, F-38054 13
Grenoble, France 14
e
MINES ParisTech, PSL - Research University, MAT - Centre des matériaux, CNRS 15
UMR 7633, BP 87, F-91003 Evry, France 16 17 *Corresponding Author: 18 Maguy Jaber 19 Tel: +33-(0)1-4427-6289 20 Email: maguy.jaber@sorbonne-universite.fr 21 22
Abstract
23Green earth is a common green pigment based on celadonite and glauconite, used 24
since Antiquity by artists. Two geological minerals, eight commercial green earth 25
pigments and a sample taken from a historical location in Monte Baldo were 26
characterized. A set of different techniques including X-Ray diffraction (XRD), scanning 27
electron microscopy coupled to energy dispersive spectroscopy (SEM-EDS) and 28
numerous spectroscopies: spectrophotocolorimetry, near and mid infrared, Raman, 29
Mössbauer were used to identify the structure and composition of the different earths. 30
The results highlight complex composition with the presence of various phases, which 31
can be due to the pigment sampling at a different location in the same deposit. Mobile 32
and non-invasive analyses were carried out in order to suggest a protocol for the 33
identification of green earth in artworks, and more specifically to distinguish celadonite 34
and glauconite. With the available mobile non-invasive techniques, and the above 35
analyses on the raw pigments, the green area in Nicolas Poussin’s painting, 36
Bacchanales d’enfants (Galleria Nazionale d’Arte Antica (GNAA), Rome) was examined 37
as a case study. 38
Keywords: Green earth, celadonite, glauconite, XRD, Mossbauer, SEM-EDS. 39
Graphical Abstract
41 42
43 44
1 Introduction
45
Green earth pigments along with malachite (Cu2CO3(OH)2) and verdigris (pigment 46
obtained when acetic acid is applied to copper in presence of air), are among the oldest 47
green pigments ever used [1]. During Antiquity, the Romans especially employed them 48
when painting in fresco [2–5] where the pigments are impregnated on a freshly spread 49
moist lime plaster. This technique is well known to fix the colours on the wall. Calcium 50
carbonate migrates through the surface and forms a protective layer by carbonation. 51
Green earth pigments are highly suitable for this technique as they do not react with the 52
lime plaster[6]. From the Middle Ages onwards, they have also been used in tempera 53
paintings. In the latter, the pigments are ground and mixed with a binder that consists in 54
animal glue or egg yolk mixed with water. In Early Italian paintings, the green earth is 55
mostly used as an underlayer for the flesh [7] or as the bole beneath gold-leaf and on 56
occasion for the draperies [8,9]. In later paintings, in Italy, it has also been observed 57
used for greenery in landscapes [10]. 58
Even though the detection of iron has been used to attest the use of green earth 59
pigments in historical artefacts [2,11–14], this should be analysed carefully since iron is 60
present in other pigments such as iron oxides and other earth pigments. While mobile 61
instruments were developed in the last century for the identification of the structure and 62
composition of different pigments, green earths remain difficult to identify[5,15–17]. 63
Green earth pigments are composed of several minerals whose proportions vary 64
depending on the ore deposit. The most abundant ones are celadonite [18,19] and 65
glauconite [20]. Celadonite is formed in vesicular cavities and fractures of volcanic rocks 66
while glauconite is formed in marine sedimentary deposits [20–22]. Consequently, 67
glauconite is more widely distributed than celadonite. However, the glauconite 68
concentration in the deposit is quite low in comparison to the celadonite one because of 69
their formation processes [20]. Glauconite is more widespread but seems difficult to find; 70
Delamare [5] and Odin [20] reported its occurrence in many locations in France, in 71
Provence or Normandy for instance. Some other authors have identified its presence in 72
Bohemia [15,16,23]. In contrast, celadonite is more easily found. It also can be found in 73
Bohemia [23], in Cyprus and in Monte Baldo near Verona (Italy), this latter deposit is no 74
longer exploited. Furthermore, Cyprus green earth was sold in Smyrna (now Izmir) in 75
Antiquity, leading to a common misinterpretation of its origin [5,21]. 76
The geological literature clearly distinguishes the two minerals from the nature of their 77
deposit. Unfortunately, once extracted and sold as “green earth pigment” their origin 78
becomes difficult to trace, and it becomes even more complicated once the pigment is 79
mixed within the paint with several other compounds. 80
From a mineralogical point of view, celadonite and glauconite are two phyllosilicates 81
from the mica group [21]. They are composed of an aluminium oxide octahedral layer 82
sandwiched between two silicon oxide tetrahedral layers. However, depending on the 83
formation conditions and on the environment of the deposit, substitutions in tetrahedral 84
or octahedral sheets can occur. Aluminium in an octahedral sheet can be replaced by 85
FeIII, FeII or MgII, while silicon is only replaced by aluminium. There are differences in 86
these substitutions between the two minerals. The Si substitution rate is higher in 87
glauconite than in celadonite[18]. Moreover, celadonite contains a larger ratio of divalent 88
ions R2+ (MgII and FeII) than trivalent ions R3+ (AlIII or FeIII). In addition, the celadonite 89
R2+/R3+ ratio is 1:1 while in glauconite, it is about 2:1, and, the FeII/FeIII ratio varies 90
between the two minerals. Ergo, this chemical composition could be a main criterion in 91
the identification of the minerals. 92
Therefore, the identification of celadonite and glauconite in a paint mixture indicates the 93
presence of a green earth. For this purpose, several techniques can be used such as 94
X-ray diffraction (XRD), infrared (IR) spectroscopy, and X-Ray fluorescence (XRF). 95
Nevertheless, despite numerous studies on clayey materials in various fields ranging 96
from physical chemistry to geoscience, mineralogical analyses in the field of cultural 97
heritage are seldom and often limited to the identification only of the generic class of 98
‘green earth’ without any specific details on the mineralogical species present in the 99
artwork [16,24]. This information can however provide further knowledge about the work 100
of painters and their choice of pigment used in relation also to the technique used 101
(aqueous such as a tempera, or oil). Hence the detailed investigation of the pigment 102
composition is highly valuable for research in the field of cultural heritage. 103
In this work, a multi-analytical technique approach is applied to two minerals, eight 104
commercial green earth pigments, and a sample taken in an historical deposit in 2014 105
where celadonite was mined from the Middle Ages to the 20th century, in order to identify 106
their composition. Moreover, these extensive characterisations enable one to provide a 107
protocol for the identification of celadonite and glauconite in artworks with and without 108
sampling. 109
2 Materials and methods
110
2.1 Samples
111
Eleven samples were chosen for this study: two minerals from the geological and 112
mineral gallery of the Musée National d’Histoire Naturelle (MNHN, Paris, France), eight 113
commercial green earth pigments and one green earth sample taken in 2014 from a 114
historical celadonite location in Monte Baldo, near Prà della Stua. Samples were used 115
as received. Sample names and suppliers are listed in Table 1. 116
Table 1: Samples and references analysed
117
Compound Sample Name Supplier Reference
Monte Baldo celadonite Cel_Mon MNHN Villers-sur-mer glauconite Glau_Vil MNHN
Bohemian green earth GE_Boh Kremer Pigmente K40810 Cyprus green earth GE_Cyp Kremer Pigmente K17400 Cyprus blue green earth BGE_Cyp Kremer Pigmente K17410 Russian green earth GE_Rus Kremer Pigmente K11110 Veronese green earth GE_Ver Kremer Pigmente K11000 Brentonico green earth GE_Bren Laverdure 346378 Nicosie green earth GE_Nico Laverdure 346379 Sennelier green earth GE_Sen Sennelier 213 Brentonico green earth GE_Bren_h Historical site
118
2.2 Colorimetric measurements
119
Colorimetric measurements were carried out with a device from Ocean Optics 120
composed of a halogen light source HL-2000, optic fibres mono coils UV-Vis of 400 µm 121
diameter and a spectrophotometer USB 4000. Measurements were obtained in 122
reflection mode with an angle of 30° between the incident light and the collector. The 123
exposure time was 5 ms and 300 scans were averaged. An observer at 2° and 124
illuminant D65_1 were chosen to obtain L*, a*, b* coordinates. 125
2.3 Scanning electron microscopy
126
Energy Dispersive Spectroscopy (EDS) analyses were carried out in a Zeiss Sigma 300 127
SEM equipped with a Bruker Quantax 6030 EDS spectrometer at 20 kV for an 128
acquisition of 500 kcounts. Prior to analyses, each powder sample was dispersed on a 129
stub with double-sided carbon tape and was subsequently coated with a carbon layer by 130
evaporation. Semi quantitative results were calculated using a standardless PB-ZAF 131
method. 132
2.4 X-ray diffraction
133
X-ray powder diffraction (XRD) measurements were conducted on a Bruker D8 134
Advanced diffractometer operated at Cu Kα radiation (λ = 0.15404 nm). XRD patterns 135
were measured using the following parameters: tension of acceleration, 40 kV; current, 136
40 mA; 2θ values ranging from 5° to 70°; step, 0.020° and step time, 0.75 s. 137
Synchrotron powder diffraction patterns of five selected samples (GE_Boh, GE_Cyp, 138
BGE_Cyp; GE_Bren and GE_Bren_h) were collected at the European Synchrotron 139
Radiation Facility (ESRF, Grenoble) on the beamline ID22 [25] at an energy of 31 keV 140
(0.03999 nm wavelength) using the high-resolution multi-analyzer setup [26]. The five 141
samples are mounted as received inside cylindrical borosilicate capillaries (0.9 mm 142
diameter). DIFFRAC.EVA's (Bruker) search/match module, which carries out searches 143
on the PDF4+ (2018) reference database, has been used for phase identification. All 144
analyses of the X-ray powder diffraction patterns were carried out with the FP_Suite 145
software [27]. First, Le Bail refinements were conducted in order to confirm the phase 146
identification. Rietveld refinements were then carried out to obtain the mass proportion 147
of the different crystalline phases in the mixtures. The Inorganic Crystal Structure 148
Database [28] was consulted to obtain the crystal structures of the phases identified. 149
2.5 Mid- and Near-Infrared spectroscopy
150
Mid-infrared spectroscopy was carried out in attenuated total reflectance mode (ATR) on 151
an Agilent Technologies Cary 630 FTIR device equipped with a diamond crystal. 152
Powders were analysed between 650 and 4000 cm-1, with 4 cm-1 of resolution and 64 153
scans. 154
Near-infrared spectroscopy was conducted with one hyperspectral camera (NIR-SWIR) 155
from Specim (Oulu, Finland). Samples were compressed in pellets. The camera was 156
mounted on a rotation stage to acquire the images in push broom technique, i.e. by 157
scanning the painting horizontally and acquiring full spectral information for one vertical 158
line on the pellets/paintings at a time. The spectral range is 1000 to 2500 nm with 159
280 wavelength channels and a spectral sampling of 12 nm. During the investigation, 160
diffuse illumination was provided by one 20 W halogen lamp, placed at a distance of 161
0.4 m. For the pigment pellets, the OLES56 (Specim, focal length 56 mm) was used with 162
a lateral resolution of ca. 130 μm. In this zoom configuration (distance camera-painting 163
of 40 cm), the acquisition parameters were 20 ms integration time, 4 fps and 0.07°.s-1 164
rotation speed. For the painting by Nicolas Poussin: a first objective (OLES30, Specim, 165
focal length 30 mm) was used to image the entire painting with a lateral resolution of 166
approx. 1.5 mm; three scans were acquired with 50 ms integration time, 6 fps (frames 167
per second) and 0.01°.s-1 rotation speed. The OLES56 (Specim, focal length 56 mm) 168
was also used on the selected area with a lateral resolution of ca. 130 μm. In this “zoom” 169
configuration (distance camera-painting of 40 cm), the acquisition parameters were 170
200 ms for the integration time, 4 fps and 0.07°.s-1 for the rotation speed. 171
The data was normalized with dark and bright field images using the Specim plug-in in 172
ENVI (Harris Corporation, Melbourne, Florida, USA). The spectra were averaged on an 173
area of 4x4 pixels. 174
2.6 Raman spectroscopy
175
Raman spectroscopy was used as a complementary tool to identify the organic 176
components in three pigments. An Invia Renishaw spectrometer coupled with a Leica 177
microscope equipped with a 50× objective was used to acquire the Raman spectra. 178
Monochromatic excitation was obtained with a green Nd:YAG laser (532 nm) or red 179
diode laser (785 nm) and the corresponding 1800 l.mm-1 or 1200 l.mm-1 grating were 180
used to disperse the signal onto the CCD detector. Laser power, exposure time, and 181
accumulations were adapted depending on the sample. 182
2.7 Mössbauer spectroscopy
183
Mössbauer spectra were recorded at room temperature on a homemade Mössbauer 184
spectrometer operating in a constant acceleration mode in transmission geometry. The 185
isomer shift values were referenced against that of a room temperature metallic iron foil. 186
Analysis of the data was carried out with the software WMOSS Mössbauer Spectral
187
Analysis Software (www.wmoss.org, 2012‐2013 Web research, Edina) and with a
188
homemade program [60]. A Lorentzian profile was considered. The recoil-free fraction was
189
assumed to be independent of the iron location and state, and accordingly, relative content
190
of iron atoms corresponds to the relative area of subspectra.
3 Results and discussion
192
3.1 Colorimetric measurements
193
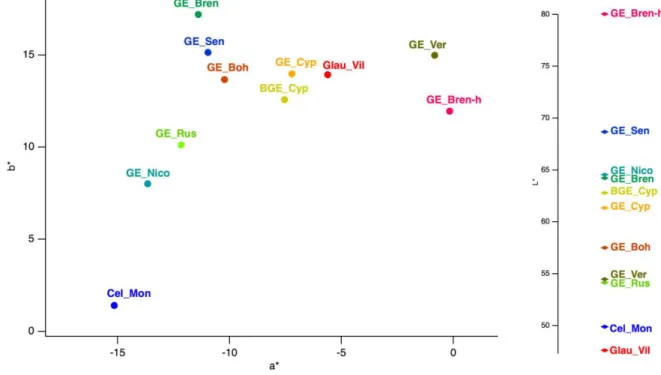
Colorimetric measurements were performed by considering the CIE L*a*b* colour space. 194
L* is the lightness from black (0) to white (100). a* varies from green (-) to red (+) 195
whereas b* varies between blue (-) and yellow (+). Except for GE_Ver and GE_Bren-h 196
samples, all other green earths presented values of a* varying between -15 and -5, b* 197
between 0 and 18 and L* values is in the range 45-70 (Figure 1) matching, indeed, with 198
the green part of the chromatic disc. GE_Bren_h and GE_Ver have a beige colour. 199
200
Figure 1: Green earth colour identification in the L*a*b* space
201
Figure 2 depicts on the left, the visible reflectance spectra of the different samples; we 202
also indicate, on the right of the figure, log(1/R) to make the transition bands associated 203
to the d-d ligand-field transitions responsible of the green colour more visible. 204
205
Figure 2: Left: Visible spectra of green earths from 400 to 1000 nm; right: Log(1/R) of the
206
different green earths from 400 to 1000 nm
207 208
Assignments are proposed according to Hradil [23]; nevertheless, these transitions are 209
not specific to celadonite nor glauconite, as Hradil also observed. 210
The commercial pigments can be separated into two different groups: 211
- GE_Bren, GE_Sen, GE_Nico, GE_Ver, and GE_Bren-h. 212
- The others, which exhibit characteristic features of celadonite/glauconite. 213
214
3.2 Scanning electron microscopy (SEM)
215
SEM micrographs are illustrated in Figure 3. As for natural minerals, different 216
morphologies have been observed by SEM. 217
218
Figure 3: SEM photos of green earths
219
Cel_Mon and Glau_Vil have the morphology corresponding to celadonite and glauconite 220
respectively, as the literature describes them. Celadonite is composed of rectangular 221
crystals in batten form, which match GE_Cyp according to H. Bearat [29], Moretto [17] 222
and Buckley [18]. Glauconite is less crystalized with a rosette-shape [17,29], it could be 223
attributed to GE_Rus and GE_Boh. On the contrary, GE-Bren, GE_Nico and GE_Sen 224
particles appear flatter and bigger. Their layers seem well compacted compared to the 225
other green earths, and do not look like phyllosilicates. 226
3.3 XRD measurements
227
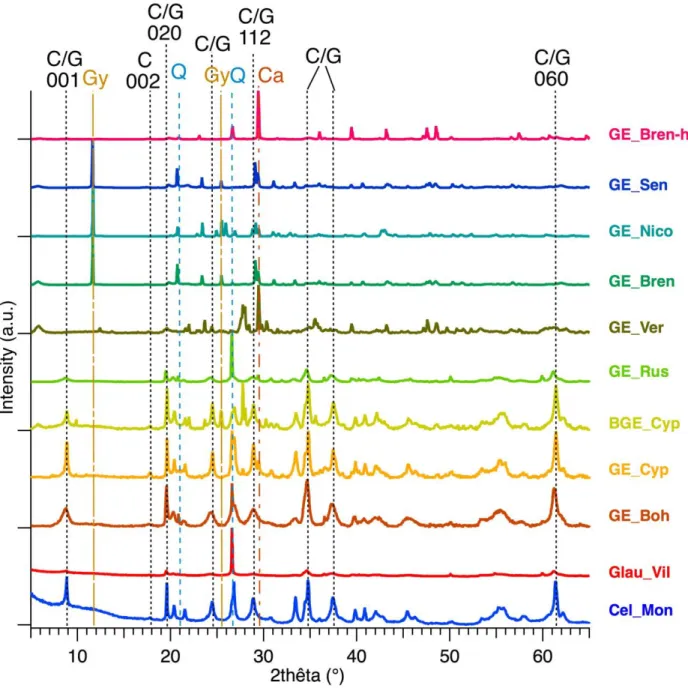
Figure 4 shows the XRD patterns collected with a laboratory diffractometer for the whole 228
set of the samples. 229
230
Figure 4: XRD laboratory patterns of two references from mineralogy gallery (Cel_Mon
231
and Glau_Vil), eight commercial green earths and one sample form Brentonico. Most
intense diffraction peaks are attributed with: C: Celadonite, G: Glauconite, Gy: Gypsum,
233
Q: Quartz and Ca: Calcite
234
Even though existing databases (EVA, Bruker) in XRD allow the identification of 235
crystalline phases (Table 2), and that some studies [30] identify celadonite from a partial 236
pattern, which is debatable, it seems more complicated since the targeted phases are 237
very close from a crystallographic point of view. Moreover, the presence of a mixture of 238
phases in natural samples makes the assignment even more difficult. 239
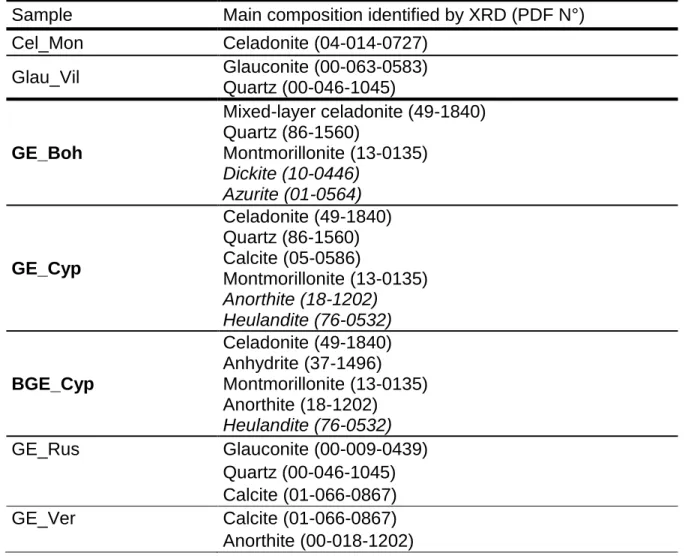
Table 2: Mineralogical compositions of the green earths obtained from XRD data (in
240
bold, synchrotron data were used to identify the phases of these samples. In italic, minor
241
phases)
242
Sample Main composition identified by XRD (PDF N°) Cel_Mon Celadonite (04-014-0727) Glau_Vil Glauconite (00-063-0583) Quartz (00-046-1045) GE_Boh Mixed-layer celadonite (49-1840) Quartz (86-1560) Montmorillonite (13-0135) Dickite (10-0446) Azurite (01-0564) GE_Cyp Celadonite (49-1840) Quartz (86-1560) Calcite (05-0586) Montmorillonite (13-0135) Anorthite (18-1202) Heulandite (76-0532) BGE_Cyp Celadonite (49-1840) Anhydrite (37-1496) Montmorillonite (13-0135) Anorthite (18-1202) Heulandite (76-0532) GE_Rus Glauconite (00-009-0439) Quartz (00-046-1045) Calcite (01-066-0867) GE_Ver Calcite (01-066-0867) Anorthite (00-018-1202)
GE_Bren Gypsum (05-0586) Calcite (05-0586) Montmorillonite (13-0135) Quartz (86-1560) Muscovite (76-0668) Anhydrite (37-1496) GE_Nico Gypsum (00-021-0816) Calcite (01-066-0867) Quartz (00-046-1045) Montmorillonite ? (00-029-1499) GE_Sen Gypsum (00-021-0816) Calcite (01-066-0867) Quartz (00-046-1045) Montmorillonite ? (00-029-1499) Vanadium borate ? (04-015-9917) GE_Bren-h Calcite (05-0586) Quartz (86-1560) Montmorillonite (13-0135) Muscovite (76-0668) Orthoclase (75-1190) 243
According to the literature, the value of the d060 is crucial for the distinction between 244
celadonite or glauconite. Indeed, for d060 < 0.151 nm, dioctahedral celadonite is present 245
and for d060 > 0.151 nm, trioctahedral glauconite is identified [19,20]. Based on this 246
parameter, Ge_Cyp and BGE_Cyp earths are attributed to celadonite [15,16]. GE_Boh 247
and GE_Rus match with glauconite. 248
The XRD patterns of GE_Ver, GE_Nico, GE_Bren, GE_Sen and GE_Bren-h do not 249
show any reflexion of celadonite or glauconite, but more those of montmorillonite, 250
gypsum, calcite and/or quartz. GE_Bren_h is mainly composed of smectites. 251
Because the GE_Boh powder presents broader diffraction peaks than the GE_Cyp and 252
BGE_Cyp powders, indicating an ill-ordered structure, the identification of the clayey 253
mica is more challenging. Particular attention has already been paid to the green earth 254
mined in the Bohemia deposit [16,18,23]. These earlier studies showed that the samples 255
from Bohemia have characteristics, which differ from pure celadonites or pure 256
glauconites and have to be described as mixed-layer celadonites. Here, the position of 257
the d060 diffraction line, equal to 0.1512 nm, is close to that published by Hradil et al. 258
[16], for an interlayered celadonite/smectite sample: 0.1511 nm. 259
In order to confirm phase identification, synchrotron powder diffraction was used (see 260
Experimental); the whole pattern fitting of synchrotron data has been performed on the 261
basis of the crystallographic data (lattice and structural parameters) found in the PDF4+ 262
and ICSD databases for the respective crystalline phases. In a first step, the diffraction 263
patterns were analyzed by Le Bail refinements (which does not require any structural 264
information except approximate unit cell parameters). For the GE_Boh, the lattice 265
parameters of celadonite were used because no mineral is referenced as “mixed-layer 266
celadonite” or “interlayered celadonite/smectite” in the PDF4+ database. The 267
background was estimated by linear interpolation between selected points between 268
Bragg peaks. An isotropic pseudo-Voigt function was used to describe the peak shapes, 269
except for celadonite, which shows a strong anisotropic broadening. In this latter case, 270
the Thompson-Cox-Hastings function with spherical harmonics expansion was 271
implemented to account for the anisotropic peak broadening. Globally, the reliability 272
factors reached for the main phases were satisfactory and the main residuals on the 273
difference line resulted mainly from profile errors and from the presence of some minor 274
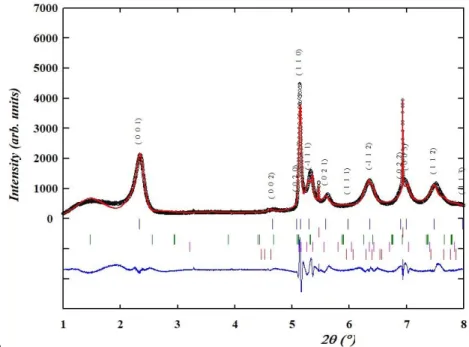
peaks, which are still unidentified (Figure 5). In a second step, we conducted Rietveld 275
refinements: an overall isotropic atomic displacement parameter, common to all atoms 276
of a given phase, was refined and the atomic positions and occupancy parameters were 277
kept fixed at the values found in the references. In the ICSD database, three entries can 278
be found for celadonite and we chose this corresponding to a Fe-rich celadonite with the 279
composition K(Fe1.51Mg0.41Al0.05)((Si3.94Al0.06)O10)(OH)2. In the final Rietveld refinement, 280
profile parameters and structural parameters have been simultaneously refined. Powder 281
diffraction pattern of the GE_Boh mineral was not treated by the Rietveld method 282
because we have given up on determining the crystal structure of the mixed-layer 283
celadonite because of the presence of other crystalline phases in the powder. Moreover, 284
minor phases (estimated to less than 1% in mass) were not taken into account in the 285
Rietveld refinements. Quantitative phase analysis was derived from the scale factors to 286
assess the pigments composition. The mass proportions are summarized in Table 3 and 287
Figure 6 shows the Rietveld refinement results for samples GE_Cyp and GE_Bren. 288
a.
b.
290
Figure 5: a. (top) Le Bail refinement result for sample GE_Boh (experimental pattern:
291
data points, calculated pattern: red full line, difference: blue full line. The vertical ticks
292
indicate the Bragg positions for celadonite, quartz, montmorillonite, dickite and azurite
293
respectively), Rwp = 18 % (chi2=9.8). The unit-cell parameters obtained for celadonite
294
are: a = 5.2182(11) Å, b = 9.0312(17) Å, c = 10.0180(43) Å, = 100.76(4)°. b. (bottom)
295
Strong hkl-dependent anisotropy of the diffraction profiles of celadonite: see for example
296
broadening of (001) and (110) Bragg reflections.
297 298
In the green earths analysed at ESRF, compositions are shown in the Table 3. 299
Table 3: Phase quantification by Rietveld refinements (%wt) Standard deviations of the
300
refined parameters were scaled with the Berar factor [31].
301 Samples Cel a d o n ite M o n tm o ri llo n ite M u s c o v ite Q u a rtz Cal c it e G y p s u m An h y d ri te An o rth ite
GE_Cyp 70(3) 16(2) 8(1) 6(1) TBV_Cyp 66(3) 18(1) 5.0(1) 11(1) GE_Bren 33(1) 1.0(3) 21(1) 45(2) GE_Bren_h 11.2(8) 5.8(6) 18(1) 65(2) 302 a. 303
b.
304
Figure 6: Rietveld refinement results (experimental pattern: data points, calculated
305
pattern: red full line, difference: blue full line) for samples GE-Cyp (a, top), Rwp = 32 %
306
(Chi2=16.2). The vertical ticks indicate the Bragg positions for celadonite, calcite, quartz
307
and montmorillonite respectively and GE_Bren (b, bottom), Rwp = 25 % (chi2=15.2).
308
Bragg positions for gypsum, calcite, celadonite, quartz and montmorillonite, respectively.
309
3.4 SEM-EDS
310
EDS results are presented in Erreur ! Source du renvoi introuvable.. Celadonite and 311
glauconite can be distinguished thanks to their chemical composition. 312
313 314 315 316
Table 4: EDS results
317
318 319
Different criteria have been reported in the literature and are listed in the Table 4. 320
Table 4: Identification of celadonite, glauconite and ferroceladonite in the literature
321
References Celadonite Glauconite Ferroceladonite Ospitali, 2008 [15] Si > Mg > Al Si > Al> Mg Si > Mg ~ Al Moretto, 2011 [17] Si/Al ≥ 10 Si/Al < 10
Si/Mg < 10 Si/Mg ≥ 10 Si/K ≤ 5 Si/K > 5 Mg/Al > 1 Mg/Al < 1
Hradil, 2011 [16] 1 < K/(Si/Al) < 1.5 K/(Si/Al) ~ 2 322
The references Cel_Mon and Glau_Vil confirm the attribution parameters of Ospitali and 323
Moretto but that of Hradil does not seem applicable to the samples, their values are too 324
high in comparison to the described ones. They are attributed to celadonite and 325
glauconite respectively. 326
GE_Cyp is therefore attributed to celadonite with Ospitali criteria. GE_Boh, GE_Rus are 327
mainly composed of glauconite. The presence of smectite minerals, such as 328 Samples %mol Si Mg Al K Fe Na Ca P S Ti Cl Cu Sr Ba Co Cel_Mon 20.94 3.81 0.63 5.75 7.82 Glau_Vil 16.2 2.01 4.03 3.16 5.36 0.37 0.08 GE_Boh 20.80 2.21 5.06 4.03 5.87 0.54 0.08 0.08 0.14 GE_Cyp 16.74 4.35 2.30 2.33 5.97 0.79 1.68 0.24 0.19 0.24 0.05 BGE_Cyp 19.22 2.72 2.97 2.57 4.23 0.58 0.78 0.29 0.26 GE_Rus 20.46 1.46 3.64 3.20 8.30 0.19 1.48 0.68 2.20 4.25 GE_Ver 16.91 4.31 4.40 0.70 3.49 0.96 5.55 0.06 0.18 GE_Bren 6.73 0.58 3.14 0.51 8.27 0.36 7.76 0.12 10.24 0.64 2.74 0.50 12.16 14.81 GE_Nico 0.00 0.00 0.00 11.17 8.09 8.85 0.49 GE_Sen 8.09 0.45 2.82 0.16 0.90 0.08 8.07 0.02 3.62 0.14 0.07 GE_Bren-h 17.94 0.95 3.86 0.86 0.88 0.21 5.72 0.17 0.03
montmorillonite, does not significantly affect the ratio reported above since the decrease 329
in potassium content is offset by the increase in aluminium. 330
With regard to BGE_Cyp and GE_Ver, they could be identified as ferroceladonite as 331
they have the same quantity of Mg and Al, however, GE_Ver might only contain 332
smectite, as the presence of iron that could be iron (III) oxide, also matches with its 333
brownish colour. GE_Bren-h, which is quite similar in aspect to GE_Ver, might also 334
contain a smectite as it contains a small amount of iron, which could be similar to 335
GE_Ver. 336
Moreover, GE_Bren, GE_Nico and GE_Sen also have a weak presence of phyllosilicate 337
atoms in comparison to sulphur and calcium, which correspond to calcite and gypsum. A 338
low content in Ba is consistent with barite for GE_Bren and GE_Nico. The unusual 339
occurrence of chlorine in two samples, GE_Bren and GE_Sen, could be due to the 340
addition of green dyes such as chlorinated Cu phtalocyanine “phtalo green”, or 341
triarylmethane dye “malachite green”, as has already been reported in the literature on 342
others pigments [15], although no mention could be found in the suppliers’ data sheets. 343
The composition of GE_Nico contains Co indicating the probable presence of cobalt 344
blue. 345
3.5 Near infrared and infrared spectroscopy
346
Figure 7 depicted the FT-IR spectra of the different samples. 347
348
Figure 7: mid-IR reflectance spectra with the main celadonite, calcium, and gypsum
349
attributions in dotted lines (resp. blue, grey and ochre).
350
Information related to iron and other metallic cation interactions with oxygen can be 351
drawn from the OH stretching region [32,33] (3000-3600 cm-1) and absorption bands in 352
the 650 and 900 cm-1 range, which assignments are detailed in Table 5. 353
The presence of three bands in the regions 3500-3600 cm-1 (3534, 3555 and 3601 cm-1) 354
characteristic of the stretching vibrations of the hydroxyl groups correlated to the cations 355
in the octahedral sheet, and 950-1075 cm-1 related to the stretching vibrations [15–17] of 356
the tetrahedral sheets is typical of celadonite. A shoulder around 1110 cm-1 is observed 357
also for all glauconite samples. This band is assigned to a decrease in the symmetry of 358
the structure of the tetrahedral silicate layers due to the substitution of silicon ions by 359
aluminium ions [34,35]. Other bands at 842, 798, 746 and 673 cm-1 are attributed to the 360
OH bending modes bound to octahedral cations in celadonite [15–17,36]. GE_Cyp and 361
BGE_Cyp, are therefore attributed to celadonite while GE_Rus, GE_Boh to glauconite. 362
GE_Ver, GE_Sen, GE_Nico, GE_Bren and GE_Bren-h contain more gypsum, calcite 363
and smectite. Details on the different bands and their attributions are depicted in 364
Table 5. 365
In GE_Bren, GE_Nico and GE_Senn, bands at 874 and 712 cm-1 are a signature of 366
calcite [37]. 367
Gypsum yields to a wide band between 1100 and 1200 cm-1 due to the presence of 368
sulphate ions [37], and calcite at 1430 cm-1 due to that of carbonate ions. 369
Regarding more specifically GE_Bren, GE_Sen and GE_Nico commercial green earths, 370
(Figure 7), the presence of bands at 1793 and 1618 cm-1 could also be respectively 371
associated with the presence of cyclic anhydride (1800-1760) and the scissoring in 372
plane of primary amine (N-H) (1650-1590) [38]. Moreover, for these green earths, bands 373
within the 650-900 cm-1 range could correspond to C=C stretching of aromatic rings in 374
line with Csp2-H out of plane bending bands. They are located around 801 cm-1 and 375
671 cm-1, which suggest rather a metal coordination with the aromatic ring. These bands 376
could be the signature of green pigmosol pigment. 377
Table 5: Main bands (cm-1) in green earths mid-infrared spectra and attributions
379
Samples
Attribution Cel_Mon Glau_Vil GE_Boh GE_Cyp BGE_Cyp GE_Rus GE_Ver GE_Bren GE_Nico GE_Sen GE_Bren-h
669.06 669.06 669.1 672.9 672.9 669.1 668.2 668.2 668.2 668.2 668.2 OH bending vibration
694.3
712 712 712 712 712 CaCO3
745.47 746 745 octahedra cation - OH bending vibration
779
797.65 799.6 798 793 795 794 797 lattice deformation and SiO bending band
816.3 819.2 814 FeFeOH bending band
832.8 bending of OH bounded to octahedric cation
842 839 OH bending with octahedric cation, AlOMgOH
848
875.1 874.2 872.3 874.2 872.3 CaCO3
905.9 bending of OH bounded to octahedric cation
915 920.8 914 914 OH bending with octahedric cation, AlOAlOH
946.74 946.74 959 946.9 947 957.1 SiO4 stretching in plane
968.3 969.2 SiO distortion in plane
989 982.3 989.7 SiOSi(Al)
1011 1002 1003.7 1001.8 SO42- gypsum
1069.7 1076.4 1071 1071.7 SiO distortion in plane
1079.1 1081.1 SiO stretching; SiO distortion perpendicular to
plane influenced by substitution
1092
1108.1 1108 1104 SO42- gypsum
1165
1430.5 1430 1430 1430.5 1425 CO32- asymetric stretching
1617.9 1617.9 1617.9 CaCO3 hydration water
1635.6 1635.6 1636.5 1636.5 1635.6 1635.6 OH torsion; water in silicates
1681.2 1685 1680.3 CO3- asymetric stretching
1794 1794 1793.1 1793.1 CaCO3 hydration water
3395.1 3400 3400 Water in gypsum
3529.3 3529.3 Water in gypsum
3529.8 3534 3534 3532.1 3538 OH stretching with Fe3+OFe3+
3555.9 3555.9 3558.2 3558.2 3557.2 3558.2 OH stretching with AlOFe2+, MgOFe3+
3600.6 36006.2 3598.3 3602 3602 OH stretching with AlOMg
382
Figure 8: NIR spectra of green earths and main band attributions
383
With regard to the near infrared region (Figure 8), two sets of pigments could be 384
distinguished. The first set gathered pigments containing celadonite or glauconite which 385
display four bands [36] in the 4000-4500 cm-1 range (2200-2500 nm): celadonite has 386
vibrations around 4430 cm-1, 4344 cm-1, 4259 cm-1 and 4049 cm-1 corresponding for the 387
first three to Al-O-Fe3+ or Al-O-Mg, Fe3+-O-Fe3+ and Mg-O-Mg-O-Mg hydroxyl 388
combinations, respectively. Those bands were found in GE_Cyp and BGE_Cyp. Bands 389
at 4316 cm-1, 4227 cm-1 corresponding respectively to Fe3+-O-Fe3+ and Fe2+-O-Fe2+ -O-390
Fe2+ hydroxyl combination vibrations [36] attributed to glauconite were identified in 391
GE_Rus and in GE_Boh. The water combination band is identifiable for all samples 392
around 5236 cm-1. 393
The second group (Figure 8) has absorption bands related to either gypsum (GE_Bren, 394
GE_Nico and GE_Sen) or calcite (GE_Ver and GE_Bren-h) depending on their main 395
phases. Gypsum displays intense bands [39] around 4608, 5140, 5730 and 6700 cm-1 396
clearly visible on the spectra of green gypsum-rich pigments (GE_Nico, GE_Bren, and 397
GE_Sen). 398
Unlike gypsum, calcite presence is more difficult to assess by near infrared absorption 399
only due to a superimposition of its sharper band with green earth pigments absorption 400
region. 401
Table 6: SWIR Near-infrared main band attributions
402
Samples Attribution
GE-Boh GE_Cyp BGE_Cyp GE-Rus GE-Ver GE_Bren GE_Nico GE_Sen GE_Bren-h nm cm-1 nm cm-1 nm cm-1 nm cm-1 nm cm-1 nm cm-1 nm cm-1 nm cm-1 nm cm-1 1410 7092 1410 7092 1410 7092 1.41 6 7062 Smectite (1920 nm) water harmonique [36] 1446 6916 1446 6916 1446 6916 1446 6916 Gypsum (1446 nm) combinaisons [39,40] 1490 6711 1490 6711 1490 6711 1490 6711 Gypsum (1490 nm) combinaisons [39,40] 1751 5711 1751 5711 1751 5711 Gypsum (1751 nm) hydroxyle/water [39,40] 1910 5236 1910 5236 1910 5236 1910 5236 1910 5236 1910 5236 1910 5236 1910 5236 Smectite (1920 nm) water combinaison [36] 1943 5147 1943 5147 1943 5147 Gypsum (1944 nm) water [39,40] 1983 5043 1988 5030 1983 5043 Calcite (1995 nm) v1+3v3 [40–42] 2170 4608 2170 4608 2170 4608 Gypsum (2170 nm) 3v3 S-O ou OH/H2O[39,40]
2208 4529 2208 4529 2208 4529 Calcite (2171 nm) 2v1+2v3 [40–42] 2219 4507 AlOAl (Montmorillonite) [36] 2258 4429 2253 4439 2258 4429 AlOFe3+ (ou Mg) (celadonite) [36] 2272 4401 2272 4401 2272 4401 Calcite (2265 nm) [40– 42] 2303 4342 2303 4342 2303 4342 Fe3+OFe3+ (celadonite) [36] 2314 4322 2314 4322 Fe3+OFe3+ (glauconite) [36] 2348 4259 2353 4250 2348 4259 MgOMgOMg (celadonite) [36] 2364 4230 2364 4230 Fe2+OFe2+OFe2+ (glauconite) [36] 2448 4085 2448 4085 additional band (glauconite) [36] 2470 4049 2470 4049 additional band (celadonite) [36] 2476 4039 additional band (glauconite) [36]
2503 3995 additional band (glauconite) [36] 2532 3949 2532 3949 2532 3949 2532 3949 2532 3949 Calcite (2532 nm) v1+2v3 [40–42] 403 404
3.6 Raman
406
Raman spectroscopy was also carried out as a complementary tool to identify the 407
presence of organic additives (table S1). 408
In two commercial green earths GE_Sen and GE_Bren, the signatures of an organic 409
pigment were observed. They were attributed to pigmosol green, a copper chlorinated 410
phtalocyanine, since they matched the reported values of Duran [43]. 411
In GE_Nico were found bands associated with cobalt blue Co-O vibrations, which is in 412
agreement with the presence of cobalt in EDS analysis. In this sample, the presence of 413
barite and hematite was also identified. 414
3.7 Mössbauer spectroscopy
415
Mössbauer spectroscopy is an appropriate tool to investigate iron compounds and has 416
been used to investigate soil materials and minerals [44,45]. Five samples were 417
investigated, the two minerals from the MNHN, two commercial green earth pigments, 418
namely GE_Boh and GE Cyp and the sample from the historical location GE_Bren-h. 419
Only GE_Cyp shows large background absorption suggesting the presence of a 420
magnetic iron species such as iron oxide/hydroxide (Figure S1). This contribution 421
amounts to 27±5 % of the total iron content and was subtracted. 422
Table 7: Mössbauer spectral parameters of investigated samples. Uncertainties are
423
indicated in parentheses
424
Sample Doublet δ (mm.s-1) ΔEQ (mm.s-1) Γ (mm.s-1) % %Total
GE_Boh A 0.34(1) 0.40(2) 0.46(2) 68(1) 87(3) B 0.33(4) 0.99(6) 0.44(6) 19(2) C 1.24(4) 2.55(8) 0.23(9) 5(2) 13(4) D 0.93(9) 2.3(2) 0.6(2) 8(2) GE_Cyp A 0.32(1) 0.35(2) 0.36(2) 76(1) 89(3)
B 0.39(4) 1.13(7) 0.35(8) 13(2) C 1.0(1) 2.55(8) 0.3(1) 3(2) 11(5) D 1.0(1) 1.7(3) 0.5(3) 8(3) GE_Bren_h A 0.34(3) 0.44(4) 0.49(6) 67(4) 81(8) B 0.33(7) 1.2(2) 0.4(2) 13(4) C 1.1(1) 2.6(2) 0.7(3) 19(5) 19(5) 425 5 % GE_Boh 5 % GE_Cyp -4 -2 0 2 4
Velocity (mm s
–1)
1 % GE_Bren_hR
e
la
ti
v
e
T
ra
n
s
m
is
s
io
n
426Figure 9: Mössbauer spectra (hatched bars) recorded on GE_Boh (top), GE_Cyp
427
(middle) and GE_Bren_h (bottom) at room temperature. Theoretical spectra are
428
superimposed as solid black lines and the deconvolutions are shown above with sites a
429
in red, sites b in orange, sites c in dark blue and sites d in light blue.
430
The spectra of Glau_Vil and Cel_Mon are reproduced in Figures S2 and S3, 431
respectively. As expected, that of Glau_Vil is reminiscent of those previously reported for 432
glauconite [46–50], whereas that of Cel_Mon is very similar to those recorded for 433
celadonite [51–53]. The spectra of GE_Boh and GE_Cyp are reproduced in Figure 9. 434
The comparison with those of Glau_Vil and Cel_Mon (see Figures S2 and S3) suggests 435
that glauconite and celadonite are the main contributors to the Mössbauer spectra of 436
these green earth pigments, respectively. Spectra were reproduced assuming four 437
doublets, labelled a-d. Parameters are listed in Table 7 and Table S1. Doublets c and d 438
are unambiguously associated to ferrous sites according to the isomer shift values. 439
Doublets a and b are assigned to ferric sites. Similar parameters were previously 440
reported in the literature for glauconites [48,54] and celadonites [45,52]. 441
Three doublets were considered to reproduce the Mössbauer spectrum of GE_Bren_h 442
(Figure 9 and Table 7). This historical sample is the sample that presents the highest 443
Fe2+ content among the five samples investigated. The nuclear parameters are close to 444
those determined for montmorillonite [45,55]. However, based on the nuclear 445
parameters of site c, other iron phyllosilicates such as illite cannot be excluded. Note 446
that the large line-width may account for several ferrous sites. It should also be noticed 447
that the ferric site b presents the largest quadrupole splitting determined within the 448
investigated series. 449
3.8 Appraisal of the analysis techniques
450
The characterization of commercial pigments sold as green earth by different techniques 451
has made it possible to recognize the presence or absence of celadonite or glauconite in 452
certain pigments. The identifications are summarised in Table 8 which show that 453
GE_Cyp and BGE_Cyp contain celadonite, BE_Boh, GE_Rus contain glauconite and 454
that the other pigments contain mainly gypsum and calcite. As some authors [15] have 455
observed, the name of the pigment does not always correspond to the location of the 456
deposit. GE_Bren-h composition, without either of the two minerals, also shows that 457
deposits can evolve over the period in which they were mined as it is observed by 458
Grissom [21]. 459
Table 8: Summary of the green earth identification by the different techniques
461
Echantillons XRD EDS mid IR SWIR UV-Vis Mössbauer Bilan
GE_Boh
Mixed-layer celadonite? Quartz
Montmorillonite
Glauconite Glauconite Glauconite Glauconite ? Glauconite Glauconite
or Mixed-layer celadonite ?
Montmorillonite Quartz
Montmorillonite
GE_Cyp Celadonite Celadonite Celadonite Celadonite Glauconite ? Celadonite Celadonite
Quartz Montmorillonite Montmorillonite
Montmorillonite Quartz
Calcite Calcite
BGE_Cyp Celadonite Ferroceladonite Celadonite Celadonite Glauconite ? Celadonite
Montmorillonite Gypsum Montmorillonite Montmorillonite
Anorthite Anorthite
Anhydrite Anhydrite
GE_Rus Glauconite Glauconite Glauconite Glauconite Glauconite ? Glauconite
Quartz Montmorillonite Montmorillonite
Calcite Quartz
Calcite ?
GE_Ver Calcite Calcite Montmorillonite Gypsum x Gypsum
Anorthite Montmorillonite Calcite Montmorillonite Calcite
Anorthite
GE_Bren Gypsum Gypsum Montmorillonite Calcite Glauconite ? Pigmosol green
Calcite Calcite Calcite Gypsum Montmorillonite
Montmorillonite
Chlorinated
compound Gypsum Montmorillonite Calcite
Muscovite Gypsum
GE_Nico Gypsum Gypsum Montmorillonite Calcite Celadonite ? Hematite
Calcite Calcite Calcite Gypsum Cobalt blue
Quartz Cobalt compound Gypsum Montmorillonite Calcite
Montmorillonite ? Gypsum
GE_Sen Gypsum Calcite Montmorillonite Calcite Glauconite ? Pigmosol green
Quartz Gypsum Calcite Gypsum Montmorillonite
Montmorillonite ? Gypsum Montmorillonite Calcite
Vanadium borate ? Quartz
GE_Bren-h Calcite Gypsum Gypsum Gypsum Gypsum Montmorillonite ? Montmorillonite
Quartz Calcite Calcite Calcite Calcite
Montmorillonite Gypsum
Muscovite Othtoclase
The main aim of these characterisations was to define a methodology in order to be able 462
to identify the minerals in paintings. The accurate in-situ identification of green earth is 463
not easy and the difference between celadonite and glauconite is never considered for 464
paintings (it is more for archeological remains for which cross-sections are more 465
frequently analysed). However such a distinction is now possible, and it is also possible 466
that a specific use of one or the other mineral by an artist can be highlighted in future 467
analyses. Different reasons would explain such a specific use: primarily the origin of the 468
deposit available at the time and in the region would have been taken into consideration. 469
Their various composition, shape, particle-size and hue, would also influence their 470
behaviour with binding media: for instance more or less hydrophilic, different behaviours 471
with water-based media and oils. In summary, for in-situ analysis, as reported 472
previously, several studies have used diverse methods to identify celadonite and 473
glauconite. In the case of modern pigments or that of complex mixtures such 474
identification, and distinction between the two minerals, did not seem relevant: 475
If spectrophotocolorimetry and related UV-Visible measurements confirm 476
accurately the presence of green earth, it does not allow one to discriminate 477
glauconite/celadonite. Various earlier studies have used the UV-Visible spectra 478
[17] to identify celadonite and glauconite, this technique was sufficient to 479
discriminate the examples they analysed and it is maybe true for pure pigments 480
but not in more complex cases. However, electronic transitions are seen thanks 481
to absorption bands, i.e. minima in the reflectance spectra. Moreover, in most of 482
the cases, a mixture of phases and addition of organic dyes to enhance the 483
colour are present. The identification of a pigment mixture by their reflectance 484
spectra is sometimes possible but not straightforward as the reflectance spectrum 485
of a mixture of pigments is not the simple combination of the reflectance spectrum 486
of each pigment. 487
NIR is a very convenient method to use for the in-situ identification of green 488
earths. When no signal from other paint components (such as oil) overlaps the 489
characteristic bands, it is possible to distinguish celadonite from glauconite as 490
mentioned in the NIR section. 491
Raman microspectroscopy is helpful to focus on specific sample location and 492
hence, being able to evidence additives presence, although Raman has also be 493
used to identify celadonite and glauconite [15]. 494
The (001) and the (060) reflexions are respectively around 8 and 60° in 2θ, and 495
since they are the main reflections that enable to distinguish celadonite and 496
glauconite, the mobile XRD equipment which is limited in 2θ region going from 497
12° to 45 °, allows only a difficult and partial identification of the minerals. 498
Mobile XRF cannot quantify accurately light cations such as aluminium, 499
magnesium and sodium, especially in the case of complex paint layer stacks. 500
Therefore it is useless for the distinction between celadonite and glauconite. 501
In the case of sampling, the identification becomes less complex. 502
XRD and SEM-EDS can be claimed as the primary techniques that allow a 503
precise identification of both earths due to specific diffraction pattern, shapes, and 504
elemental composition. 505
IR spectroscopy is also an appropriate technique to distinguish between 506
celadonite and glauconite due to some specific bands and a better spectrum 507
resolution for celadonite than glauconite. 508
Mössbauer spectroscopy can be used to quantify the ratio of Fe2+/Fe3+. 509
3.9 Application in context
510
As an application case study, we present here the non-invasive investigation of the 511
composition of green pigments used by Nicolas Poussin in his painting, Bacchanales 512
d’enfants, which hangs in the Galleria Nazionale d’Arte Antica (GNAA), Rome. 513
Figure 10: Bacchanales d’enfants, 56 cm x 76 cm, tempera, Nicolas Poussin, 1626,
515
Galleria Nazionale d’Arte Antica (GNAA), Rome, NIR analysed zone in blue: the garland
516
Figure 11 shows the NIR spectra of the green garland (highlighted in 517
518
Figure 10) compared to reference samples and to two green earths attributed to 519
celadonite and glauconite. The positions of the bands at 2258, 2303 and 2353 nm match 520
better with the positions for the celadonite (2258, 2303 and 2353 nm) than the 521
glauconite (2314 and 2363 nm). Thus, the spectrum of the garland part can be 522
superimposed mainly onto the one of Cel_Mon and GE-Cyp. Even if the application to a 523
painting is quite complex, this part of the Bacchanales d’enfants seems to provide a 524
fairly simple NIR spectrum, without gesso, oil or others pigment interaction bands. 525
Therefore, it is possible to identify the pigment used in a tempera painting. In the present 526
case Nicolas Poussin used a green earth originated from a celadonite deposit. 527
Figure 11: NIR spectrum of a garland zone in the painting Bacchanales d’enfants by
529
Nicolas Poussin (
530
Figure 10) is compared with reflectance spectra of GE_Cyp and GE_Boh and the
531
reference celadonite (Cel_Mon) and glauconite (Glau_Vil)
532
4 Conclusion
533
Eight commercial green pigments sold as green earths were characterized through 534
complementary techniques to assess their composition and crystallographic structure. 535
Some green earths are commercialised as containing mica but after in-depth analysis, 536
they are seen to be composed of gypsum, calcite and organic dyes. XRD and SEM-EDS 537
in the case of sampling, allow precise characterization and identification. Vibrational 538
spectroscopy is the most appropriate method for in-situ characterization. It allows the 539
distinction between celadonite and glauconite. We have shown in the case of Nicolas 540
Poussin’s painting, based on NIR analysis, that celadonite was used by the painter for 541
the green garland. This mineral quantification would enable an understanding of paint 542
properties and the difference between the behaviour of each earth when it is mixed with 543 the binder. 544
5 Acknowledgment
545The authors wish to acknowledge Dr. Cristiano Ferraris of the geological and mineral 546
gallery of the Museum National d’Histoire Naturelle (MNHN, Paris, France) for supplying 547
the samples of celadonite and glauconite and the Associate Professor Paolo Bensi of 548
the Scuola Politecnica Università di Genova for supplying the more recent sample 549
GE_Bren-h from Monte Baldo, near Prà della Stua. 550
They are also grateful to Chiara Merucci of the Galleria Nazionale d’Arte Antica (GNAA), 551
Rome, for allowing the analyses of the painting by Nicolas Poussin in the context of their 552
collaboration with the LAMS (CNRS-Sorbonne Université). 553
The authors thank Catherine Dejoie for the beam time on the beamline ID22 at the 554
European Synchrotron Radiation Facility (ESRF, Grenoble) and her help with the 555
measurements. 556
This work was supported by the Observatoire des Patrimoines of Sorbonne Université 557 (OPUS). 558 559
6 Figures
560Figure 1: Green earth colour identification in the L*a*b* space 561
Figure 2: Left: Visible spectra of green earths from 400 to 1000 nm 562
Figure 3: SEM photos of green earth 563
Figure 4: XRD laboratory patterns of two references from mineralogy gallery (Cel_Mon 564
and Glau_Vil), eight commercial green earths and one sample form Brentonico. Most 565
intense diffraction peaks are attributed with: C: Celadonite, G: Glauconite, Gy: Gypsum, 566
Q: Quartz and Ca: Calcite 567
Figure 5: a. (top) Le Bail refinement result for sample GE_Boh (experimental pattern: 568
data points, calculated pattern: red full line, difference: blue full line. The vertical ticks 569
indicate the Bragg positions for celadonite, quartz, montmorillonite, dickite and azurite 570
respectively), Rwp = 18 % (chi2=9.8). The unit-cell parameters obtained for celadonite 571
are: a = 5.2182(11) Å, b = 9.0312(17) Å, c = 10.43) Å, = 100.76(4)°. b. (bottom) 572
Strong hkl-dependent anisotropy of the diffraction profiles of celadonite: see for example 573
broadening of (001) and (110) Bragg reflections. 574
Figure 6: Rietveld refinement results (experimental pattern: data points, calculated 575
pattern: red full line, difference: blue full line) for samples GE-Cyp (a, top), Rwp = 32 % 576
(Chi2=16.2). The vertical ticks indicate the Bragg positions for celadonite, calcite, quartz 577
and montmorillonite respectively and GE_Bren (b, bottom), Rwp = 25 % (chi2=15.2). 578
Bragg positions for gypsum, calcite, celadonite, quartz and montmorillonite, respectively. 579
Figure 7: mid-IR reflectance spectra with the main celadonite, calcium, and gypsum 580
attributions in dotted line 581
Figure 8: NIR spectra of green earths and main band attributions 582
Figure 9: Mössbauer spectra (hatched bars) recorded on GE_Boh (top), GE_Cyp 583
(middle) and GE_Bren_h (bottom) at room temperature. Theoretical spectra are 584
superimposed as solid black lines and the deconvolutions are shown above with sites a 585
in red, sites b in orange, sites c in dark blue and sites d in light blue. 586
587
Figure 10: Bacchanales d’enfants, 56 cm x 76 cm, tempera, Nicolas Poussin, 1626, 588
Galleria Nazionale d’Arte Antica (GNAA), Rome, NIR analysed zone in blue: the garland 589
Figure 11: NIR spectrum of a garland zone in the painting Bacchanales d’enfants by 590
Nicolas Poussin ( 591
Figure 10) is compared with reflectance spectra of GE_Cyp and GE_Boh and the 592
reference celadonite (Cel_Mon) and glauconite (Glau_Vil) 593
7 Tables
594
Table 1: Samples and references analysed 595
Table 2: Mineralogical compositions of the green earths obtained from XRD data (in 596
bold, synchrotron data were used to identify the phases of these samples. In italic, minor 597
phases) 598
Table 3: Phase quantification by Rietveld refinements (%wt) Standard deviations of the 599
refined parameters were scaled with the Berar factor [31].Table 3: Phase quantification 600
by Rietveld refinements (%wt) Standard deviations of the refined parameters were 601
scaled with the Berar factor [31]. 602
Erreur ! Source du renvoi introuvable.
603
Table 4: Identification of celadonite, glauconite and ferroceladonite in the literature 604
Table 5: Main bands (cm-1) in green earths mid-infrared spectra and attributions 605
Table 6: SWIR Near-infrared main band attributions 606
Table 7: Mössbauer spectral parameters of investigated samples. Uncertainties are 607
indicated in parentheses 608
Table 8: Summary of the green earth identification by the different techniques 609
8 References
610
[1] Douma, M., Pigments through the Ages - Intro to the greens, (n.d.). 611
http://www.webexhibits.org/pigments/intro/greens.html (accessed June 6, 2019). 612
[2] M. Frizot, L’analyse des pigments de peintures murales antiques. État de la 613
question et bibliographie, ArchéoSciences, revue d’Archéométrie. 6 (1982) 47–59. 614
doi:10.3406/arsci.1982.1192. 615
[3] Augusti, S., I colori Pompeiani, Roma : De Luca, 1967. 616
[4] Raehlmann, E., Über die Maltechnik der Alten : mit besonderer Berücksichtigung 617
der römisch-pompejanischen Wandmalerei, nebst einer Anleitung zur mikroskopischen 618
Untersuchung der Kunstwerke, G. Reimer, Berlin, 1910. 619
[5] F. Delamare, L. Delamare, B. Guineau, G.-S. Odin, Couleur, nature et origine des 620
pigments verts employés en peinture murale gallo-romaine, in: Institut de recherche et 621
d’histoire des textes, Centre de recherche sur les collections, histoire et archéologie 622
Équipe Étude des pigments (Eds.), Pigments et colorants de l’Antiquité et du Moyen 623
Âge : Teinture, peinture, enluminure, études historiques et physico-chimiques, CNRS 624
Éditions, Paris, 2016: pp. 103–116. http://books.openedition.org/editionscnrs/8134 625
(accessed April 11, 2019). 626
[6] C. Cennini, G. Tambroni, M.P. (Mary P. Merrifield, A treatise on painting, London, 627
Lumley, 1844. http://archive.org/details/atreatiseonpain00merrgoog (accessed May 19, 628
2019). 629
[7] R.E. Van Grieken, K. Janssens, eds., Cultural heritage conservation and 630
environmental impact assessment by non-destructive testing and micro-analysis, 631
Balkema, Leiden, 2005. 632
[8] D.V. Thompson, C. Cennini, Il libro dell’Arte - English translation The Craftsman’s 633
Handbook, Courier Corporation, 1954. 634
[9] D. Bomford, The National Gallery, eds., Italian painting before 1400: exhibition 635
The National Gallery, London, 29 November 1989 - 28 February 1990, Repr, National 636
Gallery Publ, London, 2002. 637
[10] K. Groen, PAINTINGS IN THE LABORATORY: Scientific Examination for Art 638
History and Conservation, (n.d.) 24. 639
[11] J.L. Perez-Rodriguez, M. del C.J. de Haro, B. Siguenza, J.M. Martinez-Blanes, 640
Green pigments of Roman mural paintings from Seville Alcazar, Applied Clay Science. 641
116–117 (2015) 211–219. doi:10.1016/j.clay.2015.03.016. 642
[12] H.K.A. Glanville, Some Preliminary Remarks on Nicolas Poussin’s Painting 643
Technique in L’Orage: Complementary X-ray Fluorescence and X-ray Diffraction Study, 644 (n.d.). 645 https://www.academia.edu/33508410/Some_Preliminary_Remarks_on_Nicolas_Poussin 646 _s_Painting_Technique_in_L_Orage_Complementary_X-ray_Fluorescence_and_X-647
ray_Diffraction_Study (accessed June 6, 2019). 648
[13] L. Damjanović, M. Gajić-Kvaščev, J. Đurđević, V. Andrić, M. Marić-Stojanović, T. 649
Lazić, S. Nikolić, The characterization of canvas painting by the Serbian artist Milo 650
Milunović using X-ray fluorescence, micro-Raman and FTIR spectroscopy, Radiation 651
Physics and Chemistry. 115 (2015) 135–142. doi:10.1016/j.radphyschem.2015.06.017. 652
[14] A.M. Cardeira, S. Longelin, S. Costa, A. Candeias, M.L. Carvalho, M. Manso, 653
Analytical characterization of academic nude paintings by José Veloso Salgado, 654
Spectrochimica Acta Part A: Molecular and Biomolecular Spectroscopy. 153 (2016) 655
379–385. doi:10.1016/j.saa.2015.08.043. 656
[15] F. Ospitali, D. Bersani, G. Di Lonardo, P.P. Lottici, ‘Green earths’: vibrational and 657
elemental characterization of glauconites, celadonites and historical pigments, J. Raman 658
Spectrosc. 39 (2008) 1066–1073. doi:10.1002/jrs.1983. 659
[16] D. Hradil, A. Píšková, J. Hradilová, P. Bezdička, G. Lehrberger, S. Gerzer, 660
Mineralogy of Bohemian Green Earth Pigment and Its Microanalytical Evidence in 661
Historical Paintings, Archaeometry. 53 (2011) 563–586. doi:10.1111/j.1475-662
4754.2010.00554.x. 663
[17] L.M. Moretto, E.F. Orsega, G.A. Mazzocchin, Spectroscopic methods for the 664
analysis of celadonite and glauconite in Roman green wall paintings, Journal of Cultural 665
Heritage. 12 (2011) 384–391. doi:10.1016/j.culher.2011.04.003. 666
[18] H.A. Buckley, J.C. Bevan, K.M. Brown, L.R. Johnson, V.C. Farmer, Glauconite 667
and celadonite: two separate mineral species, Mineralogical Magazine. 42 (1978) 373– 668
382. doi:10.1180/minmag.1978.042.323.08. 669
[19] S.W. Bailey, Mineralogical Society of America, Micas, Mineralogical Society of 670
America, Washington, D.C., 1987. 671
[20] G.S. Odin, ed., Green marine clays: oolitic ironstone facies, verdine facies, 672
glaucony facies and celadonite-bearing facies ; a comparative study, Elsevier, 673
Amsterdam, 1988. 674
[21] R.L. Feller, National Gallery of Art, eds., Artists’ Pigments: a handbook of their 675
history and characteristics. Vol. 1: ..., Repr, National Gallery of Art [u.a], Washington, 676
DC, 2012. 677
[22] P. Piantone, minéralogie et cristallochimiedes phyllosilicates :application à 678
l’étude des altérationshydrothermales, rapport de stage. (1986). 679
http://infoterre.brgm.fr/rapports/86-DAM-019-GMX.pdf (accessed May 6, 2019). 680
[23] D. Hradil, T. Grygar, M. Hrušková, P. Bezdička, K. Lang, O. Schneeweiss, M. 681
Chvátal, Green Earth Pigment from the Kadañ Region, Czech Republic: Use of Rare Fe-682
rich Smectite, Clays and Clay Minerals. 52 (2004) 767–778. 683
doi:10.1346/CCMN.2004.0520612. 684
[24] D. Hradil, T. Grygar, J. Hradilová, P. Bezdička, Clay and iron oxide pigments in 685
the history of painting, Applied Clay Science. 22 (2003) 223–236. doi:10.1016/S0169-686
1317(03)00076-0. 687