HAL Id: inserm-00323945
https://www.hal.inserm.fr/inserm-00323945
Submitted on 23 Jun 2014
HAL is a multi-disciplinary open access archive for the deposit and dissemination of sci-entific research documents, whether they are pub-lished or not. The documents may come from teaching and research institutions in France or abroad, or from public or private research centers.
L’archive ouverte pluridisciplinaire HAL, est destinée au dépôt et à la diffusion de documents scientifiques de niveau recherche, publiés ou non, émanant des établissements d’enseignement et de recherche français ou étrangers, des laboratoires publics ou privés.
Total serum IgE levels are associated with ambient
ozone concentration in asthmatic adults.
Estelle Rage, Bénédicte Jacquemin, Rachel Nadif, Marie-Pierre Oryszczyn,
Valérie Siroux, Inmaculada Aguilera, Francine Kauffmann, Nino Künzli
To cite this version:
Estelle Rage, Bénédicte Jacquemin, Rachel Nadif, Marie-Pierre Oryszczyn, Valérie Siroux, et al.. Total serum IgE levels are associated with ambient ozone concentration in asthmatic adults.. Allergy, Wiley, 2009, 64 (1), pp.40-6. �10.1111/j.1398-9995.2008.01800.x�. �inserm-00323945�
Revised version – Allergy
Total serum IgE levels are associated with ambient ozone concentration in asthmatic adults
Estelle Rage1,2, Bénédicte Jacquemin1,2, Rachel Nadif1,2, Marie-Pierre Oryszczyn1,2, Valérie Siroux3,4, Inmaculada Aguilera5,Francine Kauffmann1,2, Nino Künzli5,6.
on behalf of the Epidemiological Study on the Genetics and Environment of Asthma (EGEA)
INSTITUTIONS
1
Inserm, U780, Epidemiology and Biostatistics, Villejuif, France;
2
Univ Paris-Sud, IFR69, Villejuif, France;
3
Inserm, U823, Centre de Recherche Albert Bonniot, Epidémiologie des cancers et des affections graves, La Tronche, F-38706 France;
4
Univ Joseph Fourier, Grenoble, F-38041 France;
5
Center for Research in Environmental Epidemiology (CREAL), Municipal Institute of Medical Research (IMIM-Hospital del Mar), and CIBER in Epidemiology and Public Health (CIBERESP), Barcelona, Spain;
6
ICREA Research Professor, Barcelona, Spain. CORRESPONDENCE
Estelle Rage Inserm U780
16 avenue Paul Vaillant Couturier 94807 Villejuif Cedex
France
Email : rage@vjf.inserm.fr
ABSTRACT
Background: Effects of air pollution exposure on IgE-mediated response in asthmatics
are poorly investigated. The aim was to examine the relationship between air pollution concentrations and total IgE levels in adult asthmatics.
Methods: The present study relates to the 369 asthmatic adults from the French
Epidemiological study on Genetics and Environment of Asthma (EGEA), with both available total serum IgE measurements and air pollution concentrations. Geo-statistical models were performed on 4km x 4km grids to assess individual outdoor air pollution exposure. Annual outdoor concentrations of ozone (O3), nitrogen dioxide (NO2),
sulphur dioxide (SO2), and particles smaller than 10µm size (PM10), and concentrations
of summer ozone were assigned to subject’s home address.
Results: The geometric mean of total IgE was 161 IU.mL-1 and the average of ozone exposure was 44.9 ± 9.5 µg.m-3. Ozone concentrations were positively related to total IgE levels and an increase of 10 µg.m-3 of ozone resulted in an increase of 20.4% (95% CI = 3.0-40.7) in total IgE levels. Adjustment for age, sex, smoking habits and previous life in the countryside did not change the results, and an increase of 19.1% (2.4-38.6) in total IgE was observed with ozone. Negative associations observed between NO2 and
total IgE levels disappeared after including ozone in the models. Neither SO2 nor PM10
Conclusions: Results suggest that ozone or related ambient pollutants may up-regulate
total IgE levels among asthmatic adults. WORD COUNT: Abstract: 236; text: 2659.
KEYWORDS: asthma, IgE, ozone.
INTRODUCTION
Ambient air pollutants are well known causes of symptom exacerbations among asthmatics (1,2). However, the role of air pollution in the onset of asthma and allergic diseases is far less clear and increased incidence in these diseases across the past decades is usually assigned to other environmental factors and ‘western life style’ (3).
Despite the strong association of total IgE with asthma over the life span (4), the literature on the potential association of air pollution with total IgE is scanty. One study conducted in adults observed higher total IgE related to more polluted area (5), whereas two studies showed inconsistent results in children exposed to NO2, PM2.5 and soot
(6,7). None of them assessed ozone exposure. The strong tracking of IgE over the life span evidenced by longitudinal studies suggests that it may be a useful indicator to focus on the investigation of long-term effects of ambient air pollution. Whereas direct adaptive immune response does not explain the role of air pollutants in allergic diseases, various mechanisms may be involved, especially oxidative stress with consequences on innate immunity (8), and up-regulation of the T helper type 2 (Th2) response (9,10), characterized by high IgE production. Further, modification of responses to allergens by gaseous pollutants has also been suggested, but results are debated (8,11). Similarly to smoking for which the role on total IgE is well known (12,13), it is biologically plausible that particles and gaseous air pollutants, such as ozone, may result in increased total IgE levels.
The purpose of this analysis is to investigate the relationships between the levels of total serum IgE and modelled home outdoor air pollution concentrations among adult asthmatics of the French Epidemiological study on the Genetics and Environment of Asthma (EGEA).
METHODS
Population study
EGEA is a case-control and family study. The protocol has been described elsewhere (14). Briefly, asthmatic cases, living in pre-defined geographical areas were recruited from hospital chest clinics in five French cities (Paris, Lyon, Marseille, Montpellier, and Grenoble) between 1991 and 1995. Due to recruitment constraints, the number of asthmatic probands varied according to cities from 36 to 121. Asthmatic relatives were recruited from cases. Subjects answered to a detailed questionnaire regarding respiratory symptoms, environment and treatment. The present study includes the 369 asthmatic adults with available IgE measurement and available modelled air pollution concentrations. Within each city, subject’s residences spread across large geographic areas, ranging from 300 km2 (for the area of Lyon) to 9300 km2 (for the area of Marseille).
Health assessment
Total serum IgE (in international units (IU) per millilitre) were measured by immunoassay (Phadebas PRIST technique; Pharmacia Diagnostics, AB, France). All determinations were performed in one central laboratory (Lyon Pasteur Institute). Skin Prick Tests (SPT) were performed for 11 allergens: cat, Dermatophagoides
pteronyssinus, Cladosporium herbarum, Altenaria tenuis, timothy grass, olive, birch, Parietaria judaica, ragweed, Aspergillus, and Blatta germanica. Negative (uncoated)
and positive (histamine) SPT controls were used. Atopy was defined as having a positive skin test (≥ 3 mm than the control) to at least one of the 11 allergens. Methacholine bronchial challenge test was performed, except for those with a forced expiratory volume in 1 second (FEV1) < 80% predicted or post-diluent FEV1 < 90% at
baseline. Bronchial hyperresponsiveness (BHR) was defined as ≥ 20% decline of FEV1
for a methacholine cumulative dose ≤ 4mg (PD20 ≤ 4 mg).
Air pollution exposure assessment
Residential addresses of participants were geo-coded. Home outdoor air pollution levels for each subject were assigned by deriving concentration estimates from a geo-statistical model carried out by Geovariances for the French Institute of Environment (IFEN) and the French Agency for Environment and Energy (ADEME) for the year 1998 for ozone (O3), nitrogen dioxide (NO2), and sulphur dioxide (SO2)
(15). Additional data were explored for particulate matter smaller than 10µm in size (PM10) from concentrations of the year 2004 since the number of monitors recording
PM10 concentrations was insufficient in 1998. Common geostatistical interpolation
techniques (cokriging-like techniques) (16) have been applied to estimate air pollution at unsampled locations (17); the estimation process, based on measured concentrations, took into account the spatial structure of each pollutant. The interpolation was performed for annual mean concentrations from background monitoring stations of the ADEME network on a 4km x 4km grid covering entire area of France. Land cover was integrated to the interpolation process and cofactors specific to each pollutant taken into consideration. Road network, population density and emission registries were used in the assessment of NO2, industrial emissions of sulphur oxides for SO2, emission
inventory of black smokes for PM10, and altitude for ozone. Annual means for O3, NO2,
SO2 and PM10 as well as summer ozone (summer O3) assessed from the monthly means
from April to September were assigned to each individual’s home address.
Environmental factors
Pollen season was assessed for each French geographic department of the subject’s home addresses. Pollen counts were assessed by a volumetric monitor located in each of the five cities. The data were collected by the National Network for Aerobiological Monitoring (RNSA) and were available on the RNSA website (18). Subjects were classified as exposed to the pollen season when their blood samples were drawn in months with mean pollen count greater than 480 pollen grains per cubic metre. Smoking habits (never / ex / current smokers) and country living (having lived at least one year in the country side), previously shown to be associated with total IgE levels in the EGEA study were considered in the analyses (12,19).
Data analyses
Analyses have been performed on log10 (IgE) and descriptive results are expressed in geometric means (GM). Statistical methods included χ2 test, analyses of
variance and correlations coefficients. Relationships between IgE levels and air pollution exposure were assessed with multiple linear regressions on logIgE. For a better understanding, results are expressed in IgE percent change, for a 10 µg.m-3 increase in O3, summer O3, NO2 and SO2 and for a 2 µg.m-3 increase in PM10
corresponding to the inter quartile range percentile 75th minus percentile 25th) of these pollutants, according to the formula (10^(β) – 1) x 100 (where beta (β) is the regression coefficient). Due to the familial aggregation of the data, generalized estimated equations (GEE) were systematically performed to take into account dependence between observations, using MIXED procedures. Significance was assessed at the 5% two-sided level. All statistical analyses were done using SAS version 9.1 (SAS Institute, Inc., Cary, NC).
RESULTS
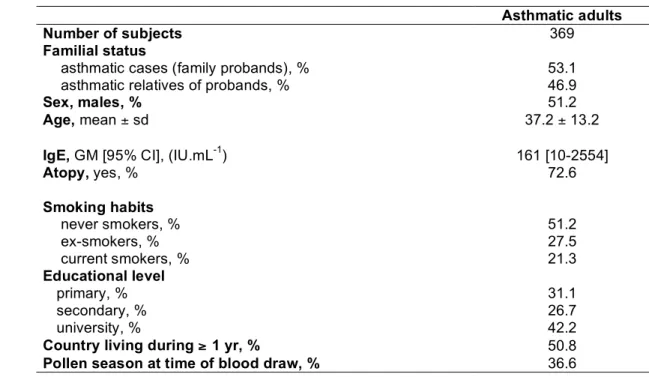
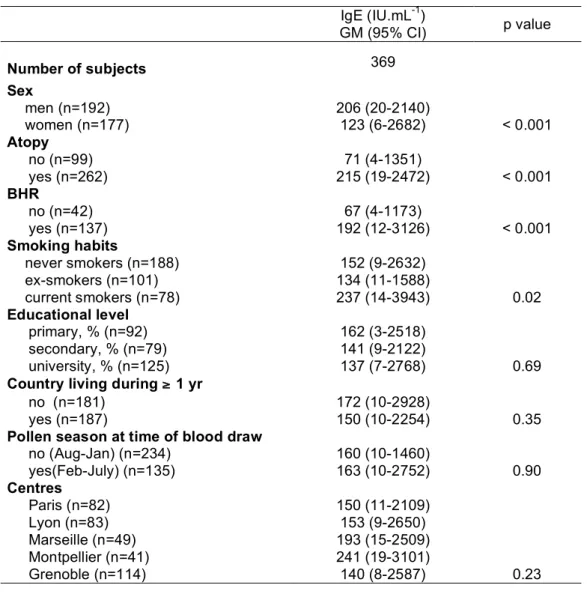
Characteristics of the population are presented in table 1. The average age of the 369 asthmatic adults was 37.2 years. The geometric mean for the total serum IgE level was 161 IU.mL-1. Nearly 75% of the subjects were atopic. Total serum IgE levels in asthmatics decreased significantly with age and were significantly higher in men than in women, in current smokers than in never smokers or ex-smokers (237 IU.mL-1 vs. 146 IU.mL-1, p=0.007), in atopics than in non-atopics, and in bronchial responsive subjects than in non-responsive subjects (table 2).
Air pollution exposure
Home outdoor air pollution concentrations are described in table 3. Exposure contrasts, expressed as the ratio between the 75th percentile and 25th represented a 2.3-fold spatial difference for SO2, a 1.3-fold difference for NO2, a 1.2-fold difference for
annual O3 and summer O3, and 1.1-fold difference for PM10 concentrations. The range
of exposure was 0.6-28.3 µg.m-3 for SO2, 15.4-60.7 for NO2, 27.8-80.7 for O3,
39.3-99.2 for summer O3, and 14.0-28.3 for PM10. O3 and NO2 were negatively associated
(r=-0.72) while both ozone indicators were positively correlated (r=0.97). The distribution of the air pollution concentrations in each centre is shown in table 4.
Association of total serum IgE levels with air pollution exposure
Total serum IgE levels were positively and significantly associated to both indicators of ozone. Crude results were similar to those adjusted for age, sex, smoking habits, and country living (table 5). The negative association between IgE and ambient NO2 concentrations disappeared in the two-pollutant models including both NO2 and
O3. Compared to the single pollutant models, the effect size of NO2 on IgE decreased in
the two-pollutant (NO2 and summer O3) model by 57%, whereas the estimate of
summer O3 only decreased by 25%. No interaction was observed between ozone and
NO2 for the relation with total IgE (p interaction = 0.64 and 0.57, respectively for O3
and summer O3). After exclusion of subjects with high exposure to NO2 (≥ 75th
percentile), total IgE levels remained associated with ozone (table 6). No association was observed between total IgE levels and SO2 or PM10.
The observed relationship between ozone and total IgE level did not differ significantly according to sex, smoking habits or participation during pollen season (table 5). Effects of ozone remained significant in some subgroups, namely in men and in subjects examined out of the pollen season. Models adjusted for centre (city) indicated heterogeneity of effects across cities. Effect estimates remained unchanged with adjustment for centre but the confidence interval widened and included the
no-effect level. None of the city-specific estimates reached statistical significance (data not shown).
DISCUSSION
The present results show a positive association between home outdoor annual ozone concentrations assessed with geostatistical methods and total IgE levels in adult asthmatics. Associations were not sensitive to adjustment for neither covariates nor the season of IgE measurements. As the observed association is biologically plausible, the present findings may contribute to a better understanding of the effects of air pollution on asthma.
Strengths and weaknesses
A major strength relates to the well characterized asthmatics included in the EGEA, which leads to minimize misclassification biases. Total serum IgE measurements were available for most of the subjects and underwent a strict quality control. Another strength of the study is to have individual home-based modelled concentrations of various air pollutants. However, the grid size of 4 x 4km was rather crude. This comes with some inherent albeit non-systematic misclassification of exposure. While this is less the case for secondary pollutants, such as ozone, the spatial scale is too crude for primary pollutants, and for markers of traffic related pollution such as NO2 with substantial spatial heterogeneity (20). Thus, our study does not fully
capture traffic related exposure, although NO2 models took into account land cover,
emission registries, road network and population density. As a consequence, our estimates of NO2 may underestimate the associations of traffic-related to IgE. Further
studies are needed with more precise estimates of NO2. The grid size may be sufficient
for O3. The residential areas covered a region more than twenty times larger than the
city areas, resulting in considerable contrast in ambient O3 concentrations within each
centre.
Pollen exposure may be a source of confounding if correlated with ambient air pollution or if IgE increase related to pollen may interact with the investigated association between pollution and IgE. It has been shown that O3 may amplify the
response to aeroallergens (21). However, we used total IgE rather than specific IgE. It is known that the non specific IgE constituting the non sensitive fraction of the total IgE (22) could not be sensitive to pollens. We had no individual pollen data available to adjust for acute exposure. However, the analysis stratified by the season of participation showed that the relation between O3 and IgE was similar among those who participated
during the pollen season and the others. This suggests that acute pollen exposure is unlikely to bias our main findings. A formal assessment of the acute effects of pollen and its interaction with O3 would require another study design such as panel study.
The substantial North-South gradient of ozone concentrations in France may partly explain the observed heterogeneity of ozone effects across centres. Adding centre in the model may lead to some over-adjustment. As none of the city-specific estimates reached statistical significance, it is impossible to evaluate the reasons for the heterogeneity.
The positive association with ozone and the negative association with NO2 are
consistent with the previous study from the French 6C study conducted in more than 9000 children (23) where O3 concentrations were positively related to positive SPT,
whereas NO2 concentrations were inversely associated to SPT. This can be explained
‘protective’ effect of NO2 disappeared while the associations of O3 remained rather
strong. This suggests the NO2 findings to be spurious due to confounding by O3. The O3
models do not account for local scavenging of O3 in proximity to streets as an important
primary source of NOx emissions (24), thus the assigned O3 concentrations may be
systematically overestimated among subjects living close to busy roads. Results, however, showed that the association of ozone with IgE remained after exclusion of high exposure to NO2, further supporting an effect of ozone.
Epidemiological evidence
While no epidemiological study has investigated the relationship between ambient ozone and total IgE, few studies have evaluated IgE associations with other urban air pollutants. Studies examining air pollution effects on human immunological response found inconsistent results. A geographic comparison of IgE levels across two German cities, namely Erfurt in former Eastern Germany and Hamburg, reported lower IgE in the western city (5). While Erfurt had clearly higher levels of SO2 and suspended
particles at that period, many other factors differed between East and West Germany as well, limiting the interpretation of these findings. Among Dutch children of the ISAAC study, total serum IgE was positively associated with ambient NO2 and soot, but not
with PM2.5, measured at school (6). In another Dutch study, total IgE of young children
aged of four years from a prospective birth cohort, were not associated with cumulative exposure of NO2, PM2.5 or soot (7). However, results observed in children cannot be
extrapolated to adults, due to the immaturity of the immune system in children.
There is some evidence that particles or diesel exhaust particles could increase IgE levels (11,25) and our null findings for PM10 contrast with this literature.
Unfortunately we had no information regarding the smaller size fractions such as diesel particles or PM2.5, which may be more relevant. Moreover, it should be noted that
contrasts in PM10 exposure were rather small within our population. No effect of SO2 -
known for its irritant and bronchoconstrictive effects - on IgE levels was observed in our sample.
Biological plausibility
It is well known that ozone, through its oxidative properties leads to airways inflammation. Ozone generates reactive oxygen species, directly or indirectly following to peroxidation of the polyunsaturated fatty acids in the lipidic membrane, leading to activation of transcription factors such as NF-kB (26.27). Increased expression of pro-inflammatory interleukins then occurs, including Th2 cytokines such as IL-4 (9,10). The increased respiratory mucosal permeability related to peroxidation could also facilitate the penetration of inhaled allergens (26,28,29). Ozone is an innate immune stimulus, which significantly up-regulates cell surface molecules such as mCD14 and increases antigen presentation, favouring then a Th2 profile (30). While increased expression of eosinophilic cationic protein (31) or production of IL-5 (32) have been observed following acute exposure to ozone in asthmatics, the long-term immunologic effects of chronic exposure to ozone have not been studied. As previous observations have shown increased in IL-4 in relation to the oxidative exposure to cigarette smoking, it can be hypothesized, that among asthmatics, already IL-4 up-regulated, chronic exposure to ozone increases total IgE by a mechanism similar to smoking (33). Our observational study cannot distinguish direct effects of O3 from indirect effects due to O3 reaction
products. As suggested in a simulation of indoor air chemistry, ozone may enhance the formation of secondary reaction products of volatiles organic compounds which in turn
play a role in sensitization (34). Overall, the findings support the potential role of ozone in the up-regulation of IgE.
In conclusion, results suggest that exposure to ozone may increase total IgE in adult asthmatics. Further research, in particular longitudinal studies, is needed to replicate this finding and to assess the potential role of chronic exposure to oxidants in the general or occupational environment on IgE, besides smoking or ozone.
Acknowledgements
The authors thank N. Jeannée from Géovariances and all those from the French Institute for Environment, and particularly M. Ba, for their work on the geo-spatial models. Partially supported by the European Associated Laboratory on Respiratory Epidemiology, a joint initiative of INSERM, Paris and CREAL, Barcelona.
Supported by ADEME, AFSSET, ANR-SEST.
EGEA Cooperative group
Coordination: F Kauffmann; F Demenais (genetics); I Pin (clinical aspects).
Respiratory epidemiology: Inserm U 700, Paris M Korobaeff (Egea1), F Neukirch (Egea1); Inserm U 707, Paris : I Annesi-Maesano ; Inserm U 780, Villejuif : F Kauffmann, N Le Moual, R Nadif, MP Oryszczyn ; Inserm U 823, Grenoble : V Siroux.
Genetics: Inserm U 393, Paris : J Feingold ; Inserm U 535, Villejuif : MH Dizier ;
Inserm U 794, Paris : E Bouzigon , F Demenais ; CNG, Evry : I Gut , M Lathrop.
Clinical centers: Grenoble : I Pin, C Pison; Lyon : D Ecochard (Egea1), F Gormand, Y
Pacheco ; Marseille : D Charpin (Egea1), D Vervloet ; Montpellier : J Bousquet ; Paris Cochin: A Lockhart (Egea1), R Matran (now in Lille) ; Paris Necker : E Paty, P Scheinmann ; Paris-Trousseau : A Grimfeld, J Just.
Data and quality management: Inserm ex-U155 (Egea1) : J Hochez ; Inserm U 780,
Villejuif : N Le Moual, C Ravault ; Inserm U 794 : N Chateigner ; Grenoble : J Ferran.
References
1. D'Amato G, Liccardi G, D'Amato M, Holgate S. Environmental risk factors and allergic bronchial asthma. Clin Exp Allergy 2005;35:1113-1124.
2. McCreanor J, Cullinan P, Nieuwenhuijsen MJ, Stewart-Evans J, Malliarou E, Jarup L et al. Respiratory effects of exposure to diesel traffic in persons with asthma. N Engl J Med 2007;357:2348-2358.
3. Gilmour MI, Jaakkola MS, London SJ, Nel AE, Rogers CA. How exposure to environmental tobacco smoke, outdoor air pollutants, and increased pollen burdens influences the incidence of asthma. Environ Health Perspect 2006;114:627-633.
4. Burrows B, Martinez FD, Halonen M, Barbee RA, Cline MG. Association of asthma with serum IgE levels and skin-test reactivity to allergens. N Engl J Med 1989;320:271-277.
5. Nowak D, Heinrich J, Jorres R, Wassmer G, Berger J, Beck E et al. Prevalence of respiratory symptoms, bronchial hyperresponsiveness and atopy among adults: west and east Germany. Eur Respir J 1996;9:2541-2552.
6. Janssen NA, Brunekreef B, van Vliet P, Aarts F, Meliefste K, Harssema H et al. The relationship between air pollution from heavy traffic and allergic sensitization, bronchial hyperresponsiveness, and respiratory symptoms in Dutch schoolchildren. Environ Health Perspect 2003;111:1512-1518.
7. Brauer M, Hoek G, Smit HA, de Jongste JC, Gerritsen J, Postma DS et al. Air pollution and development of asthma, allergy and infections in a birth cohort. Eur Respir J 2007;29:879-888.
8. Saxon A, Diaz-Sanchez D. Air pollution and allergy: you are what you breathe. Nat Immunol 2005;6:223-226.
9. Frossi B, De Carli M, Piemonte M, Pucillo C. Oxidative microenvironment exerts an opposite regulatory effect on cytokine production by Th1 and Th2 cells. Mol Immunol 2008;45:58-64.
10. King MR, Ismail AS, Davis LS, Karp DR. Oxidative stress promotes polarization of human T cell differentiation toward a T helper 2 phenotype. J Immunol 2006;176:2765-2772.
11. Fujieda S, Diaz-Sanchez D, Saxon A. Combined nasal challenge with diesel exhaust particles and allergen induces In vivo IgE isotype switching. Am J Respir Cell Mol Biol 1998;19:507-512.
12. Oryszczyn MP, Annesi-Maesano I, Charpin D, Paty E, Maccario J, Kauffmann F. Relationships of active and passive smoking to total IgE in adults of the Epidemiological Study of the Genetics and Environment of Asthma, Bronchial Hyperresponsiveness, and Atopy (EGEA). Am J Respir Crit Care Med 2000;161:1241-1246.
13. Raherison C, Nejjari C, Marty ML, Filleul L, Barberger-Gateau P, Dartigues JF et al. IgE level and Phadiatop in an elderly population from the PAQUID cohort: relationship to respiratory symptoms and smoking. Allergy 2004;59:940-9455. 14. Kauffmann F, Dizier MH, Pin I, Paty E, Gormand F, Vervloet D et al.
Epidemiological study of the genetics and environment of asthma, bronchial hyperresponsiveness, and atopy: phenotype issues. Am J Respir Crit Care Med 1997;156:S123-S129.
15. Jeannée N. Cartography of atmospheric pollution at the France national scale for the atlas of air quality monitoring. Geovariances, ADEME/IFEN (French Institute of Environment), France, 2006, 98 p.
16. Chilès JP, Delfiner P. Geostatistics: modelling spatial uncertainty, Wiley Series in Probability and Mathematical Statistics. 1999:695 p.
17. Jeannée N, Nedellec V, Bouallala S, Deraisme J, Desqueyroux H. Geostatistical assessment of long term human exposure to air pollution. In geoENV V - Geostatistics for Environmental Applications. eds. Renard, Demougeot-Renard & Froidevaux, Kluwer Academic Publishers, 2004;161-172.
18. National Network for Aerobiological Monitoring (RNSA). Available at: http://www.pollens.fr/accueil.php (accessed on February 2008).
19. Kauffmann F, Oryszczyn MP, Maccario J. The protective role of country living on skin prick tests, immunoglobulin E and asthma in adults from the Epidemiological study on the Genetics and Environment of Asthma, bronchial hyper-responsivenes and atopy. Clin Exp Allergy 2002;32:379-386.
20. Lewné M, Cyrys J, Meliefste K, Hoek G, Brauer M, Fischer P et al. Spatial variation in nitrogen dioxide in three European areas. Sci Total Environ 2004;332:217-230.
21. Molfino NA, Wright SC, Katz I, Tarlo S, Silverman F, McClean PA et al. Effect of low concentrations of ozone on inhaled allergen responses in asthmatic subjects. Lancet 1991;338:199-203.
22. Jackola DR, Blumenthal MN, Rosenberg A. Evidence for two independent distributions of serum immunoglobulin E in atopic families: cognate and non-cognate IgE. Hum Immunol 2004;65:20-30.
23. Pénard-Morand C, Charpin D, Raherison C, Kopferschmitt C, Caillaud D, Lavaud F et al. Long-term exposure to background air pollution related to respiratory and allergic health in schoolchildren. Clin Exp Allergy 2005;35:1279-1287.
24. McConnell R, Berhane K, Yao L, Lurmann FW, Avol E, Peters JM. Predicting residential ozone deficits from nearby traffic. Sci Total Environ 2006;363:166-174.
25. Mamessier E, Nieves A, Vervloet D, Magnan A. Diesel exhaust particles enhance T-cell activation in severe asthmatics. Allergy 2006;61:581-588.
26. Mudway IS, Kelly FJ. Ozone and the lung: a sensitive issue. Mol Aspects Med 2000;21:1-48.
27. Romieu I, Castro-Giner F, Kunzli N, Sunyer J. Air pollution, oxidative stress and dietary supplementation: a review. Eur Respir J 2008;31:179-197.
28. Hollingsworth JW, Kleeberger SR, Foster WM. Ozone and pulmonary innate immunity. Proc Am Thorac Soc 2007;4:240-246.
29. Devalia JL, Rusznak C, Davies RJ. Allergen/irritant interaction--its role in sensitization and allergic disease. Allergy 1998;53:335-345.
30. Lay JC, Alexis NE, Kleeberger SR, Roubey RA, Harris BD, Bromberg PA et al. Ozone enhances markers of innate immunity and antigen presentation on airway monocytes in healthy individuals. J Allergy Clin Immunol 2007;120:719-722. 31. Hiltermann JT, Lapperre TS, van Bree L, Steerenberg PA, Brahim JJ, Sont JK et
al. Ozone-induced inflammation assessed in sputum and bronchial lavage fluid from asthmatics: a new noninvasive tool in epidemiologic studies on air pollution and asthma. Free Radic Biol Med 1999;27:1448-1454.
32. Bosson J, Stenfors N, Bucht A, Helleday R, Pourazar J, Holgate ST et al. Ozone-induced bronchial epithelial cytokine expression differs between healthy and asthmatic subjects. Clin Exp Allergy 2003;33:777-782.
33. Byron KA, Varigos GA, Wootton AM. IL-4 production is increased in cigarette smokers. Clin Exp Immunol 1994;95:333-336.
34. Anderson SE, Wells JR, Fedorowicz A, Butterworth LF, Meade BJ, Munson AE. Evaluation of the contact and respiratory sensitization potential of volatile organic compounds generated by simulated indoor air chemistry. Toxicol Sci 2007;97:355-363.
Table 1: Population characteristics of the asthmatic adults
Asthmatic adults
Number of subjects 369
Familial status
asthmatic cases (family probands), % 53.1
asthmatic relatives of probands, % 46.9
Sex, males, % 51.2
Age, mean ± sd 37.2 ± 13.2
IgE, GM [95% CI], (IU.mL-1) 161 [10-2554]
Atopy, yes, % 72.6 Smoking habits never smokers, % 51.2 ex-smokers, % 27.5 current smokers, % 21.3 Educational level primary, % 31.1 secondary, % 26.7 university, % 42.2
Country living during ≥ 1 yr, % 50.8
Pollen season at time of blood draw, % 36.6
Table 2: Association of various individuals’ characteristics with total IgE levels IgE (IU.mL-1) GM (95% CI) p value Number of subjects 369 Sex men (n=192) 206 (20-2140) women (n=177) 123 (6-2682) < 0.001 Atopy no (n=99) 71 (4-1351) yes (n=262) 215 (19-2472) < 0.001 BHR no (n=42) 67 (4-1173) yes (n=137) 192 (12-3126) < 0.001 Smoking habits never smokers (n=188) 152 (9-2632) ex-smokers (n=101) 134 (11-1588) current smokers (n=78) 237 (14-3943) 0.02 Educational level primary, % (n=92) 162 (3-2518) secondary, % (n=79) 141 (9-2122) university, % (n=125) 137 (7-2768) 0.69
Country living during ≥ 1 yr
no (n=181) 172 (10-2928)
yes (n=187) 150 (10-2254) 0.35
Pollen season at time of blood draw
no (Aug-Jan) (n=234) 160 (10-1460) yes(Feb-July) (n=135) 163 (10-2752) 0.90 Centres Paris (n=82) 150 (11-2109) Lyon (n=83) 153 (9-2650) Marseille (n=49) 193 (15-2509) Montpellier (n=41) 241 (19-3101) Grenoble (n=114) 140 (8-2587) 0.23 GM: geometric mean
Table 3: Description and correlation coefficients of home outdoor assigned air pollution
concentrations assessed in asthmatic adults from the EGEA study
Pearson coefficients mean ± sd, µg.m-3 median (p25-p75), µg.m-3 O3 summer O3 NO2 SO2 PM10 O3 44.9 ± 9.5 43.1 (39.3-48.1) 1 0.97** - 0.72** - 0.32** 0.12* summer O3 62.3 ± 10.9 61.4 (56.9-67.6) 1 - 0.69** - 0.26** 0.32** NO2 35.6 ± 9.5 35.4 (29.3-39.1) 1 0.56** 0.20* SO2 9.9 ± 5.5 8.6 (5.8-13.5) 1 0.59** PM10 20.8 ± 2.5 20.8 (19.8-21.6) 1 * p ≤ 0.01, **p ≤ 0.001
Table 4: Distribution of the air pollution concentrations in each centre Paris n=82 Lyon n=83 Marseille n=49 Montpellier n=41 Grenoble n=114 O3 (µg.m -3 ) mean ± sd, 36.7 ± 6.3 44.2 ± 2.8 55.1 ± 8.1 61.0 ± 3.7 41.0 ± 4.6 median(p25-p75) 37.2 (30.9-42.6) 44.2 (42.9-46.2) 50.8 (48.1-61.3) 61.8 (59.2-62.9) 40.7 (38.2-42.1) Summer O3(µg.m -3 ) mean ± sd, 48.9 ± 6.3 63.0 ± 3.0 74.5 ± 7.9 78.8 ± 4.0 60.1 ± 4.8 median(p25-p75) 50.0 (43.5-53.1) 62.9 (62.0-64.7) 71.8 (68.3-80.9) 79.8 (76.8-80.9) 60.3 (56.9-60.7) NO2(µg.m -3 ) mean ± sd, 41.8 ± 12.2 39.5 ± 6.8 29.5 ± 7.4 27.7 ± 6.9 33.6 ± 5.5 median(p25-p75) 37.4 (33.4-54.7) 38.7 (34.4-46.9) 28.0 (22.6-34.8) 27.0 (22.4-32.6) 35.4 (29.4-38.7) SO2(µg.m -3 ) mean ± sd, 10.9 ± 4.7 10.9 ± 3.9 15.5 ± 8.0 4.8 ± 2.7 8.1 ± 3.6 median(p25-p75) 11.7 (6.8-14.8) 11.8 (7.3-13.7) 16.1 (8.6-22.1) 4.2 (2.9-5.9) 7.7 (4.6-10.7) PM10(µg.m -3 ) mean ± sd, 18.6 ± 1.9 21.1 ± 1.3 24.7 ± 2.9 20.4 ± 1.5 20.5 ± 1.2 median(p25-p75) 18.8 (17.1-20.2) 21.2 (20.5-22.3) 25.4 (23.2-26.7) 20.6 (19.4-21.3) 20.8 (20.1-21.4)
sd: standard deviation; p25 - p75: 25th-75th percentiles
Table 5: Percent change in total IgE for home outdoor assigned air pollution concentrations
among asthmatic adults
* Percent change in total IgE, expressed for an increase of 10 µg.m-3 of O3, summer O3, NO2
and SO2 and for an increase of 2 µg.m -3
of PM10, corresponding to the inter quartile range
(percentile 75th minus percentile 25th) of these pollutants.
†
Models were adjusted for age, sex, smoking habits, and country living and took into account familial dependence. n IgE % change* Lower 95% CI Upper 95% CI Single-Pollutant Model O3 crude model 369 20.4 3.0 40.7 adjusted model† 367 19.1 2.4 38.6 summer O3 crude model 369 17.0 2.2 33.9 adjusted model† 367 16.9 2.5 33.2 NO2 crude model 369 -14.4 -26.7 -0.0 adjusted model† 367 -14.4 -26.4 -0.4 SO2 crude model 369 -0.6 -24.0 30.0 adjusted model† 367 -6.7 -27.9 20.8 PM10 crude model 369 3.5 -8.1 16.7 adjusted model† 367 2.4 -8.7 14.7 Two-pollutant model crude model O3 369 16.3 -6.8 45.2 NO2 369 -4.7 -23.6 18.9 adjusted model† O3 367 13.8 -7.9 40.6 NO2 367 -6.3 -24.2 15.7 Two-pollutant model crude model summer O3 369 12.9 -6.2 35.8 NO2 369 -5.9 -23.9 16.4 adjusted model† summer O3 367 12.6 -5.5 34.3 NO2 367 -6.2 -23.4 15.0
Table 6: Percent change in total IgE per 10 µg.m-3 increase in home outdoor O3 among
subgroups of asthmatic adults
O3 summer O3 IgE % change* Lower 95% CI Upper 95% CI pi IgE % change* Lower 95% CI Upper 95% CI pi All subjects 19.1 2.4 38.6 16.9 2.5 33.2 Sex 0.45 0.39 men (n=190) 21.0 1.0 45.0 17.8 0.6 37.9 women (n=177) 13.7 -11.5 46.0 12.7 -9.3 40.0 Smoking habits 0.75 0.91 never smokers (n=188) 22.6 -0.22 50.6 19.1 -0.6 42.8 ex-smokers (n=101) 19.6 -7.6 54.8 14.6 -8.0 42.6 smokers (n=78) 14.7 -17.2 58.8 17.4 -10.8 54.3
Pollen season at time of blood draw 0.71 0.60
during pollen season (n=134) 21.1 -4.3 53.3 17.0 -5.1 44.2 out of pollen season (n=233) 21.5 -0.4 48.1 19.5 1.0 41.4
NO2 exposure 0.69 0.84 NO2 < 75 th percentile (n=273) 20.2 1.2 42.8 18.1 1.7 37.0 NO2 ≥ 75 th percentile (n=94) 28.7 -11.6 87.4 19.1 -11.6 60.6 pi: p interaction
Except for the variable of stratification, models were adjusted for age, sex, smoking habits and country living and took into account familial dependence.