HAL Id: hal-02136675
https://hal.sorbonne-universite.fr/hal-02136675
Submitted on 22 May 2019
HAL is a multi-disciplinary open access
archive for the deposit and dissemination of
sci-entific research documents, whether they are
pub-lished or not. The documents may come from
teaching and research institutions in France or
abroad, or from public or private research centers.
L’archive ouverte pluridisciplinaire HAL, est
destinée au dépôt et à la diffusion de documents
scientifiques de niveau recherche, publiés ou non,
émanant des établissements d’enseignement et de
recherche français ou étrangers, des laboratoires
publics ou privés.
Apostolos Malatras, Stéphanie Duguez, William Duddy
To cite this version:
Apostolos Malatras, Stéphanie Duguez, William Duddy. Muscle Gene Sets: a versatile methodological
aid to functional genomics in the neuromuscular field. Skeletal Muscle, BioMed Central, 2019, 9, pp.10.
�10.1186/s13395-019-0196-z�. �hal-02136675�
S O F T W A R E
Open Access
Muscle Gene Sets: a versatile
methodological aid to functional genomics
in the neuromuscular field
Apostolos Malatras
1,2,3, Stephanie Duguez
1,2and William Duddy
1,2*Abstract
Background: The approach of building large collections of gene sets and then systematically testing hypotheses across these collections is a powerful tool in functional genomics, both in the pathway analysis of omics data and to uncover the polygenic effects associated with complex diseases in genome-wide association study. The
Molecular Signatures Database includes collections of oncogenic and immunologic signatures enabling researchers to compare transcriptional datasets across hundreds of previous studies and leading to important insights in these fields, but such a resource does not currently exist for neuromuscular research. In previous work, we have shown the utility of gene set approaches to understand muscle cell physiology and pathology.
Methods: Following a systematic survey of public muscle data, we passed gene expression profiles from 4305 samples through a robust pre-processing and standardized data analysis pipeline. Two hundred eighty-two samples were discarded based on a battery of rigorous global quality controls. From among the remaining studies, 578 comparisons of interest were identified by a combination of text mining and manual curation of the study meta-data. For each comparison, significantly dysregulated genes (FDR adjustedp < 0.05) were identified.
Results: Lists of dysregulated genes were divided between upregulated and downregulated to give 1156 Muscle Gene Sets (MGS). This resource is available for download (www.sys-myo.com/muscle_gene_sets) and is accessible through three commonly used functional genomics platforms (GSEA, EnrichR, and WebGestalt). Basic guidance and recommendations are provided for the use of MGS through these platforms. In addition, consensus muscle gene sets were created to capture the overlap between the results of similar studies, and analysis of these highlighted the potential for novel disease-relevant findings.
Conclusions: The MGS resource can be used to investigate the behaviour of any list of genes across previous comparisons of muscle conditions, to compare previous studies to one another, and to explore the functional relationship of muscle dysregulation to the Gene Ontology. Its major intended use is in enrichment testing for functional genomics analysis.
Keywords: Gene sets, Skeletal muscle, Neuromuscular, Functional genomics, Pathway analysis, Functional enrichment, GWAS, Gene expression, Transcriptomics
© The Author(s). 2019 Open Access This article is distributed under the terms of the Creative Commons Attribution 4.0 International License (http://creativecommons.org/licenses/by/4.0/), which permits unrestricted use, distribution, and reproduction in any medium, provided you give appropriate credit to the original author(s) and the source, provide a link to the Creative Commons license, and indicate if changes were made. The Creative Commons Public Domain Dedication waiver (http://creativecommons.org/publicdomain/zero/1.0/) applies to the data made available in this article, unless otherwise stated.
* Correspondence:w.duddy@ulster.ac.uk
1Myologie Centre de Recherche, Université Sorbonne, UMRS 974 UPMC, INSERM, FRE 3617 CNRS, AIM, Paris, France
2Northern Ireland Centre for Stratified Medicine, Biomedical Sciences Research Institute, C-TRIC, Ulster University, Altnagelvin Hospital Campus, Glenshane Road, Derry/Londonderry BT47 6SB, UK
Background
Gene sets in functional genomics
A gene set is a list of genes that share a common feature. Examples include common pathway membership, shared dysregulation in a gene expression study, participation to the same protein complex, or sequence homology (reviewed [1]). Usage of the term overlaps with the con-cept of a molecular signature, which can take the form of a simple gene list or a more complex data structure, for example, including weightings for each gene. Gene sets, or molecular signatures, have been a key feature of major studies [2–5]. The approach of building large collections of gene sets and then systematically testing hypotheses across these collections is a powerful tool in functional genomics, both in the pathway analysis of omics data (reviewed [6,7]), and to uncover the polygenic effects as-sociated with complex diseases in genome-wide associ-ation study (GWAS) analyses (reviewed [8,9]).
Gene set analysis tools and gene set collections
A commonly used approach to pathway analysis is func-tional enrichment testing. In this approach, the gene set is considered to represent a biological function, and stat-istical tools are applied to test how this function behaves within the omics dataset under study. Functional enrich-ment tools often use a standard statistical method called Fisher’s exact test or the hypergeometric test, which evaluates whether the proportion of genes in a results list that also belongs to a given gene set is greater than expected by chance. An example of such a tool is EnrichR, which applies hypergeometric testing across a large variety of gene set collections relating to pathways, ontologies, transcriptional regulation, disease, and other biological themes [10]. The well-known DAVID tool takes a similar approach but also identifies clusters of enriched gene sets based on the proportion of genes that they share with one another [11]. More conceptually subtle approaches make use of the structure of omics data—for example, Gene Set Enrichment Analysis (GSEA) tests the distribution of each gene set within a list of genes that have been ranked based on their degree of differential expression between two experimental groups (from most strongly upregulated to most strongly downregulated) [12]. In GSEA, gene sets having their members clustered disproportionately (as determined by permutation-based statistics) within one region of the list are considered to be enriched, and a weighting is used to score more highly those regions representing strong upregulation or downregulation (i.e. the two ends of the distribution). GSEA and similar tools have re-cently been systematically compared [13]. Another tool, WebGestalt, provides multiple analytical approaches within a single framework [14].
Gene set analysis of GWAS data is a maturing field [8], with tools such as MAGMA [15], MAGENTA [16], and others enabling the discovery of genome-wide path-way associations in a number of diseases [16–18]. Whereas classic GWAS seeks to identify associations to one or more single nucleotide polymorphisms (SNPs), gene set approaches summarize SNPs by gene and then by gene set. This improves the power to detect statisti-cally significant associations both because collapsing in-dividual SNPs into gene sets results in fewer statistical tests performed and because individual weak effects can be combined to produce a strong association signal [9].
A widely used collection of gene sets is the Molecular Signatures Database, MSigDB [19, 20], which is divided into eight major collections. These include curated gene sets from pathway databases such as KEGG [21], the Gene Ontology (GO) [22], and genes with shared regula-tory motifs or chromosomal positions. Importantly, in the context of the present work, MSigDB also includes collections of genes having shared dysregulation in can-cer or immunologic gene expression studies. These last two collections,‘oncogenic signatures’ and ‘immunologic signatures’ have been created by systematic analyses of relevant datasets from the Gene Expression Omnibus (GEO) [23], enabling researchers to compare later tran-scriptional datasets across hundreds of previous studies [24], and thereby contributing to leading publications in their field [25,26].
Gene sets for functional genomics in the study of skeletal muscle tissue and neuromuscular pathology
Functional genomics is integral to the current study of skeletal muscle tissue and neuromuscular pathology, as evidenced by the vast quantities of omics data now gen-erated by researchers in this field. Considering RNA ex-pression alone, a simple search of ‘skeletal AND muscle’ in the ArrayExpress database returns more than 1000 separate experimental studies of gene/transcript and microRNA expression [27]. These studies frequently make use of pathway analysis approaches, but this is done without the aid of gene set collections of the subject-specific type that have been beneficial to re-searchers in the fields of oncology and immunology.
In prior work, we have extracted gene sets from pub-lished muscle gene expression data and applied these for analytical purposes in three previous studies: (1) In a study of human myotubes from old compared to young subjects, we found a similar profile of dysregulation to that observed in previous gene expression studies of myoblast differentiation, despite that the fusion index of old myotubes was unaffected—this led to the discovery of a failure of re-quiescence in elderly myoblast cultures, and the identification of SPRY1 methylation as an underlying mechanism, with resultant loss of the stem
cell pool having a potential role in sarcopenia [28]. (2) In an analysis showing that the procedure of hTERT/cdk4 immortalization did not impact on the skeletal muscle characteristics of human myoblasts, we studied the ex-pression levels of consensus sets of genes that were up-or downregulated consistently across multiple studies of muscle differentiation [29]. (3) A collection of muscle gene sets was also used to aid in the characterization of a murine model of Annexin A2 knockout, to better understand the role of this protein in sarcolemmal repair and dysferlinopathy [30]. These studies demonstrated the utility of muscle-specific gene sets for functional genomics analyses.
Muscle Gene Sets
Here, we report the creation of the Muscle Gene Sets (MGS) resource (sys-myo.com/muscle_gene_sets), a col-lection of gene sets extracted from expression studies of skeletal muscle cells and tissues, and a smaller number of cardiac studies. These relate to various aspects of muscle molecular physiology and pathology, including myopathies, cardiomyopathies, metabolism, exercise, ageing, development, regeneration, and others. The MGS can be accessed through the site itself and also through three analytical tools—Enrichr, MSigDB/GSEA, and WebGestalt. We also generated consensus gene sets, identifying genes that are commonly dysregulated in the same experimental comparison across multiple different studies.
Methods/implementation
Microarray data collection
Data were downloaded from public gene expression re-sources, ArrayExpress and Gene Expression Omnibus (GEO). Although ArrayExpress mirrors GEO, the mir-roring is not perfect, so we searched both repositories for striated muscle (skeletal and cardiac), cells, and cell line experiments. In this initial screening, we found that the most abundant microarray chips used for muscle-related experiments were Affymetrix Human Genome U133 Plus 2.0 GeneChip (GPL570 GEO plat-form or A-AFFY-44 ArrayExpress ID) for human and Affymetrix Mouse Genome 430 2.0 GeneChip (GPL1261 GEO platform or A-AFFY-45 ArrayExpress ID) for mur-ine samples. In order to maintain a homogenous analyt-ical approach, we narrowed down our next search to these two platforms, which represent about 50% of all muscle arrays on both repositories.
We searched ArrayExpress and GEO using the follow-ing strfollow-ing: (muscle(s) OR myoblast(s) OR myotube(s) OR myofiber(s) OR cardiomyocyte(s) OR myocyte(s) OR heart(s) OR C2C12 OR HSMM OR HL1 OR G8 OR SOL8) AND A-AFFY-44 for human and (muscle(s) OR myoblast(s) OR myotube(s) OR myofiber(s) OR
cardiomyocyte(s) OR myocyte(s) OR heart(s) OR C2C12 OR HSMM OR HL1 OR G8 OR SOL8) AND A-AFFY-45 for mouse organisms. However, it is getting more and more usual for researchers to use an alternative probe to gene mapping file, called Chip Description File (CDF), than the original from Affymetrix, for better probe to probeset and probeset to gene targeting accuracy. GEO and ArrayExpress assign a unique GPL or ID key re-spectively for each of the alternative GEO platforms or ArrayExpress IDs while microarray chips remain the same. In order to find the alternative platforms, GEO provides a list of them on the original platform GPL, but this is not well maintained and many are missing. A more certain way to identify them is to search on ArrayExpress (which is manually curated) for alternative IDs. On ArrayExpress’s browse page (https://www.ebi.ac.
uk/arrayexpress/arrays/browse.html), we searched for
U133 Plus 2.0, MG 430 2.0 and retrieved all the alterna-tive GEO platforms and IDs to A-AFFY-44 (GPL570) for human and to A-AFFY-45 (GPL1261) for mouse.
Next, we parsed their MIAME [31] conformed meta-data by text mining and confirmed them manually, selecting only those pertinent to muscle research. We excluded all series that did not include the raw CEL files (Affymetrix fluorescence light intensity files) in order to homogenize the data even further by preprocessing all raw files with a robust pre-processing and data analysis pipeline [32].
Affymetrix microarray quality assessment
Despite that the arrays are published and have already passed quality controls (QCs), these QC steps have been applied differently by different authors. For this reason, we performed a global quality control using a battery of Bioconductor [33, 34] packages: ‘simpleaffy’ [35], ‘affyQ-CReport’, and ‘affyPLM’ [36], using the MAS 5.0 algo-rithm [37] and the Affymetrix default Chip Description File (CDF). We used the Affymetrix chip embedded sin-gle array quality metrics for each sample, such as aver-age background, scale factor, the percentaver-age of genes called present, and 3′ to 5′ RNA hybridization ratios for β-actin and GAPDH. We also used two multi-array quality metrics for each series, Normalized Unscaled Standard Error (NUSE) and Relative Log Expression (RLE). As a general guideline, we followed Affymetrix recommended thresholds: differences in average back-ground per sample not higher than 20, scale factor within a threefold change of one sample to another, no higher than 10% difference of percent present genes and 3′ to 5′ ratio threshold of GAPDH to 1.25 and β-actin to 3. Also, the NUSE boxplots should be centered on 1 with bad-quality samples ranging above 1.1. Samples were also deemed as low quality if they had globally higher spread of NUSE distribution than others. Because
it is assumed that most probes are not changed across the arrays, the ratio of probeset expression and the me-dian probeset expression across all samples of a series are expected to be around 0 on a log scale. The RLE boxplots presenting the distribution of these log ratios should be centered near 0 and have similar spread with low-quality samples having a spread higher than 0.2. Ar-rays that had extreme values or were above our set thresholds on the combined QCs were not used for any further analysis. In total, we removed 160 human and 122 mouse samples. In our case, percent present and RLE performed better than the other metrics, as also re-ported by McCall et al [38].
Data normalization
Pre-processing algorithms, usually termed normalization algorithms, are three-step processes: background correc-tion, normalizacorrec-tion, and probe summarization. The ar-rays that passed quality controls were pre-processed with the Robust Multi-array Average algorithm [39], with default parameters except for the CDFs that were downloaded from BrainArray ENSG version 20.0.0 [40].
Probes to gene mapping
The microarray Affymetrix GeneChips we collected to create the MGS are the most abundantly used chips for human and mouse microarray experiments. However, their selection of probes relied on early genome and transcriptome annotation (2003–2004) which is signifi-cantly different from our current knowledge. Most of the genes on the microarray chips are usually repre-sented by a few probesets, and in many cases, a probeset could target multiple genes. Probesets that target a gene could exhibit wildly different expression levels making downstream analysis challenging. Dai et al. had foreseen these limitations and created the BrainArray portal [40] where they reorganize probes with up-to-date genome, cDNA, and single nucleotide polymorphisms (SNPs) in-formation in order to create a more accurate and precise CDF, which is widely used in gene mapping [41]. Brai-nArray’s CDF is updated annually with most microarray algorithms and tools supporting its CDF by default.
Allocation of samples to comparisons of interest
Sample meta-data were mined from GEO or ArrayEx-press and manually inspected to allocate samples to comparisons of interest, as well as to name each com-parison. During this manual process, reference was fre-quently made to the original GEO pages for individual samples, and often back to the publication associated to the data, in order to confirm sample designations and points of methodology. In cases where the relevant char-acteristic of samples could not be clearly established, the
comparison was not used. Selected comparisons were taken forward to differential expression analysis.
Differential expression analysis and gene mapping
We used the‘limma’ package [42,43] for differential ex-pression analysis. We included into gene sets all genes with Benjamini-Hochberg FDR adjusted p value < 0.05 for each experimental comparison, up to a maximum of 300 genes, taking the top 300 after ranking by the sig-nificance of differential expression (Limma’s B statistic). Before the eBayes step, we also removed 25% of the genes that had the lowest average expression values. To map Ensembl gene IDs to gene symbols, we used Ensembl BioMart [44]. We extracted the required infor-mation from GRCh38.p5 assembly for human and GRCm38.p4 assembly for mouse. Following the standard of MSigDB, standard gene names were used that are ap-proved by the Human Gene Nomenclature Committee (HGNC) and Mouse Genome Informatics (MGI) groups.
Batch effect correction
For batch effect identification and correction, we used the surrogate variable analysis (sva) algorithm [45] from the ‘SVA’ Bioconductor package [46]. We used the ‘leek’ method to detect the number of surrogate variables, if present, but we also set a limit of up to two surrogate variables to avoid overcorrecting the data. The sva algo-rithm found and corrected technical variation in 256 out of a total of 578 experiments.
Consensus set enrichment analysis
Genes of selected consensus sets were tested for enrich-ment against the Gene Ontology sections, biological pro-cesses, and cell compartments, using the EnrichR tool.
Contents of the MGS website
The full downloadable MGS collection includes 1517 gene sets: 1156 gene sets from the current work, which for com-pleteness include 245 empty gene sets for which no signifi-cantly differentially expressed genes were identified; 122 gene sets derived from post-2005 studies of myoblasts and myotubes, referenced in our previous work [29]; 185 gene sets extracted from a previous meta-analysis of early muscle microarray data (pre-2005; [47]); and 54 gene sets identified by searching for muscle-relevant terms within the MSigDB collections (mostly comprising muscle-related pathways from Reactome or Biocarta databases and omitting any gene sets that could duplicate those created in the present analysis).
Results
Creation of gene sets
Following a systematic survey of public gene expression data repositories, we downloaded raw expression data
from 302 studies of muscle gene expression, including 4305 separate samples. After robust pre-processing through a standardized data analysis pipeline, 282 samples were discarded based on a battery of rigorous global qual-ity controls. From among the remaining studies, 578 com-parisons of interest were identified by a combination of text mining and manual curation of the study meta-data. For each comparison, significantly dysregulated genes (FDR p < 0.05) were identified and divided into two lists of up to 300 each: those that were most significantly upregu-lated and those that were most significantly downregu-lated. Each of these 1156 lists was considered a Muscle Gene Set and was given a name tag intended to be both succinct and readily understandable (Fig.1).
The primary format in which the MGS collection is stored is as a gmt file of the type used by MSigDB [19] and GSEA [12]. This is a tab-delimited plain text format in which each gene set is represented by a new line. The name of the gene set is given first, followed by an informa-tion field that includes an identifier (usually a GEO or ArrayExpress series number) linking back to the original data source. Member genes of the gene set are then listed.
Content of the MGS collection
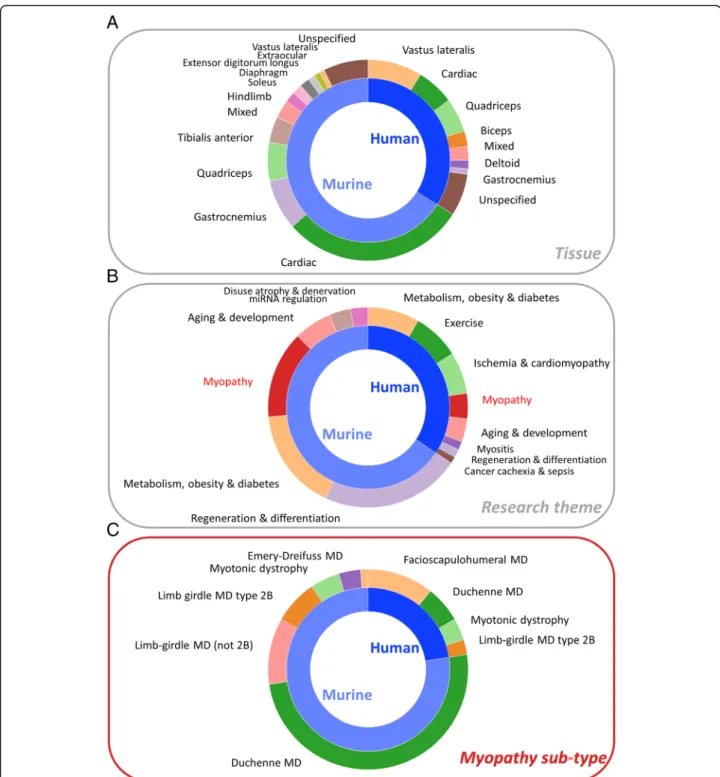
Each muscle gene set represents either the up- or down-regulated genes from a single comparison within a gene expression study. The studies included human or murine muscle tissues and cells, and the comparisons are made between different muscle tissues, ages and developmen-tal stages, pathologies, experimendevelopmen-tal treatments, and genetic interventions. A breakdown of the composition of the MGS by tissue, research theme, and type of myop-athy is shown in Fig.2.
Murine studies accounted for 65.9% of muscle gene sets, being about twice as common as human studies (34%), and cardiac-related gene sets accounted for a
large proportion (44.7%) of these (Fig. 2a). Of skeletal muscle gene sets, murine samples were frequently (22.4%) derived from the gastrocnemius, which was rela-tively rarely studied (3.2%) in humans. Conversely, the vastus lateralis was the most common origin of human muscle gene sets, while this muscle is not much studied in mice. We also tagged gene sets according to specific research themes (Fig. 2b). Many murine gene sets were related to regeneration and/or differentiation, largely due to studies of C2C12 myoblasts. A substantial pro-portion of both human (23.9%) and murine (24.7%) gene sets relates to studies of metabolism, obesity, and/or dia-betes, while gene sets relating to exercise are almost all derived from human studies. Myopathies accounted for 11.8% and 21.1% of human and murine gene sets, with other common research themes including ageing and de-velopment, miRNA regulation, disuse atrophy, cancer cachexia, and sepsis.
Among myopathy-related gene sets (Fig.2c), precisely 50% are derived from a large number (~ 40) of studies of the murine model (mdx) of Duchenne muscular dys-trophy (DMD). DMD also accounted for 26% of human myopathy gene sets, although in humans facioscapulo-humeral muscular dystrophy (FSHD) had the most com-monly studied gene expression, accounting for 47% of human myopathy gene sets. Limb-girdle muscular dys-trophy type 2B (LGMD2B) and the myotonic dystrophies (DM1 and DM2) account for around 10% each of hu-man and murine myopathy gene sets, while a small number of gene sets were derived from murine studies of other limb-girdle muscular dystrophies and of Emery-Dreifuss muscular dystrophy (EDMD).
Consensus Muscle Gene Sets
Since comparisons of similar conditions were sometimes carried out in multiple different published studies, we
Fig. 1 Naming convention for Muscle Gene Sets. Each name was chosen to be both succinct and readily understandable. This was not an automated process—consideration was given to the name of each gene set. The first segment, before the triple underscore, has the generic form‘up_in_Group1_v_Group2’ or ‘down_in_Group1_v_Group2’, referring to genes that were up- or downregulated in the comparison of group 1 (e.g. mdx) to group 2 (e.g. WT), for which‘up’ indicates greater expression in group1 compared to group2, and ‘down’ means lesser expression in group1. Following the triple underscore, species name is then given, then age/timepoint and/or tissue description and/or gender (in any order). Finally, each gene set is given a MGS ID number. List of time abbreviations used: h = hour(s); d = day(s); wk. = week(s); mo = month(s); y = year(s). List of other abbreviation conventions used (ordered by appearance in the complete MGS gmt file): ctl = control; WT = wild-type; gastroc/ gastr = gastrocnemius muscle; DMD = Duchenne muscular dystrophy; quad = quadriceps muscle; skel = skeletal; dysf = dysferlinopathy; EDMD = Emery-Dreifuss muscular dystrophy; EDL = extensor digitorum longus muscle; TA/tib_anterior = tibialis anterior muscle; diff = differentiation/ differentiated (of myotubes); prim = primary cells; vast_lat/vastus_lat = vastus lateralis; KO = knock-out; mir = microRNA. Some study-specific abbreviations are used, which are assumed to be understandable from context or occasionally requiring reference to the source GEO entry indicated in the information column of the gmt file
created high-confidence consensus sets containing only those genes that were consistently dysregulated in the same direction for the same comparison across those studies. For this purpose, we manually identified 250
gene sets belonging to 14 different comparisons (Table1), each comparison having a minimum of 8 gene sets (4 upregulated and 4 downregulated). For each com-parison, we identified genes that were consistently
Fig. 2 Proportional composition of the MGS collection broken down by tissue type, research theme, and myopathy sub-type, for human and murine species. a Tissue types. Shown are all tissue categories containing 10 or more gene sets.‘Mixed’ indicates that the comparison is between different tissue types (e.g. gastrocnemius vs vastus lateralis). The‘unspecified’ category indicates gene sets from studies in which the specific muscle tissue was not given in the published work. b Research themes. Shown are all themes containing 10 or more gene sets. c Myopathy sub-types. These are sub-categories of the myopathy set in b. All are shown
upregulated, downregulated, or dysregulated (and in the same direction). For each of these 3 cases (up, down, and same), we created consensus sets for genes shared by at least 30%, 50%, or 70% of the gene sets, giving a total of 9 consensus sets for each comparison.
In general, consensus sets consisted of genes that would be expected according to previous literature. For example, functional analysis of 39 consensus genes that were dysregulated by a high-fat diet in murine skeletal muscle (Additional file 1: Figure S1A), drawn from 18 gene sets from 7 different published studies, showed up-regulation of fatty acid oxidation and the mitochondria, these two processes being driven by upregulated mito-chondrial genes ACADVL (very long-chain specific acyl-CoA dehydrogenase), ACAA2 (3-ketoacyl-CoA thiolase), ECI1 (Enoyl-CoA delta isomerase 1), ACADM (medium-chain specific acyl-CoA dehydrogenase), HADH (hydroxyacyl-coenzyme A dehydrogenase), DECR1 (2,4-dienoyl-CoA reductase), and ACAT1 (Acet-yl-CoA acetyltransferase). Change to expression levels of fatty acid oxidation genes was also the major process enriched 1 day following exercise in human skeletal muscles (Additional file1: Figure S1B).
Expectedly, myotube differentiation up to 9 h consist-ently involved changes in the expression patterns of genes involved in chromatin remodelling (Add-itional file 1: Figure S1C), which was succeeded at 12–
24 h (Additional file 1: Figure S1D) by changes in cell cycle gene regulation, with significant but less pro-nounced enrichment of sarcoplasmic reticulum (SR) and calcium channel genes. After 2 or more days of mat-uration, the dominant dysregulated process (compared to day 0) was muscle contraction (Additional file 1: Figure S1E).
More notably, in Duchenne muscular dystrophy com-pared to healthy controls, alongside expected observa-tions such as downregulation of the dystrophin-associated protein complex and upregulation of extracellular matrix components expected as a result of fibrosis, what may be surprising is the extent to which lysosomal genes were consistently found to be upregu-lated (Additional file 1: Figure S1F). Of 84 consensus genes upregulated in 50% or more of DMD vs healthy comparisons in human skeletal muscle, 11 lysosomal genes were present (enrichment FDR p value 0.00002). Four of these genes overlapped with the upregulated extracellular matrix genes, but enrichment of the lyso-some was still significant (FDR < 0.0001) when these 4 genes were omitted from the analysis. Very similar en-richment results emerged from consensus genes in the mdx murine model of DMD, with strong enrichment of the lysosomal/ER lumen (Additional file1: Figure S1H). This was driven by a different set of genes in mouse than in humans; the only lysosomal gene shared between human and murine consensus sets was LGMN, which encodes Legumain, a protein which hydrolyzes asparagi-nyl bonds in lysosomal protein degradation.
Other comparisons for which consensus sets were iden-tified included 6 studies of human and murine dysferlino-pathy versus healthy, for which neutrophil-mediated immunity and vacuolar/lysosomal lumen were the most strongly dysregulated process and component, respect-ively, each being upregulated (Additional file 1: Figure S1I). Ageing compared to young human skeletal muscle across 8 studies resulted in changes to mitochondrial ATP synthesis coupled proton transport and regulation of RNA transcription and, less expectedly, changes to regulation of neuron apoptotic process, although this latter enrichment
Table 1 Consensus muscle gene sets
Category Consensus set name (indicating tissue type and comparison) # Muscle Gene Sets Aging and development HumanSkelMusc_Aging_v_Young 16 (8 up, 8 down)
MurineSkelMusc_12orMoreMonths_v_1to5Months 8 (4 up, 4 down) MurineSkelMusc6WkOrOlder_Mdx_v_Healthy 36 (18 up, 18 down) Differentiation MurineMyotube_12to24hDiff_v_Undiff 14 (7 up, 7 down)
MurineMyotube_2orMoreDaysDiff_v_Undiff 38 (19 up, 19 down) MurineMyotube_9hOrLessDiff_v_Undiff 18 (9 up, 9 down) Disuse AnySpeciesSkelMusc_AtrophyDisuseOrInactivated_v_Control 28 (14 up, 14 down) Exercise HumanSkelMusc_1DayOrLessAfterExercise_v_Before 18 (9 up, 9 down)
HumanSkelMusc_8wkOrMoreAfterResistanceTraining_v_Before 12 (6 up, 6 down) Metabolism HumanSkelMusc_Type2_Diabetes_v_Healthy 10 (5 up, 5 down) MurineSkelMusc_HighFatDiet_v_Control 18 (9 up, 9 down) Myopathy HumanOrMurineSkelMusc_Dysferlinopathy_v_Control 12 (6 up, 6 down) HumanSkelMusc_DMD_v_Healthy 8 (4 up, 4 down) MurineSkelMusc_Calpainopathy_v_Healthy 14 (7 up, 7 down)
was due to only 2 genes (PRNP and FOXO3) (Add-itional file 1: Figure S1J). The most frequently recurring impact of resistance training in 6 human studies was changes to expression of collagens, which drove enrich-ment of both extracellular matrix reorganization and of endoplasmic reticulum lumen (Additional file 1: Figure S1K). Changes to expression of collagens were also the main consistent feature of murine skeletal muscle ageing in 4 studies comparing 12 or more months against 1 to 5 months old (Additional file1: Figure S1L).
Several attempts to generate consensus sets failed due to low overlap between the results of different studies. No genes were dysregulated in the same direction in 2 or more out of 5 studies of human type 2 diabetes vs healthy (Additional file1: Figure S1M). Across 7 studies of murine calpainopathy, only 12 genes were consistently dysregulated in 30% or more of the studies, and these 12 genes were not significantly enriched for any biological process or cell component (Additional file 1: Figure S1N). Only 4 genes were consistently dysregulated in 30% or more of 14 studies of muscle atrophy, disuse, or inactivation, although here we did not attempt to gener-ate consensus lists for human and murine separgener-ately (Additional file1: Figure S1O).
Accessibility and implementation of the Muscle Gene Sets in functional genomics analysis
The MGS repository, including the complete collection of MGS as well as, separately, the consensus sets, is available for download in .gmt format from our Sys Myo site (at https://www.sys-myo.com/muscle_gene_sets/). We have also worked with other developers to include the MGS in two online functional genomics analysis tools, EnrichR [10] and WebGestalt [14].
The MGS is currently the last listed collection in EnrichR’s ‘Crowd’ category. Using EnrichR, it is very straightforward to submit a query list of gene names of interest and carry out functional enrichment testing to determine whether the query list is enriched for any of the muscle gene sets. This facilitates rapid screening of any list of genes against the genes that were dysregulated in each of the previous muscle studies of gene expression.
Analysis using the MGS in WebGestalt is achieved by selecting either hsapiens or mmusculus as the organism of interest, the Overrepresentation Enrichment Analysis (ORA) or Gene Set Enrichment Analysis (GSEA) as the method of interest, and selecting community-contributed functional database. The MGS collection is then select-able, and a list of genes can be uploaded for enrichment testing against the MGS.
The .gmt format in which we provide the MGS gene set collection was originally developed for the GSEA tool [12] (http://software.broadinstitute.org/gsea/), and a
large variety of gene set collections are available in this format for download from the Molecular Signatures Database (MSigDB [19]). MSigDB are now listing gene sets from community contributors, of which MGS is the first listed (http://software.broadinstitute.org/gsea/
msigdb/contributed_genesets.jsp). Enrichment testing
can be carried out on the MGS collection using the GSEA software by uploading the MGS .gmt file as a local gene matrix from within the GSEA software’s gene set database selection dialogue. We note that it is also possible to concatenate .gmt files using a text editor or scripting language, and it can be of interest to compare, for instance, enrichment results of Gene Ontology terms against those of the MGS. To facilitate deeper functional interpretation of the results, the output from GSEA can be visually displayed using the Enrichment Map plugin [48] for Cytoscape, for example, to examine the overlap of enriched MGS with enriched GO terms, as we have done previously [28,30].
Discussion
According to developed principles for the organization of gene sets [1], MGS are phenotypic-level gene sets in which genes share actual connections in the form of dif-ferential expression in the same transcriptomic compari-son. The MGS resource can be used to investigate the behaviour of any list of genes across > 1100 previous comparisons of muscle conditions, to compare previous studies to one another, and to explore the functional re-lationship of muscle dysregulation to the gene ontology. Its major intended use is in enrichment testing for func-tional genomics analysis, for which purpose it has been made accessible through three commonly used analytical tools (GSEA, EnrichR, and WebGestalt).
Optimal usage
Various statistical approaches are used for gene set en-richment analysis, and their performances have been evaluated and usage guidelines established [49]. GSEA is an active field in which new methods are being devel-oped, such as to identify gene sets that are specifically enriched in one experiment among a large set of experi-ments [50]. An important advantage of gene sets in ex-pression pattern analysis is that they enable the identification of gene groups whose constituents show subtle but coordinated expression changes, which might not be detected by the usual individual gene analysis [51]. We consider that the GSEA algorithm is particu-larly suited to this as it can detect subtle shifting of a gene set within a differential expression profile, and be-cause it profiles across the entire expression matrix, it is not dependent on an arbitrary statistical cut-off to dis-tinguish dysregulated from unaffected genes. Of the dif-ferent methods to use the MGS, we consider that a very
powerful approach is to concatenate the MGS with the Gene Ontology (or another functional annotation such as Reactome or KEGG pathways), then test a ranked query gene list against this concatenated gene set collec-tion using the GSEA tool, and visualize the results using the enrichment mapping plugin for Cytoscape. This ap-proach, which we have adopted in previous work [28,
30], makes it possible not only to identify the overlap of query genes with previous muscle studies, but also to understand the overlap of previous muscle studies with elements of the Gene Ontology, including biological pro-cesses and cell compartments, which greatly aids in the understanding of what the enrichment results mean, helping to interpret them in their biological context.
However, for rapid enrichment testing of a gene list against the MGS collection, without deeper analysis of overlap between gene sets, both EnrichR and WebGes-talt are very convenient and robust resources and are preferable in many instances due to their speed and rela-tive ease of use. It should also be noted that EnrichR’s z-score approach is an improvement over the standard Fisher’s/hypergeometric enrichment test and that the WebGestalt pipeline offers multiple implementations of enrichment testing each with specific advantages.
Consensus muscle gene sets
In creating the MGS resource, we have observed that many of the hundreds of published skeletal muscle gene expression studies have made similar experimental or pathology-relevant gene expression comparisons or identi-fied overlapping sets of dysregulated genes. The MGS pro-vides an opportunity for in-depth study of this overlap, which may reveal new insights into skeletal muscle path-ology. We have previously used a consensus MGS to study differentiation in immortalized myoblasts [29].
For instance, an intriguing observation was that lyso-somal genes were the most consistently upregulated cell compartment across studies of DMD compared to healthy skeletal muscle. This was true for consensus sets of both human DMD and the murine Mdx model of DMD. Among the publications associated to these data, the lysosome was discussed only rarely [52], with attention usually focused on more general inflammatory/immune response or on other pathways such as calcium homeosta-sis and fibrohomeosta-sis (extracellular matrix), although upregula-tion of specific lysosomal genes was reported in 2 human studies (lysosomal acid lipase, cholesteryl ester hydrolase (LIPA) and lysozyme [53]; lysosomal-associated trans-membrane protein 5 (LAPM5) [54]) and in 2 murine stud-ies (Lysosome M [55]; Lysozyme [56]). Since the DMD and Mdx consensus sets are drawn from studies of whole muscle tissue, a trivial explanation could be the infiltration of immune cells that is associated with muscle wasting in the disease, and indeed, we observe an enrichment of T
cell proliferation and lymphocyte migration among the consensus upregulated genes. However, it has been ob-served that lysosomal-associated membrane protein, LAMP1, and other vesicular trafficking proteins are over-secreted from DMD myotubes and that disturbance of protein export may make a low-level chronic contribution to DMD pathology [57].
Lysosomal upregulation was also a feature of the dys-ferlinopathy consensus MGS. Upregulation of the lyso-some has not been reported in the literature specifically for dysferlinopathy, although it has been reported as a common feature of muscular dystrophies in a previous gene expression meta-analysis [58], and previous studies of dysferlinopathy have reported dysregulation of specific lumen proteins such as Cathepsin K [59] and Cathepsin S [60]. Similarly to DMD, this could be due to immune cell infiltration or to gene expression changes in the muscle fibres themselves.
Limitations and perspectives
This analysis captures and summarizes more than 300 studies of muscle gene expression published in the period 2005–2016, and the full MGS collection available for download extends back from 2005 thanks to a previ-ous meta-analysis by Jelier et al. [47]. This does mean that more recent studies are not yet represented. We es-timate there could be upwards of 50 new studies since we completed our data curation step. Included among these are a rising number of RNA-Seq-based expression analyses. It will be important to capture these newer studies in future work. The inclusion of RNA-Seq stud-ies will be difficult for the immediate future as they re-quire large computational resources. Given current hardware costs, re-analysis is possible by a small team with limited resources on a per-study basis, but would be challenging to carry out on a systematic multi-study basis, if the analysis goes back to using raw read data. By comparison, it is possible to process very large numbers of microarray samples with only moderate computa-tional demands. We welcome efforts to automate or semi-automate gene set extraction [61–63], which can help in this task, but we note that these require the use of expression matrices that have been supplied to GEO/ ArrayExpress by the team making the data submission and therefore depend on the data processing steps car-ried out by each team, whereas we chose to re-analyse raw probe intensities (.CEL files). We considered this to be of strong importance in order to standardize data processing and quality control. Interesting methods are also being developed for the extraction of gene sets from literature text mining [64].
Gene sets for pre-2005 muscle studies are included in the full downloadable MGS collection. These were ob-tained from a very thorough previous review and
meta-analysis [47] in which gene sets were extracted from publication tables and other sources. The raw data were not re-analysed directly by the authors of the meta-analysis, and a variety of different technological platforms were used by the authors of each study. This is understandable because, especially at that time, micro-array platforms were considerably more disparate, so it would have been less useful to focus the meta-analysis on the market-leading platform, as we have been able to do, and normalizing across technological platforms is notoriously difficult [65, 66]. Although we believe there is value in the comparison across these pre-2005 studies collectively (and this is supported by the very interesting meta-analysis that was previously performed on them), due to improvements in microarray technology since 2005, we would urge caution in close interpretation of any given gene from these studies, or any given study treated alone.
We did not extend our analysis to proteomic data— this would be interesting in future work as protein levels more closely reflect the activities of biological pathways. It would also be interesting to systematically cross-relate gene expression to proteomic studies in order to identify which muscle transcripts consistently serve as faithful markers of the proteins that they encode.
Future work could allow selection by keyword, or au-tomated subsetting of the MGS, similarly to that facili-tated by the MSigDB resource for its current collections, and perhaps by incorporation of the MGS into the MSigDB, if that becomes an option that MSigDB would provide to community contributors.
Conclusions
The MGS resource has multiple applications as a re-search aid in the study of muscle physiology and disease and should be a useful and versatile tool for functional genomics analysis in the neuromuscular field.
Additional file
Additional file 1:Summary information for consensus muscle gene sets. (PDF 936 kb)
Abbreviations
CDF:Chip Description File; DM1/DM2: Myotonic dystrophies types 1 and 2; DMD: Duchenne muscular dystrophy; EDL: Extensor digitorum longus muscle; EDMD: Emery-Dreifuss muscular dystrophy; FDR: False discovery rate; FSHD: Facioscapulohumeral muscular dystrophy; GEO: Gene Expression Omnibus; GSEA: Gene Set Enrichment Analysis; GWAS: Genome-wide association study; KO: Knock-out; LGMD2B: Limb-girdle muscular dystrophy type 2B; MGS: Muscle Gene Sets; MIAME: Minimum information about a microarray experiment; MSigDB: Molecular Signatures Database;
NUSE: Normalized Unscaled Standard Error; QC: Quality controls; RLE: Relative Log Expression; SNP: Single nucleotide polymorphism; TA: Tibialis anterior muscle; WT: Wild-type
Acknowledgements
AM was supported by the MyoGrad International Graduate School for Myology.
Software information
Project name: Muscle Gene Sets (MGS)
Project home page:www.sys-myo.com/muscle_gene_sets Operating system(s): Platform independent
Programming language: Computational resource provided as a .gmt file Other requirements: None
License: Not applicable
Any restrictions to use by non-academics: None
Dedication
We would like to remember our colleague Nicolas Martin, who made important contributions to the MGS collection while living with Duchenne muscular dystrophy.
Funding
This work was supported by the Association Française contre les Myopathies (AFM) and by Ulster University. It has also been supported by an Invest Northern Ireland R&D Grant (RDO0712612) (PWH) and by a grant (AJB) from European Union Regional Development Fund (ERDF) EU Sustainable Competitiveness Programme for N. Ireland, Northern Ireland Public Health Agency (HSC R&D).
Availability of data and materials
The datasets generated during the current study are available from the Muscle Gene Sets website (www.sys-myo.com/muscle_gene_sets).
Authors’ contributions
WD conceived and managed the study. AM carried out the bioinformatics analyses with contribution from WD. AM and WD created and managed the website. WD wrote the manuscript, with contributions from AM and SD. All authors read and approved the final manuscript.
Ethics approval and consent to participate Not applicable
Consent for publication Not applicable
Competing interests
The authors declare that they have no competing interests.
Publisher’s Note
Springer Nature remains neutral with regard to jurisdictional claims in published maps and institutional affiliations.
Author details
1Myologie Centre de Recherche, Université Sorbonne, UMRS 974 UPMC, INSERM, FRE 3617 CNRS, AIM, Paris, France.2Northern Ireland Centre for Stratified Medicine, Biomedical Sciences Research Institute, C-TRIC, Ulster University, Altnagelvin Hospital Campus, Glenshane Road, Derry/Londonderry BT47 6SB, UK.3Department of Biological Sciences, Molecular Medicine Research Center, University of Cyprus, 1 University Avenue, 2109 Nicosia, Cyprus.
Received: 6 March 2019 Accepted: 9 April 2019
References
1. Li W, Freudenberg J, Oswald M. Principles for the organization of gene-sets. Comput Biol Chem. 2015;59:139–49 Available from:https://linkinghub. elsevier.com/retrieve/pii/S1476927115000559.
2. Zid BM, O’Shea EK. Promoter sequences direct cytoplasmic localization and translation of mRNAs during starvation in yeast. Nature. 2014;514:117–21 Available from:http://www.nature.com/articles/nature13578.
3. Katayama Y, Nishiyama M, Shoji H, Ohkawa Y, Kawamura A, Sato T, et al. CHD8 haploinsufficiency results in autistic-like phenotypes in mice. Nature. 2016;537:675–9 Available from:http://www.nature.com/articles/nature19357.
4. Erstad DJ, Fuchs BC, Tanabe KK. Molecular signatures in hepatocellular carcinoma: a step toward rationally designed cancer therapy. Cancer. 2018; 124:3084–104 Available from:http://doi.wiley.com/10.1002/cncr.31257. 5. Ruppert V, Maisch B. Molecular signatures and the study of gene expression
profiles in inflammatory heart diseases. Herz. 2012;37:619–26 Available from: http://link.springer.com/10.1007/s00059-012-3662-5.
6. García-Campos MA, Espinal-Enríquez J, Hernández-Lemus E. Pathway analysis: state of the art. Front Physiol. 2015;6 Available from:http://journal. frontiersin.org/Article/10.3389/fphys.2015.00383/abstract.
7. Wu X, Al HM, Chen JY. Pathway and network analysis in proteomics. J Theor Biol. 2014;362:44–52 Available from:http://linkinghub.elsevier.com/retrieve/ pii/S002251931400304X.
8. Wang Y-Y, Wang Z-X, Hu Y, Wang L, Li N, Zhang B, et al. Current status of pathway analysis in genome-wide association study. Yi chuan = Hered. 2017;39:707–16 Available from:http://www.ncbi.nlm.nih.gov/pubmed/ 28903898.
9. Mooney MA, Nigg JT, McWeeney SK, Wilmot B. Functional and genomic context in pathway analysis of GWAS data. Trends Genet. 2014;30:390–400 Available from:http://linkinghub.elsevier.com/retrieve/pii/
S0168952514001164.
10. Chen EY, Tan CM, Kou Y, Duan Q, Wang Z, Meirelles GV, et al. Enrichr: interactive and collaborative HTML5 gene list enrichment analysis tool. BMC Bioinformatics. 2013;14:128 Available from:http://www.ncbi.nlm.nih.gov/ pubmed/23586463.
11. Huang DW, Sherman BT, Lempicki RA. Systematic and integrative analysis of large gene lists using DAVID bioinformatics resources. Nat Protoc. 2009;4: 44–57 Available from:http://www.ncbi.nlm.nih.gov/pubmed/19131956. 12. Subramanian A, Tamayo P, Mootha VK, Mukherjee S, Ebert BL, Gillette MA,
et al. Gene set enrichment analysis: a knowledge-based approach for interpreting genome-wide expression profiles. Proc Natl Acad Sci U S A. 2005;102:15545–15550. [cited 2014 Apr 28]. Available from:http://www. pubmedcentral.nih.gov/articlerender.fcgi?artid=1239896&tool= pmcentrez&rendertype=abstract
13. Mathur R, Rotroff D, Ma J, Shojaie A, Motsinger-Reif A. Gene set analysis methods: a systematic comparison. BioData Min. 2018;11:8 Available from: https://biodatamining.biomedcentral.com/articles/10.1186/s13040-018-0166-8. 14. Wang J, Vasaikar S, Shi Z, Greer M, Zhang B. WebGestalt 2017: a more
comprehensive, powerful, flexible and interactive gene set enrichment analysis toolkit. Nucleic Acids Res. 2017;45:W130–7 Available from:https:// academic.oup.com/nar/article-lookup/doi/10.1093/nar/gkx356.
15. de Leeuw CA, Mooij JM, Heskes T, Posthuma D. MAGMA: generalized gene-set analysis of GWAS Data. PLOS Comput Biol. 2015;11:e1004219 Tang H, editor Available from:http://dx.plos.org/10.1371/journal.pcbi.1004219. 16. Segrè AV, Groop L, Mootha VK, Daly MJ, Altshuler D. Common inherited
variation in mitochondrial genes is not enriched for associations with type 2 diabetes or related glycemic traits. PLoS Genet. 2010;6:e1001058 Visscher PM, editor. Available from:http://dx.plos.org/10.1371/journal.pgen.1001058. 17. Schijven D, Kofink D, Tragante V, Verkerke M, Pulit SL, Kahn RS, et al.
Comprehensive pathway analyses of schizophrenia risk loci point to dysfunctional postsynaptic signaling. Schizophr Res. 2018; Available from: https://linkinghub.elsevier.com/retrieve/pii/S092099641830183X.
18. Shim U, Kim H-N, Lee H, Oh J-Y, Sung Y-A, Kim H-L. Pathway analysis based on a genome-wide association study of polycystic ovary syndrome. PLoS One. 2015;10:e0136609 Yu Y, editor. Available from:http://dx.plos.org/10. 1371/journal.pone.0136609.
19. Liberzon A, Subramanian A, Pinchback R, Thorvaldsdottir H, Tamayo P, Mesirov JP. Molecular signatures database (MSigDB) 3.0. Bioinformatics. 2011;27:1739–40 Available from:https://academic.oup.com/bioinformatics/ article-lookup/doi/10.1093/bioinformatics/btr260.
20. Liberzon A, Birger C, Thorvaldsdóttir H, Ghandi M, Mesirov JP, Tamayo P. The molecular signatures database hallmark gene set collection. Cell Syst. 2015;1:417–25 Available from:http://linkinghub.elsevier.com/retrieve/pii/ S2405471215002185.
21. Ogata H, Goto S, Sato K, Fujibuchi W, Bono H, Kanehisa M. KEGG: Kyoto Encyclopedia of Genes and Genomes. Nucleic Acids Res. 1999;27:29–34 Available from:http://www.ncbi.nlm.nih.gov/pubmed/9847135. 22. Ashburner M, Ball CA, Blake JA, Botstein D, Butler H, Cherry JM, et al. Gene
ontology: tool for the unification of biology. The Gene Ontology Consortium. Nat Genet. 2000;25:25–9 [cited 2014 Jul 10]. Available from: http://www.pubmedcentral.nih.gov/articlerender.fcgi?artid=3037419&tool= pmcentrez&rendertype=abstract.
23. Barrett T, Wilhite SE, Ledoux P, Evangelista C, Kim IF, Tomashevsky M, et al. NCBI GEO: archive for functional genomics data sets—update. Nucleic Acids Res. 2012;41:D991–5 Available from:http://academic.oup.com/nar/article/41/ D1/D991/1067995/NCBI-GEO-archive-for-functional-genomics-data. 24. Godec J, Tan Y, Liberzon A, Tamayo P, Bhattacharya S, Butte AJ, et al.
Compendium of immune signatures identifies conserved and species-specific biology in response to inflammation. Immunity. 2016;44:194–206 Available from:http://linkinghub.elsevier.com/retrieve/pii/
S1074761315005324.
25. Beura LK, Hamilton SE, Bi K, Schenkel JM, Odumade OA, Casey KA, et al. Normalizing the environment recapitulates adult human immune traits in laboratory mice. Nature. 2016;532:512–6 Available from:http://www.nature. com/doifinder/10.1038/nature17655.
26. Pauken KE, Sammons MA, Odorizzi PM, Manne S, Godec J, Khan O, et al. Epigenetic stability of exhausted T cells limits durability of reinvigoration by PD-1 blockade. Science (80- ). 2016;354:1160–5 Available from:http://www. sciencemag.org/cgi/doi/10.1126/science.aaf2807.
27. Kolesnikov N, Hastings E, Keays M, Melnichuk O, Tang YA, Williams E, et al. ArrayExpress update—simplifying data submissions. Nucleic Acids Res. 2015; 43:D1113–6 Available from:http://academic.oup.com/nar/article/43/D1/ D1113/2436935/ArrayExpress-updatesimplifying-data-submissions. 28. Bigot A, Duddy WJ, Ouandaogo ZG, Negroni E, Mariot V, Ghimbovschi S, et
al. Age-associated methylation suppresses SPRY1, leading to a failure of re-quiescence and loss of the reserve stem cell pool in elderly muscle. Cell Rep. 2015;13:1172–82.
29. Thorley M, Duguez S, Mazza EMC, Valsoni S, Bigot A, Mamchaoui K, et al. Skeletal muscle characteristics are preserved in hTERT/cdk4 human myogenic cell lines. Skelet Muscle. 2016;6:43 Available from:http://skeletalmusclejournal. biomedcentral.com/articles/10.1186/s13395-016-0115-5.
30. Defour A, Medikayala S, Van der Meulen JH, Hogarth MW, Holdreith N, Malatras A, et al. Annexin A2 links poor myofiber repair with inflammation and adipogenic replacement of the injured muscle. Hum Mol Genet. 2017; 26:1979–91 Available from:https://academic.oup.com/hmg/article-lookup/ doi/10.1093/hmg/ddx065.
31. Brazma A, Hingamp P, Quackenbush J, Sherlock G, Spellman P, Stoeckert C, et al. Minimum information about a microarray experiment
(MIAME)—toward standards for microarray data. Nat Genet. 2001;29:365–71 Available from:http://www.nature.com/articles/ng1201-365.
32. Ioannidis JPA, Allison DB, Ball CA, Coulibaly I, Cui X, Culhane AC, et al. Repeatability of published microarray gene expression analyses. Nat Genet. 2009; 41:149–55 Available from:http://www.nature.com/doifinder/10.1038/ng.295. 33. Huber W, Carey VJ, Gentleman R, Anders S, Carlson M, Carvalho BS, et al.
Orchestrating high-throughput genomic analysis with bioconductor. Nat Methods. 2015;12:115–21 Available from:http://www.nature.com/articles/ nmeth.3252.
34. Gentleman RC, Carey VJ, Bates DM, Bolstad B, Dettling M, Dudoit S, et al. Bioconductor: open software development for computational biology and bioinformatics. Genome Biol. 2004;5:R80 Available from:http://
genomebiology.biomedcentral.com/articles/10.1186/gb-2004-5-10-r80. 35. Wilson CL, Miller CJ. Simpleaffy: a BioConductor package for Affymetrix
quality control and data analysis. Bioinformatics. 2005;21:3683–5 Available from:https://academic.oup.com/bioinformatics/article-lookup/doi/10.1093/ bioinformatics/bti605.
36. Brettschneider J, Collin F, Bolstad BM, Speed TP. Quality assessment for short oligonucleotide microarray data. 2007; Available from:http://arxiv.org/ abs/0710.0178.
37. Hubbell E, Liu W-M, Mei R. Robust estimators for expression analysis. Bioinformatics. 2002;18:1585–92 Available from:https://academic.oup.com/ bioinformatics/article-lookup/doi/10.1093/bioinformatics/18.12.1585. 38. McCall MN, Murakami PN, Lukk M, Huber W, Irizarry RA. Assessing affymetrix
GeneChip microarray quality. BMC Bioinformatics. 2011;12:137 Available from: http://bmcbioinformatics.biomedcentral.com/articles/10.1186/1471-2105-12-137.
39. Irizarry RA, Hobbs B, Collin F, Beazer-Barclay YD, Antonellis KJ, Scherf U, et al. Exploration, normalization, and summaries of high density oligonucleotide array probe level data. Biostatistics. 2003;4:249–64 Available from:http:// www.ncbi.nlm.nih.gov/pubmed/12925520.
40. Dai M, Wang P, Boyd AD, Kostov G, Athey B, Jones EG, et al. Evolving gene/ transcript definitions significantly alter the interpretation of GeneChip data. Nucleic Acids Res. 2005;33:e175 Available from:http://www.ncbi.nlm.nih. gov/pubmed/16284200.
41. Sandberg R, Larsson O. Improved precision and accuracy for microarrays using updated probe set definitions. BMC Bioinformatics. 2007;8:48 Available from: https://bmcbioinformatics.biomedcentral.com/articles/10.1186/1471-2105-8-48.
42. Smyth GK, Michaud J, Scott HS. Use of within-array replicate spots for assessing differential expression in microarray experiments. Bioinformatics. 2005;21:2067–75 Available from:http://www.ncbi.nlm.nih.gov/pubmed/ 15657102.
43. Ritchie ME, Phipson B, Wu D, Hu Y, Law CW, Shi W, et al. Limma powers differential expression analyses for RNA-sequencing and microarray studies. Nucleic Acids Res. 2015;43:e47 Available from:http://www.ncbi.nlm.nih.gov/ pubmed/25605792.
44. Kinsella RJ, Kahari A, Haider S, Zamora J, Proctor G, Spudich G, et al. Ensembl BioMarts: a hub for data retrieval across taxonomic space. Database. 2011;2011:bar030 Available from:https://academic.oup.com/ database/article-lookup/doi/10.1093/database/bar030.
45. Leek JT, Storey JD. Capturing heterogeneity in gene expression studies by surrogate variable analysis. PLoS Genet. 2007;3:e161 Available from:https:// dx.plos.org/10.1371/journal.pgen.0030161.
46. Leek JT, Johnson WE, Parker HS, Jaffe AE, Storey JD. The sva package for removing batch effects and other unwanted variation in high-throughput experiments. Bioinformatics. 2012;28:882–3 Available from:https://academic. oup.com/bioinformatics/article-lookup/doi/10.1093/bioinformatics/bts034. 47. Jelier R,‘t Hoen PAC, Sterrenburg E, den Dunnen JT, van Ommen G-JB, Kors
JA, et al. Literature-aided meta-analysis of microarray data: a compendium study on muscle development and disease. BMC Bioinformatics. 2008;9:291 [cited 2012 Dec 5]. Available from:http://www.pubmedcentral.nih.gov/ articlerender.fcgi?artid=2459190&tool=pmcentrez&rendertype=abstract 48. Merico D, Isserlin R, Stueker O, Emili A, Bader GD. Enrichment map: a
network-based method for gene-set enrichment visualization and interpretation. PLoS One. 2010;5:e13984.
49. Hung J-H, Yang T-H, Hu Z, Weng Z, DeLisi C. Gene set enrichment analysis: performance evaluation and usage guidelines. Brief Bioinform. 2012;13:281–91 Available from:https://academic.oup.com/bib/article-lookup/doi/10.1093/bib/bbr049. 50. Powers RK, Goodspeed A, Pielke-Lombardo H, Tan A-C, Costello JC.
GSEA-InContext: identifying novel and common patterns in expression experiments. Bioinformatics. 2018;34:i555–64 Available from:https:// academic.oup.com/bioinformatics/article/34/13/i555/5045793. 51. Nam D, Kim S-Y. Gene-set approach for expression pattern analysis. Brief
Bioinform. 2008;9:189–97 Available from:https://academic.oup.com/bib/ article-lookup/doi/10.1093/bib/bbn001.
52. Porter JD, Merriam AP, Leahy P, Gong B, Feuerman J, Cheng G, et al. Temporal gene expression profiling of dystrophin-deficient (mdx) mouse diaphragm identifies conserved and muscle group-specific mechanisms in the pathogenesis of muscular dystrophy. Hum Mol Genet. 2004;13:257–69 Available from:https://academic.oup.com/hmg/article-lookup/doi/10.1093/ hmg/ddh033.
53. Chen Y-W, Zhao P, Borup R, Hoffman EP. Expression profiling in the muscular dystrophies. J Cell Biol. 2000;151:1321–36 Available from:http:// www.jcb.org/lookup/doi/10.1083/jcb.151.6.1321.
54. Haslett JN, Sanoudou D, Kho AT, Bennett RR, Greenberg SA, Kohane IS, et al. Gene expression comparison of biopsies from Duchenne muscular dystrophy (DMD) and normal skeletal muscle. Proc Natl Acad Sci. 2002;99: 15000–5 Available from:http://www.pnas.org/cgi/doi/10.1073/pnas. 192571199.
55. Tseng BS, Zhao P, Pattison JS, Gordon SE, Granchelli JA, Madsen RW, et al. Regenerated mdx mouse skeletal muscle shows differential mRNA expression. J Appl Physiol. 2002;93:537–45 Available from:http://www. physiology.org/doi/10.1152/japplphysiol.00202.2002.
56. Haslett JN, Kang PB, Han M, Kho AT, Sanoudou D, Volinski JM, et al. The influence of muscle type and dystrophin deficiency on murine expression profiles. Mamm Genome. 2005;16:739–48 Available from:http://link.springer. com/10.1007/s00335-005-0053-8.
57. Duguez S, Duddy W, Johnston H, Lainé J, Le Bihan MC, Brown KJ, et al. Dystrophin deficiency leads to disturbance of LAMP1-vesicle-associated protein secretion. Cell Mol Life Sci 2013 [cited 2013 Mar 21]; Available from: http://www.ncbi.nlm.nih.gov/pubmed/23344255
58. Turk R, Sterrenburg E, van der Wees CGC, de Meijer EJ, de Menezes RX, Groh S, et al. Common pathological mechanisms in mouse models for muscular dystrophies. FASEB J. 2006;20:127–9 Available from:http://www. fasebj.org/doi/10.1096/fj.05-4678fje.
59. von der Hagen M, Laval SH, Cree LM, Haldane F, Pocock M, Wappler I, et al. The differential gene expression profiles of proximal and distal muscle groups are altered in pre-pathological dysferlin-deficient mice. Neuromuscul Disord. 2005;15:863–77 Available from:https://linkinghub.elsevier.com/ retrieve/pii/S0960896605002592.
60. Suzuki N, Aoki M, Hinuma Y, Takahashi T, Onodera Y, Ishigaki A, et al. Expression profiling with progression of dystrophic change in dysferlin-deficient mice (SJL). Neurosci Res. 2005;52:47–60 Available from:https:// linkinghub.elsevier.com/retrieve/pii/S0168010205000246.
61. Spinelli L, Carpentier S, Montañana Sanchis F, Dalod M, Vu Manh T-P. BubbleGUM: automatic extraction of phenotype molecular signatures and comprehensive visualization of multiple Gene Set Enrichment Analyses. BMC Genomics. 2015;16:814 Available from:http://www.biomedcentral.com/ 1471-2164/16/814.
62. Gundersen GW, Jones MR, Rouillard AD, Kou Y, Monteiro CD, Feldmann AS, et al. GEO2Enrichr: browser extension and server app to extract gene sets from GEO and analyze them for biological functions: Fig. 1. Bioinformatics. 2015;31:3060–2 Available from:https://academic.oup.com/bioinformatics/ article-lookup/doi/10.1093/bioinformatics/btv297.
63. Wang Z, Monteiro CD, Jagodnik KM, Fernandez NF, Gundersen GW, Rouillard AD, et al. Extraction and analysis of signatures from the Gene Expression Omnibus by the crowd. Nat Commun. 2016;7:12846 Available from:http://www.nature.com/doifinder/10.1038/ncomms12846. 64. Bhasuran B, Natarajan J. Automatic extraction of gene-disease associations
from literature using joint ensemble learning. PLoS One. 2018;13:e0200699 Hernandez-Lemus E, editor. Available from:http://dx.plos.org/10.1371/ journal.pone.0200699.
65. Nygaard V, Rødland EA, Hovig E. Methods that remove batch effects while retaining group differences may lead to exaggerated confidence in downstream analyses. Biostatistics. 2015;kxv027 Available from:https:// academic.oup.com/biostatistics/article-lookup/doi/10.1093/biostatistics/ kxv027.
66. Deshwar AG, Morris Q. PLIDA: cross-platform gene expression normalization using perturbed topic models. Bioinformatics. 2014;30:956–61 Available from:https://academic.oup.com/bioinformatics/article-lookup/doi/10.1093/ bioinformatics/btt574.