HAL Id: hal-02186775
https://hal.univ-lorraine.fr/hal-02186775
Submitted on 19 Dec 2020HAL is a multi-disciplinary open access archive for the deposit and dissemination of sci-entific research documents, whether they are pub-lished or not. The documents may come from teaching and research institutions in France or abroad, or from public or private research centers.
L’archive ouverte pluridisciplinaire HAL, est destinée au dépôt et à la diffusion de documents scientifiques de niveau recherche, publiés ou non, émanant des établissements d’enseignement et de recherche français ou étrangers, des laboratoires publics ou privés.
Distributed under a Creative Commons Attribution - NonCommercial - NoDerivatives| 4.0 International License
Modelling of a hydrogen thermally driven compressor
based on cyclic adsorption-desorption on activated
carbon
Giuseppe Sdanghi, Nicolas Vincent, Kevin Mozet, Sébastien Schaefer, Gaël
Maranzana, Alain Celzard, Vanessa Fierro
To cite this version:
Giuseppe Sdanghi, Nicolas Vincent, Kevin Mozet, Sébastien Schaefer, Gaël Maranzana, et al.. Mod-elling of a hydrogen thermally driven compressor based on cyclic adsorption-desorption on acti-vated carbon. International Journal of Hydrogen Energy, Elsevier, 2019, 44 (31), pp.16811-16823. �10.1016/j.ijhydene.2019.04.233�. �hal-02186775�
1
Modelling of a hydrogen thermally driven
compressor based on cyclic
adsorption-desorption on activated carbon
G. Sdanghi
1,2, V. Nicolas
1, K. Mozet
2, G. Maranzana
2, A. Celzard
1, V.
Fierro
1*1
Institut Jean Lamour, UMR CNRS-Université de Lorraine n°7198, ENSTIB, 27 rue Philippe Seguin, BP 21042 - 88051 EPINAL Cedex 9, France
2
Laboratoire d’Energétique et de Mécanique Théorique et Appliquée, UMR CNRS- Université de Lorraine n° 7563, 2 avenue de la Forêt de Haye, BP 160, F-54504 Vandœuvre-lès-Nancy, France
*
Corresponding author. Tel: + 33 329 29 61 77. Fax: + 33 329 29 61 38. E-mail address :
2
Abstract
Thermally driven hydrogen compression by cyclic hydrogen adsorption-desorption on activated carbon is presented therein. Hydrogen compression occurs through heat exchange, which allows physisorbed hydrogen to desorb at higher temperature in a given volume. The physical nature of hydrogen adsorption on porous carbon allows reversible desorption, and a flow of compressed hydrogen is then obtained by running adsorption/desorption cycles repeatedly. We investigated the feasibility of such a system through numerical simulations by taking into account both mass and energy balances, and adsorption thermodynamics. We showed that high-pressure hydrogen, up to 70 MPa, can be obtained by simply lowering and/or increasing the system temperature. Such a system opens new perspectives in the frame of the Hydrogen Supply Chain.
3
1.
Introduction
Hydrogen offers innovative and environment-friendly solutions for the use of energy in the next decades as it can be produced from renewable resources, like biomass and water [1], and, moreover, its use as fuel does not release pollutants. Nevertheless, in order to make hydrogen a real alternative to fossil fuels, safe and cost-effective transportation and storage solutions need to be found. It has been shown that the cheapest hydrogen storage-recovery mode is obtained by compression and truck delivery, especially for low demands [2]. Moreover, pressurised composite tanks are commercially available nowadays, and ensure storing hydrogen up to 70 MPa, which is the level required by on-board storage systems used in fuel cell-powered vehicles and by hydrogen refuelling stations [3].
Compression is the most widely used method to store hydrogen at present. Traditional hydrogen mechanical compressors, like those based on pistons or diaphragms, rely on mature technologies and are particularly used when moderate flows and high pressures are demanded. These systems allow producing compressed hydrogen, up to 100 MPa, with a flow
rate of about 10-2 kg s-1 [4]. However, these technologies are affected by several drawbacks:
(i) they consist of several mechanical components in movement, with consequent problems related to vibrations and noise; (ii) most of hydrogen mechanical compressors use oil for lubricating the moving parts, increasing the risk of hydrogen pollution; (iii) maintenance of mechanical compressors is very difficult; (iv) effective heat exchange during operation is challenging [5]; and (v) hydrogen can cause metal embrittlement [6]. Ionic liquid compressors partly solve the aforementioned drawbacks, but are also considered as mechanical compressors. An ionic liquid compressor is able to compress hydrogen from atmospheric pressure to 90 MPa in only five steps, with flows rate of about 10-2 kg s-1, similarly to piston
4
70%, along with reduced size and weight, making them the most suitable out of all mechanical compressors.
Attention is now focused on non-mechanical compressors, e.g. metal hydride [8] and electrochemical compressors [9]. Hydrogen compression up to 87.5 MPa was achieved by using a metal hydride compressor [10], along with a significant reduction of dimensions, cost and weight with respect to a mechanical compressor reaching the same pressure level [11]. In the same way, electrochemical compressors ensure reaching 100 MPa in a compact and silent system [12], with overall efficiency higher than 70% [13]. In addition, both metal hydride and electrochemical compressors have no moving parts, preventing all the drawbacks listed above and related to mechanical compressors. Moreover, both kinds of systems indeed proved to be safe and highly reliable, although they are particularly more relevant when a low hydrogen
flow is required, e.g. 10-3 kg s-1. A comparison between all hydrogen compression
technologies in terms of cost and efficiency has been thoroughly reviewed elsewhere [14]. The adsorption-desorption compressor is a non-mechanical compressor which might be called thermally driven compressor as it is based on heat exchanges in a compression tank filled with high surface area-materials. Such a system relies on the capacity of porous materials to adsorb gases such as hydrogen. Carbonaceous materials seem to be particularly relevant for this purpose, and especially activated carbons (ACs) since they present, on average, the highest hydrogen adsorption capacity out of all common carbon adsorbents like
carbon nanotubes, carbon nanofibers, zeolite- and MOFs-derived carbons [15]. Such high H2
storage capacity is due to the high surface area and pore volume exhibited by ACs, which can be as high as 3000 m2 g-1 and 1.5 cm3 g-1, respectively [16]. Furthermore, nitrogen
adsorption-desorption isotherms obtained for the textural characterisation of the ACs commonly used for hydrogen adsorption are of type I, according to the IUPAC classification [17]. These isotherms exhibit both a high N2 uptake at very low relative pressures and an extremely
5
narrow knee, indicating the presence of ultra-micropores, i.e., with a width lower than 0.7 nm [18]. Hydrogen storage capacity is particularly enhanced in carbon materials having both high microporosity and very narrow micropores. Indeed, only one single layer of adsorbed hydrogen can be formed in such narrow pores, thus a high adsorption potential is achieved deriving from the overlap of the Van der Waals forces between hydrogen molecules and both walls of the slit-shape pores confining them [19]. Thus, hydrogen adsorption on ACs is a physical phenomenon, since no chemical bonds between hydrogen molecules and the AC surface are involved. Furthermore, the adsorption energies are of the order of 6-8 kJ mol-1,
i.e., considerably lower than in the case of chemical adsorption, which can be as high as 130
kJ mol-1 [20]. The basic advantages of physical adsorption are both the reversible and the fast
kinetics of adsorption compared to chemical adsorption. Nevertheless, high hydrogen storage capacity can be only obtained at very low temperature, because of the low adsorption enthalpy. To date, the highest hydrogen uptake was reached by using activated carbons at 77 K, and it was equal to 7 wt. % [21].
In a thermally driven system based on cyclic adsorption-desorption, hydrogen compression derives from system heating that produces hydrogen desorption, i.e., hydrogen moves from the (denser) adsorbed phase to the (lighter) bulk phase. As a result, the density of the hydrogen bulk phase increases, producing high-pressure hydrogen. Richard et al. [22] obtained preliminary results on a similar hydrogen compression system based on adsorption on AC. These authors introduced hydrogen at room temperature into a tank filled with AC initially at 80 K and 0.14 MPa. The consequent increase of the system temperature made the hydrogen pressure increase, reaching a value of about 5 MPa.
As far as we know, hydrogen compression based on adsorption is rather an emerging research topic nowadays, and hence the open literature still lacks both experimental and numerical studies. However, several authors investigated the behaviour of cryo-adsorptive
6
systems for storing hydrogen as an alternative method to compression. Petitpas et al. [23] thus carried out an in-depth comparative analysis of cryo-adsorption and cryo-compression hydrogen storage methods, concluding that it is not possible to assess which one is better than the other as the choice of a hydrogen storage system strictly depends on the end application. Ahluwalia and Peng [24] developed a numerical model to investigate the potential use of a cryo-adsorptive system for on-board applications. They found that the amount of hydrogen recoverable from a particular sorbent strictly depends on the pressure and temperature swings. In particular, they concluded that a temperature swing of around 50 K was needed to recover more than 80% of the sorption capacity of a super-activated carbon sorbent at 100 K and 10
MPa when the tank was depressurised to 0.3–0.8 MPa. Moreno-Blanco et al. [25] investigated
the performances of hydrogen cryo-adsorptive systems for automotive applications, finding that it is possible to reach a filling density of about 76 kg m-3 for a 70 MPa vessel and to
ensure a driving distance of 150 km day-1. Several authors focused also on the thermal effects
in a cryo-adsorptive storage system through computational fluid dynamics (CFD), stating that significant temperature variations take place especially during the charging process [26–31].
Hardy et al. [32] found that a material bulk density of about 700 kg m-3 must be achieved in
order to make a cryo-adsorptive hydrogen system reaching both the gravimetric and the volumetric capacities foreseen by the 2025 DOE target [33].
The main objective of the present study was thus to investigate an adsorption-based system to compress hydrogen in a non-mechanical way. A mathematical model based on mass and energy balances occurring in the system is presented and the corresponding results are compared to the data available in the open literature. We show that a pressure as high as 70 MPa is achievable by using this innovative hydrogen thermally driven compression system.
7
2.
Description of the hydrogen adsorption compressor
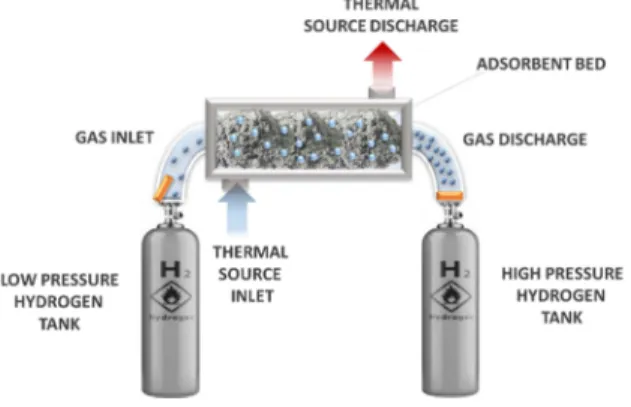
Figure 1 shows a scheme of a hydrogen thermally driven compression system. In the latter, the hydrogen compression tank must be able to withstand both the high pressures that are generated and the embrittlement induced by the contact of the materials with high-pressure hydrogen. The tank, filled with AC, is initially immersed in a Dewar filled with liquid nitrogen (77 K) in order to enhance hydrogen adsorption. Once thermal equilibrium between the tank and the Dewar is reached, medium-pressure hydrogen, around 4 MPa, is introduced in the tank and hydrogen adsorption onto the AC takes place. The charging process lasts as long as a pressure gradient between the inlet manifold and the tank exists, then the inlet valve is closed once the pressure gradient is zero. At this point, the tank is removed from the Dewar and thus heated up by natural convection; alternatively, an electric heating system can be used to speed up the process. Increasing the tank temperature produces hydrogen desorption, and therefore the density of the hydrogen bulk phase increases and high-pressure hydrogen is obtained. A pressure regulator is placed downline the tank to allow high-pressure hydrogen to flow at the desired pressure. As shown below, the potentially achievable pressure level strictly depends on the final temperature, on the free volume inside the tank, and on the mass of AC.
Figure 1 – Scheme of an adsorption compressor system (from [14] with permission of Elsevier).
8
3.
Description of the numerical model
In order to investigate the mass and heat transfer phenomena occurring in a hydrogen thermally driven compressor, we developed a zero-dimensional mathematical model simulating:
- the temperature (T) and pressure (P) dynamics inside the tank;
- the changes of hydrogen amounts both in the adsorbed phase (na) and in the bulk phase
(ng);
- the volume of hydrogen in the bulk phase (Vg).
For that purpose, several simplifying assumptions were used: (i) the pressure and the temperature inside the tank are uniform; (ii) the gas inside the tank is a homogeneous fluid; (iii) the hydrogen adsorption kinetics is fast enough to consider that the hydrogen in the bulk phase is in equilibrium with that adsorbed on the AC.
The numerical model consists of several, coupled, ordinary differential equations (ODEs) in which the aforementioned physical properties are the unknowns of the problem. By solving the system of ODEs, the temporal evolution of each property can be obtained. We introduced in the model the hydrogen equation of state, an expression describing hydrogen adsorption on porous material, and the equations of mass and energy conservation. From each of these expressions, an explicit ODE in the form y’= f (t,y) was obtained, wherein the dependent
variable y is one of the physical characteristic of the problem. Thus, the 4th order Runge-Kutta
iterative method (RK4) was used to solve the ODEs system. For each ODE, an initial value of
9
beginning of either the charging or the discharging stage, depending on the process investigated. In the following, each single ODE was derived and discussed.
3.1 Temperature
Beyond the heat exchanges required for cooling down the system and hence for favouring adsorption on the one hand, and then for heating it up for desorbing hydrogen on the other hand, several other thermal effects take place in a thermally driven compressor. Adsorption itself is indeed an exothermic process that cannot be neglected. Hermosilla-Lara et al. [34] found that the heat of adsorption can contribute up to 22% for all the thermal effects involved in a cryo-adsorptive hydrogen storage system. On the other hand, significant variations of the system temperature can be produced during the charging process itself, when hydrogen at room temperature is fed to the reservoir at 77 K. All these heat transfer phenomena affect the temperature dynamics inside the tank, and all of them are taken into account in the energy conservation equation:
= − +
(1)
where mi [kg] is the mass and Ui [J kg-1] is the specific internal energy of either hydrogen, or
AC, or tank walls, Hin and Hout [J kg-1] are the hydrogen enthalpies related to inlet and outlet
flows, respectively, and [J s-1] is the sum of the heat of adsorption and the heat exchanged
with the external environment. Eq. (1) can be further developed by taking into account the following simplifying assumptions: (i) Ui can be written as the specific heat capacity at
constant volume cv,imultiplied by the temperature T; (ii) the total enthalpy can be written as
the hydrogen mass flow towards the tank, either during the charging stage, , or during the
10
by the temperature T; (iii) the heat transfer with the external environment can be modelled by using a global heat transfer coefficient, h [W K-1 m-2]. According to the aforementioned
assumptions, Eq. (1) can be rewritten as follows:
, + , + , + , !
= ", − ", + Δ $%&'& + ℎ)* − +
(2)
In Eq. (2), the subscript g stands for hydrogen in the bulk phase, a stands for hydrogen in the adsorbed phase, AC is for activated carbon and w is for the tank walls. Tin [K] is the temperature of the low-pressure hydrogen flow introduced into the compression tank, and is
generally equal to the room temperature. ∆Hads [J mol-1] is the heat of adsorption, considered
as constant in the present numerical model. The variation of the total amount of heat released during adsorption is evaluated as the product of the adsorption heat by the differential variation of hydrogen mass in the adsorbed phase. The heat transfer between the compression tank and its environment is calculated as the global heat transfer coefficient h [W K-1 m-2]
multiplied by the surface area where the heat transfer takes place, S [m2], and by the
temperature difference Ta – T [K]. Tais the temperature of the external environment, and it is
equal to 77 K during the charging stage and to 298 K (or more, depending on the heating
system used) during the discharging stage. The temperature dependency of both cp,g and cv,g [J
kg-1 K-1] was calculated from the data of the National Institute of Standards and Technology
(NIST):
", = −2 ∙ 10012 3+ 1004 5− 0.0024 8+ 3.0534 + 13332 (3)
11
After introducing the hydrogen molar mass M [g mol-1] and developing and rearranging Eq.
(2), the following ODE with the temperature as dependent variable was obtained:
= >' ", − >' ", + *Δ $%− > + &'& − > &'
& + ℎ)* − +
> , ' + > , ' + , + ,
(5)
We further assumed that cv,g ~ cv,a. In all the simulations, the temperature T0was fixed at 77 K during the charging stage and when starting the discharging process.
3.2 Amount of hydrogen in the adsorbed phase
Dubinin’s model [35] was proved to describe quite well gas adsorption on microporous materials, such as ACs, by volume filling of the available adsorption space and not by gradual formation of adsorption layers on the surface of the micropores. This approach leads to the conclusion that adsorption on microporous materials is similar to the subcritical adsorption of vapours. However, in the experimental conditions used herein, hydrogen remains in the supercritical state. In order to deal with adsorption of supercritical fluids in micropores, Dubinin introduced a hypothetical saturated vapour pressure and proposed an empirical equation for it, assuming that the adsorption mechanism of supercritical fluids is the same pore filling mechanism as for subcritical ones [36]. In fact, the interpretation of such approach has been one of the shortcomings of Dubinin’s model for supercritical fluids [37]. To support the concept of a quasi-saturated vapour pressure, Do and Do [38] argued that supercritical molecules may form clusters while confined in micropores, and these clusters could be large enough to exert a quasi-saturated vapour pressure in the same way as subcritical fluids exhibit
12
their vapour pressure. Several versions and improvements of Dubinin’s model were proposed in order to give a physical interpretation of all the equation parameters. The modified Dubinin-Astakhov equation proposed by Richard et al. [39] proved to be a good analytical tool for representing experimental adsorption data of different gases over a wide range of pressures and temperatures in supercritical conditions. In this model, the quasi-saturation pressure was considered as a fitting parameter, along with the maximum amount of gas adsorbed and the characteristic energy. Hence the modified Dubinin-Astakhov model was used in the present work for describing hydrogen adsorption on AC in supercritical conditions: ? = ?@ AB?C D− EG + H IF 8 J'8EK% KIL (6)
Eq. (6) describes the evolution of the number of moles of adsorbed hydrogen as a function of
pressure and temperature, higher amounts of hydrogen being adsorbed at higher pressures and
lower temperatures [40]. xa [mol kg-1] is the absolute amount of hydrogen adsorbed onto the
AC normalised with respect to the total mass of AC contained in the compression tank, and
xmax [mol kg-1] is the amount of adsorbed hydrogen corresponding to the saturation of the
entire available porous volume. α [J mol-1] is an enthalpy factor, β [mol J-1 K-1] is an entropy
factor, and Ps [MPa] is the pseudo-saturation pressure introduced above [38]. By
differentiating Eq. (6) with respect to time, the following expression is obtained: '
13
where ms[kg] is the amount of AC contained in the compression tank. The partial derivatives
of xa with respect to the two unknowns P and T can be also obtained by differentiating Eq. (6): &? &K = 2? F N−J' ??@ A K*G + H + = M1 (8) &? & = 2G? J' ?? @ A *G + H + = M8 (9)
The ODE having the number of moles of adsorbed hydrogen as dependent variable was thus obtained. The initial condition na0 was found by evaluating Eq. (7) with respect to the compression tank conditions at time t0, i.e., na(t0) = na(T0, P0).
3.3 Amount of hydrogen in the bulk phase
The evolution of the amount of hydrogen in the bulk phase can be described by using an appropriate equation of state. In order to take into account the deviation from ideal conditions due to the high pressures reached during compression, the Van der Waals equation was chosen out of all other possible equations of state [41]:
OK +P' 8
Q8 R Q − ' S = ' F
(10)
where a and b are the constant parameters of the Van der Waals equation (0.02476 J m3 mol-2
14
mol-1. By differentiating Eq. (10) with respect to time and by rearranging the as-obtained
expression, the following ODE was obtained:
'
= − Q − S' &K& − OK − P E '
Q I
8
+ 2PS E'Q I5R &Q& + ' F& &
O−SK + 2P'Q − 3PS E'Q I8− F R = −TT1 8 &K & −TT38 &Q & +TT58 & & (11)
The coefficients γ1, γ2, γ3 and γ4 were introduced to clearly show the direct dependence of ng
on the other state functions T and P, and on the volume of the bulk phase, Vg. Since the Van
der Waals equation is nonlinear, it is not possible to calculate the amount of hydrogen in the bulk phase at given physical conditions. For this reason, the initial condition ng0 was evaluated by using the ideal gas law, which is a valid assumption, since the compression tank is still at low pressure at t0:
' 2 =KF 2Q 2 2
(12)
P0 and T0 have been introduced in the previous subsection. The volume Vg0 is the volume of
hydrogen in the bulk phase at time t0 and is estimated by the volume balance in the tank:
Q 2 = Q U− Q2− Q% (13)
where Vtank is the whole volume of the compression tank, Va0 is the volume of hydrogen in
15
ρs, where ρsis the skeletal density of the AC. A discussion about the volume of the adsorbed
phase Vais presented in subsection 3.5 below.
3.4 Pressure
Hydrogen pressure is the main state function to be evaluated in an adsorption compressor; it increases with temperature, which leads to hydrogen desorption. Hence, hydrogen moves from the adsorbed to the bulk phase and hence increases its density as long as it remains in a confined volume. Pressure evolution can be obtained from the mass conservation equation:
'
+ ' = ' − ' (14)
where ' [kg s-1] is the hydrogen inlet flow during the charging stage and ' [kg s-1] is the
high-pressure hydrogen outlet flow. By replacing Eq. (7) and Eq. (11) into Eq. (14), the following equation is obtained:
&K & = ' − ' + T3 T8 &Q & − TT58+ %M8 & & %M1 − TT18 (15)
3.5 Volume of hydrogen in the bulk phase and in the adsorbed phase
Eq. (13) shows the volume balance in a hydrogen adsorption compressor; both Vtank and Vs
are definitely constant, as they represent the volume of the tank and of the AC, respectively.
The volume of hydrogen in the adsorbed phase, Va, is defined as a volume in the immediate
proximity of carbon surfaces, i.e., wherein the density of the adsorbate is much higher than that of the bulk phase because of the potential field exerted by the adsorbent.
16
The density of adsorbed hydrogen, ρa, is often assumed to be equal or even higher than the
density of liquid hydrogen [42]. Based on this assumption, ρa can be considered as a constant,
thus the volume of the adsorbed phase varies with time. Consequently, by differentiating Eq.
(13) with respect to time, and by considering that Va can be written as the ratio mass/density
of adsorbed hydrogen, the variation with time of the hydrogen volume in the bulk phase, Vg,
reads: &Q
& = −V>&'& (16)
where M [mol kg-1] is the molecular weight of hydrogen, and ρa[kg m-3] is the density of the
adsorbed hydrogen. In this study, ρa was supposed to be equal to the density of liquid
hydrogen, i.e., 70.8 kg m-3. According to this assumption, both Vg and Va vary with time, the
increase of one corresponding to the decrease of the other.
On the other hand, several authors [38,39,43] considered Va as constant, meaning that all the
adsorbed hydrogen occupies a defined volume very close to the carbon surface where the adsorption field exists, thus its density gradually increases up to an asymptotical value. According to this second definition, both Vg and Va are constant, hence it is the density of adsorbed hydrogen that changes with time and they are not dependent variables in the numerical model. Based on this assumption, the model consists of only 4 ODEs in explicit form instead of 5, thus reducing the computational time.
Herein, the two aforementioned ways of considering Va were examined, and we used the Matlab/Simulink software to solve the ODEs system introduced above.
17
4.
Results and discussion
4.1 Model validation
The mathematical model developed herein was checked against the experimental data obtained by Richard et al. [22]. In the latter study, the authors investigated the performances of an adsorption-based hydrogen storage system consisting of a 2.5 L tank filled with 0.67 kg
of commercial AC, Maxsorb MSC-30TM. The tank, initially at 80 K and 0.14 MPa, was
soaked into liquid nitrogen. A hydrogen flow of 1.44 g min-1 at 295 K was then introduced
into the tank for 27 minutes. As a consequence of such charging process, the heat of adsorption that was released increased the average temperature inside the tank. An increase of hydrogen pressure was thus observed, somehow similar to what occurs in a thermally driven hydrogen compression.
Figure 2 a) and b) show the comparison between the experimental data from Richard et al.
[22] and the predicted temperature and pressure dynamics, respectively, by considering Va as
a time-dependent variable. On the other hand, Figure 2 c) and d) show the fitting of the same experimental data when a constant Va was used. Although Figure 2 a) and b) show similar trends to those obtained by Richard et al. [22], the fitting was not satisfactory, as a large difference between the predicted and the experimental results was observed. On the other hand, Figure 3 c) and d) show that a much better fit of the experimental data from [22] was
obtained when a constant Va was assumed, in agreement with other studies showing that Va
approaches the value of the micropore volume in microporous adsorbents [38]. Thus, it can be
assumed that Va is constant and specific for a given AC.
Furthermore, the results of the model validation may lead to another conclusion. According to Eq. (16), the time evolution of Vg and Va strictly depends on the density of the adsorbed phase, which was initially supposed to be equal to that of liquid hydrogen. The time
18
derivative of Vg vanishes when the density of the adsorbed phase is too high, hence both Vg
and Va can be considered as constant; this finding is in good agreement with studies suggesting that the density of hydrogen in the adsorbed phase can be higher than that of liquid
hydrogen, up to 100 kg m-3 [44]. From their simulations, Richard et al. [39] obtained an upper
limit for the density of adsorbed hydrogen close to the density of solid hydrogen, around 87
kg m-3. They concluded that this result was not completely surprising, as the adsorption limit
corresponds to a state in which the adsorbed phase density is at its maximum, and hydrogen in the adsorbed phase becomes incompressible. Thus, the hypothesis of considering that the volume of the hydrogen adsorbed phase is constant is valid.
The volumes Vg and Va obtained in the case where Va was assumed to be a variable were quite different from those calculated by considering Va as a constant, and this explains the large discrepancy observed in Figure 2. Figure 3 shows the evolution of the volumetric ratios of bulk phase volume to tank volume, adsorbed phase volume to tank volume, and AC
19
Figure 2 – Fitting of data from Ref. [22]. a) Predicted temperature and b) predicted pressure by considering Va as time-dependent. c) and d): same as a) and b), respectively, but by considering a constant value of Va.
20
Figure 3 – Evolution of the volumetric ratios of bulk phase volume to tank volume, adsorbed
phase volume to tank volume, and AC volume to tank volume, in the cases: a) Va is variable
with time; and b) Va is constant. The corresponding changes of adsorbed phase density can be
read on the right y-axis.
Figure 3a shows that Vg decreases during both the charging and the cooling stages by assuming variables volumes, and this behaviour is more significant during the charging stage.
On the other hand, Vaincreases in agreement with Eq. (13). This behaviour may be explained
by the fact that hydrogen introduced into the tank at time t = 0 is mainly adsorbed onto AC instead of remaining in the bulk phase because of the low temperature. Therefore, Va must increase in order to keep constant the density of the adsorbed phase. Figure 3b shows that the
volumes evaluated by assuming Vaas constant and equal to the value reported in Table 1 are
higher than those in Figure 3a. Indeed, the latter hypothesis implies that the density of the
adsorbed phase varies with time while Varemains constant. In addition to the evolution of the
21
adsorbed phase increases with time to reach an almost constant value around 66 kg m-3,
somewhat lower than the density of liquid hydrogen, 70.8 kg m-3. Nevertheless, keeping Va
constant definitely gives a better fit of the experimental data.
Table 1 shows the fixed parameters used to validate the model. Information regarding the geometry of the system, i.e., the area where the heat transfer takes place and the mass of the tank, were estimated from literature data [22] related to a prototype container of 150 L and 69 kg. On the other hand, parameters that could not be reliably estimated and that are difficult to measure directly were obtained by fitting the model to the experimental literature data [22]. This is the case of the heat transfer coefficient, h, for which a value of 40 W K-1 m-2 was
obtained for the charging process and 15 W K-1 m-2 was obtained for the following cooling
stage. These results are in good agreement with the h values normally used in thermal simulations; h is higher in forced convection conditions, such as those of tank filling, than in natural convection ones, such as the following cooling stage.
Table 1 – Parameters used for the validation of the numerical model.
Parameter Value / Equation Reference
ρS [kg m-3] - skeletal density of ACs 2 200 [22]
mw [kg] - mass of compression tank 1.15 estimated from [22]
A [m2] - heat transfer area 0.12 estimated from [22]
∆Hads [J mol-1] - heat of adsorption -6 000 [45]
α [J mol-1] - parameter of modified DA equation 3 080 [39]
β [J mol-1 K-1] - parameter of modified DA equation 18.9 [39]
xmax [mol kg-1] - parameter of modified DA equation 71.6 [39]
Psat [MPa] - parameter of modified DA equation 1.47 × 10³ [39]
Va [m3 kg-1] - volume of adsorbed phase 0.00143 [39]
h [W K-1 m-2] - heat transfer coefficient 40 during the charging stage
15 during cooling stage from fits to data [22]
cs [J kg-1 K-1] - AC specific heat 825 [28]
22 4.2 Simulation of a hydrogen adsorption compressor
The developed zero-dimensional numerical model presented in Section 3 was used to simulate the performances of a thermally driven hydrogen compressor. The case of an adsorption compressor consisting of a tank of 0.5 L filled up with 0.15 kg of AC was considered. The AC chosen for our simulations was the MAXSORB 30, having a bulk density of around 270
kg m-3 measured with the tapped density analyser AUTOTAP (Quantachrome Instruments)
and following the ASTM D8176-18 standard test method. The parameters of the model used for the numerical investigation were taken from Table 1, except the mass of the compression tank and the heat transfer area, which were estimated from the study of Richard et al. [22] by considering a reservoir volume of 0.5 L. In the beginning of the compression process, both the compression tank and the hydrogen are at 77 K. Hydrogen is initially fed to the tank at 4 MPa, which is the minimum pressure in order to reach the discharge pressure of 70 MPa (Figure 4) required for the development of hydrogen refuelling stations and fuel cell-powered vehicles.
Figure 4 – Maximum hydrogen pressure reached by a hydrogen thermally driven compressor for different values of the initial pressure.
P re s s u re [ M P a ]
23
The main purpose of the present numerical investigation was to evaluate the time necessary for compressing hydrogen while the compression tank is heated up. The following Figure 5 shows the time evolution of: (i) temperature; (ii) pressure; (iii) hydrogen density in the bulk phase; (iv) mass of hydrogen in the adsorbed phase; (v) high-pressure hydrogen discharge flow; and (vi) low-pressure hydrogen inwards the compressor.
Figure 5a shows the temperature evolution occurring in the thermally driven compressor once the system is heated up. In this stage, the compression tank is taken out of the liquid nitrogen, is kept at room temperature and then exposed to natural convection in ambient air. For this reason, a heat transfer coefficient h equal to 15 W K-1 cm-2 was chosen. The
numerical simulations show that around 400 minutes are necessary to reach the thermal equilibrium between the compression tank and its external environment at room temperature. During this time, the hydrogen pressure increases up to 70 MPa, since hydrogen desorption takes place by warming up the compression tank (Figure 5b).
According to the thermodynamics of adsorption expressed by Eq. (6), 17.85 × 10⁻³ kg of hydrogen are adsorbed on the surface of the AC at 77 K and 4 MPa (Figure 5d). On the other
hand, the calculated amount of hydrogen in the bulk phase was 3 × 10⁻⁴ kg, corresponding to a
hydrogen density of around 12.5 kg m-3 (Figure 5c), which is significantly lower than that of
the adsorbed phase when the compression stage starts. This large discrepancy is due to the amount of AC used in the compressor. For 0.25 kg of AC, it was shown that the volume of
solid adsorbent Vs corresponds to approximately 23% of the total volume of the compression
tank, whereas more than 71% of it corresponds to Va and around 6% is left to the bulk phase
Vg. These amounts were obtained by using the value of Va reported in Table 1. Figure 4d
shows that the amount of hydrogen in the adsorbed phase decreases down to 17.08 × 10⁻³ kg
as a consequence of warming up. This means that 5% of the hydrogen initially adsorbed onto the AC is released towards the bulk phase, whereas 95% of it remains in the adsorbed phase
24
when the system is heated up to room temperature. As a consequence of desorption, hydrogen
density in the bulk phase increases, reaching a value as high as 35 kg m-3.
Figure 5b shows that the maximum pressure of 70 MPa is reached within 50 minutes. The simulation describes the production of a high-pressure hydrogen discharge flow once the desired maximum pressure is reached. Once the pressure inside the compression tank is equal to or higher than the fixed discharge pressure, the discharge valve opens, allowing the high-pressure hydrogen to flow outwards the compression tank. The hydrogen discharge flow is modelled by the following expression:
' = −W*K@ A − K+ (17)
where ' [kg s-1] has the same meaning as in Eq. (14), Pmax [MPa] is the maximum fixed
pressure, P [MPa] is the pressure inside the tank according to Eq. (15), and K [kg s-1 MPa-1] is
a constant relating the discharge flow to the pressure difference. According to Eq. (17), the higher is the pressure difference, the higher is the discharge flow rate. The value of the as-determined constant K strictly depends on the order of magnitude of the amount of hydrogen
participating to the mass balance. Physically acceptable flows were obtained for K = 10-13 kg
s-1 MPa-1. Figure 5e shows that a high-pressure hydrogen discharge flow is produced once the
hydrogen pressure has reached the maximum value of 70 MPa. At the exact moment at which the discharge valve is opened, a maximum discharge flow of around 1.3 × 10⁻⁷ kg s-1 is obtained. The discharge flows vanishes within around 100 minutes, as the pressure difference becomes less important as soon as the discharge valve is opened.
25
Figure 5 – Time evolution of: a) temperature; b) pressure; c) hydrogen density in the bulk phase; d) mass of hydrogen in the adsorbed phase; e) high-pressure hydrogen discharge flow; and f) low-pressure hydrogen inlet flow in a thermally driven compressor of inner volume 0.5 L during the compression stage and the following charging stage.
26
Once high-pressure hydrogen is depleted, the system is plunged again in liquid nitrogen and thus cooled down to 77 K. As a consequence of temperature decrease and adsorption on AC, the hydrogen pressure inside the tank decreases as shown in Figure 5b. Afterwards, hydrogen at 4 MPa and room temperature is introduced into the compression tank to begin a new hydrogen adsorption cycle. Figure 5f shows the evolution of the low-pressure hydrogen flow introduced into the compression tank, evaluated with the similar principles used for the discharge pressure:
' = W*K@ A − K+ (18)
Low-pressure hydrogen is introduced into the tank once the hydrogen pressure inside the tank becomes lower than the minimum pressure of the system, i.e., 4 MPa in the present work. Figure 5a shows that no significant thermal effects take place during the charging process. As a consequence of both the inlet flow and the cooling process, the amount of hydrogen in the adsorbed phase increases. According to the results from the numerical simulation, around 1000 minutes (i.e., 16 hours), are necessary for the amount of hydrogen in the adsorbed phase to reach the initial value again. Afterwards, more hydrogen can be compressed by heating up the compression tank, giving a cyclic operation.
4.3 Discussion
The numerical investigation presented in the previous section was applied to a hydrogen thermally driven compressor consisting of a tank of volume 0.5 L. The results from this study
revealed that a high-pressure hydrogen flow of around 10-4 kg h-1 could be obtained with such
designed system. These values are far from those commonly needed by a hydrogen refuelling station, which are at least 4 orders of magnitude higher [46]. In fact, a thermally driven
27
hydrogen compressor seems to be specially adapted for small- and average-size facilities. Due to the novelty of this kind of compressor, it is not possible to give detailed information about performances and cost. However, it is expected that the capital expenditure for installing it is lower than that demanded for a hydrogen mechanical compressor. A thermally driven hydrogen compressor indeed has no moving parts and hence the maintenance cost should be much lower than that of a mechanical compressor. Moreover, the volume of a thermally driven compressor can be significantly lower, around 22% less than that, much larger, commonly used for a mechanical compressor [15]. Nevertheless, the operating costs might be quite high due to the broad range of working temperatures and the use of liquid nitrogen. Taking again the example of the compression tank of 0.5 L, around 14 L of liquid nitrogen would be needed to reach a stable thermal equilibrium between the compression tank and its external environment. Such a volume can be very difficult to handle, and introduces several issues related to the safety of human operators. Therefore, the volume of liquid nitrogen to be used in a hydrogen adsorption compressor is one of the most relevant drawbacks hindering the development of this technology.
Nevertheless, several aspects must be taken into account for evaluating the potentially achievable high-pressure hydrogen flows by using a thermally driven compressor. One of the severest restrictions of a thermally driven compressor is the too low thermal conductivity of
ACs, which is generally around 0.25 W m-1 K-1 [14] and which represents the limiting factor
of this kind of system. Heat exchange inside the compression tank is hindered when ACs with low thermal conductivity are used, thus the desorption phenomena following the heating phase and the consequent increase of hydrogen pressure may last longer than the value reported above. Higher thermal conductivities around 2 W m-1 K-1 can be achieved if
composite adsorbents based on AC and flexible graphite are used [32], or by imposing a better heat exchange inside the tank through flow coating realised inside the tank in contact
28
with the AC. For this reason, the estimation of the high-pressure hydrogen flow obtained by a thermally driven compressor is quite optimistic when a zero-dimensional model is used. A one-dimensional model taking into account the thermal conductivity may give more realistic results, and this kind of numerical investigation is currently underway.
In addition, the hydrogen discharge flow of a thermally driven compressor also depends on the heat exchange with the external environment, which represents the most important contribution to the thermal balance as shown in Eq. (1). Improvements are possible by
increasing the temperature of the external environment Ta during the compression stage, e.g.
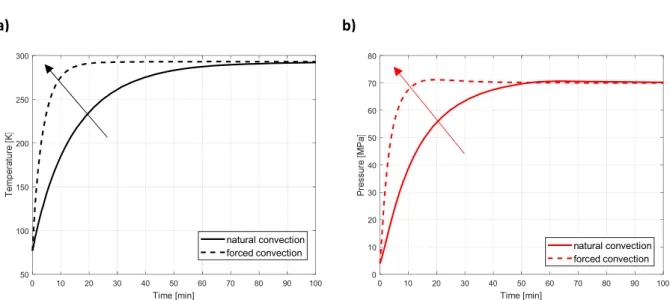
by using an electric heating system instead of keeping the compression tank at room temperature. It was shown that 14% of hydrogen may be desorbed when the system is heated up to 353 K, compared to the 5% obtained by heating at room temperature, thereby significantly increasing the amount of high-pressure hydrogen produced by the compressor. Therefore, a more efficient heat exchange can be obtained by using a higher global heat transfer coefficient h. Figure 6 shows that the compression stage is faster when imposing forced convection (h = 40 W K-1 cm-2) instead of natural convection (h = 15 W K-1 cm-2).
Whereas the system requires approximately 83 minutes to reach room temperature in natural convection, it takes only 20 minutes in forced convection (i.e., 75% less), making the thermally driven compressor work faster. This feature is beneficial in the perspective of using this technology in hydrogen refuelling stations, as more vehicles might be refuelled in a given time.
However, the aforementioned solutions are not advantageous in terms of efficiency, defined as the ratio of compression work to heat input, and in terms of energy consumption. In fact, 500 W must be supplied to the system when heat exchange by forced convection is imposed, while natural convection is completely free. Nevertheless, methods for further reducing
29
energy consumption, increasing the efficiency and reducing the duration of the compression stage, may consist in using cheap waste heat.
Figure 6 – Time evolution of: a) Temperature and b) Pressure in a thermally driven compressor of inner volume 0.5 L during the compression stage by applying natural (continuous line) and forced (discontinuous line) convection for heating.
The low bulk density of the ACs is another strict limitation for a hydrogen adsorption compressor. ACs are indeed porous adsorbents exhibiting large empty spaces, which can only partly host hydrogen molecules by adsorption. At constant specific surface area, the filling of the compression tank directly depends on the bulk density of the solid adsorbent used inside: the higher the bulk density of the adsorbent material, the higher the mass of adsorbent that can be introduced in the tank. Indeed, the higher the bulk density of the adsorbent, the higher the amount of hydrogen that can be adsorbed onto its surface, and hence the higher the amount of high-pressure hydrogen produced by the adsorption compressor. Hence, the use of porous materials having both high bulk density and high specific surface area is highly recommended. The AC chosen for the present numerical investigation, i.e., the MAXSORB
0 10 20 30 40 50 60 70 80 90 100 Time [min] 50 100 150 200 250 300 natural convection forced convection 0 10 20 30 40 50 60 70 80 90 100 Time [min] 0 10 20 30 40 50 60 70 80 natural convection forced convection a) b)
30
30, has a bulk density of 270 kg m-3. Such rather low value somewhat restricts the amount of
solid adsorbent that can be used to fill up the compression tank. In the present study, an amount of 0.15 kg of AC was used to fill a 0.5 L tank, leading to a high-pressure hydrogen
discharge flow of approximately 1.3·10-7 kg s-1, as shown in Figure 5e.
Unlike skeletal density, bulk density is not an intrinsic property of a porous solid thus it can be increased by means of densification processes, or by packing the AC particles closer to each other by tapping and vibrating the stack. Bénard and Chahine [48] found that bulk densities up to 700 kg m-3 can be achieved by optimising the densification, but the latter
lowered the specific surface area from 2778 to 2000 m2 g-1. Celzard et al. [49,50] reported that
a mixture of two granulometric fractions of a KOH-activated anthracite together with moderate compaction (100 kg cm-2) increased by 30% the amounts of stored and delivered
methane for an operational vehicle system using adsorbed natural gas and working at 3.5 MPa and 298 K. A similar strategy might be straightforwardly applied to a hydrogen storage tank, with the promising results expected. In fact, 0.35 kg might be used to fill a volume of 0.5 L if
the bulk density of the ACs was increased up to 700 kg m-3. Thus, the high-pressure hydrogen
flow produced in this conditions would be of about 2.2·10-6 kg s-1, i.e., one order of
magnitude higher than in the case of a bulk density of 270 kg m-3.
5.
Conclusion
The design and the modelling of a hydrogen compressor based on cyclic adsorption-desorption on activated carbon (AC) was described herein. A numerical model based on mass and energy balances occurring in a thermally driven compressor was presented and allowed confirming that hydrogen pressures as high as 70 MPa can be obtained by heating the compression tank from 77 K up to room temperature. Moreover, it was shown that hydrogen
31
discharge flows of about 10-4 kg h-1 can be obtained using a tank volume of 0.5 L filled with
0.25 kg of AC.
However, only 5% of hydrogen in the adsorbed phase was desorbed during the heating/discharging stage, and high volumes of liquid nitrogen were required for the charging stage. These facts restrict the practical applications of a thermally driven hydrogen compressor, and so does the low thermal conductivity of the ACs, which hinders the heat exchange and thus limits the system efficiency. This study aimed at investigating the performances and the feasibility of a hydrogen adsorption compressor through numerical simulations. A prototype tank is presently under construction and the model validation with our own experimental data will be the subject of a forthcoming publication.
Acknowledgements
This study was partly supported by the French PIA project "Lorraine Université d’Excellence", reference ANR-15-IDEX-04-LUE.
32
References
[1] Hosseini SE, Wahid MA. Hydrogen production from renewable and sustainable energy resources: Promising green energy carrier for clean development. Renew Sustain Energy Rev 2016;57:850–66. doi:10.1016/j.rser.2015.12.112.
[2] Yang C, Ogden J. Determining the lowest-cost hydrogen delivery mode. Int J Hydrog Energy 2007;32:268–86. doi:10.1016/j.ijhydene.2006.05.009.
[3] Kikukawa S, Yamaga F, Mitsuhashi H. Risk assessment of Hydrogen fueling stations for 70 MPa FCVs. Int J Hydrog Energy 2008;33:7129–36.
doi:10.1016/j.ijhydene.2008.08.063.
[4] Hitachi Infrastructure Systems (Asia) Pte. Ltd. High-Pressure Hydrogen Compressors (100MPa-class hydrogen compressors for hydrogen refueling stations) n.d.
http://www.hitachi-infra.com.sg/services/_social_infrastructure_systems/compressor/reciprocating/hydrogen .html (accessed April 1, 2019).
[5] Tuhovcak J, Hejcik J, Jicha M. Comparison of heat transfer models for reciprocating compressor. Appl Therm Eng 2016;103:607–15.
doi:10.1016/j.applthermaleng.2016.04.120.
[6] Dwivedi SN. Design Considerations for High-Pressure Reciprocating Compressors for Refinery Services 1990.
[7] The Linde Group. The Hydrogen Technologies. The Ionic Compressor 90 MPa - IC90 n.d.
[8] Lototskyy MV, Yartys VA, Pollet BG, Bowman RC. Metal hydride hydrogen compressors: A review. Int J Hydrog Energy 2014;39:5818–51.
doi:10.1016/j.ijhydene.2014.01.158.
[9] Grigoriev SA, Shtatniy IG, Millet P, Porembsky VI, Fateev VN. Description and
characterization of an electrochemical hydrogen compressor/concentrator based on solid polymer electrolyte technology. Int J Hydrog Energy 2011;36:4148–55.
doi:10.1016/j.ijhydene.2010.07.012.
[10] Corgnale C, Sulic M, Corgnale C, Sulic M. Techno-Economic Analysis of High-Pressure Metal Hydride Compression Systems. Metals 2018;8:469.
doi:10.3390/met8060469.
[11] Stamatakis E, Zoulias E, Tzamalis G, Massina Z, Analytis V, Christodoulou C, et al. Metal hydride hydrogen compressors: Current developments & early markets. Renew Energy 2018;127:850–62. doi:10.1016/j.renene.2018.04.073.
[12] HyET Hydrogen | HyET Hydrogen n.d. https://hyethydrogen.com/ (accessed April 1, 2019).
[13] Suermann M, Kiupel T, Schmidt TJ, Büchi FN. Electrochemical Hydrogen
Compression: Efficient Pressurization Concept Derived from an Energetic Evaluation. J Electrochem Soc 2017;164:F1187–95. doi:10.1149/2.1361712jes.
[14] Sdanghi G, Maranzana G, Celzard A, Fierro V. Review of the current technologies and performances of hydrogen compression for stationary and automotive applications. Renew Sustain Energy Rev 2019;102:150–70. doi:10.1016/j.rser.2018.11.028.
[15] Sdanghi G, Maranzana G, Celzard A, Fierro V. Hydrogen Adsorption on Nanotextured Carbon Materials. Hydrog. Storage Technol., Wiley-Blackwell; 2018, p. 263–320. doi:10.1002/9781119460572.ch9.
[16] Fierro V, Zhao W, Izquierdo MT, Aylon E, Celzard A. Adsorption and compression contributions to hydrogen storage in activated anthracites. Int J Hydrog Energy 2010;35:9038–45. doi:10.1016/j.ijhydene.2010.06.004.
33
[17] Brunauer S. The Adsorption Of Gases And Vapors Vol I. Oxford University Press.; 1943.
[18] Fierro V, Szczurek A, Zlotea C, Marêché JF, Izquierdo MT, Albiniak A, et al. Experimental evidence of an upper limit for hydrogen storage at 77 K on activated carbons. Carbon 2010;48:1902–11. doi:10.1016/j.carbon.2010.01.052.
[19] Rzepka M, Lamp P, de la Casa-Lillo MA. Physisorption of Hydrogen on Microporous Carbon and Carbon Nanotubes. J Phys Chem B 1998;102:10894–8.
doi:10.1021/jp9829602.
[20] Kyriakopoulos G, Doulia D, Anagnostopoulos E. Adsorption of pesticides on porous polymeric adsorbents. Chem Eng Sci 2005;60:1177–86. doi:10.1016/j.ces.2004.09.080. [21] Wang H, Gao Q, Hu J. High Hydrogen Storage Capacity of Porous Carbons Prepared by
Using Activated Carbon. J Am Chem Soc 2009;131:7016–22. doi:10.1021/ja8083225. [22] Richard M-A, Cossement D, Chandonia P-A, Chahine R, Mori D, Hirose K. Preliminary
evaluation of the performance of an adsorption-based hydrogen storage system. AIChE J 2009;55:2985–96. doi:10.1002/aic.11904.
[23] Petitpas G, Bénard P, Klebanoff LE, Xiao J, Aceves S. A comparative analysis of the cryo-compression and cryo-adsorption hydrogen storage methods. Int J Hydrog Energy 2014;39:10564–84. doi:10.1016/j.ijhydene.2014.04.200.
[24] Ahluwalia RK, Peng JK. Automotive hydrogen storage system using cryo-adsorption on activated carbon. Int J Hydrog Energy 2009;34:5476–87.
doi:10.1016/j.ijhydene.2009.05.023.
[25] Moreno-Blanco J, Petitpas G, Espinosa-Loza F, Elizalde-Blancas F, Martinez-Frias J, Aceves SM. The fill density of automotive cryo-compressed hydrogen vessels. Int J Hydrog Energy 2019;44:1010–20. doi:10.1016/j.ijhydene.2018.10.227.
[26] Xiao J, Peng R, Cossement D, Bénard P, Chahine R. Heat and mass transfer and fluid flow in cryo-adsorptive hydrogen storage system. Int J Hydrog Energy 2013;38:10871– 9. doi:10.1016/j.ijhydene.2013.04.042.
[27] Xiao J, Tong L, Deng C, Bénard P, Chahine R. Simulation of heat and mass transfer in activated carbon tank for hydrogen storage. Int J Hydrog Energy 2010;35:8106–16. doi:10.1016/j.ijhydene.2010.01.021.
[28] Xiao J, Peng R, Cossement D, Bénard P, Chahine R. CFD model for charge and
discharge cycle of adsorptive hydrogen storage on activated carbon. Int J Hydrog Energy 2013;38:1450–9. doi:10.1016/j.ijhydene.2012.10.119.
[29] Xiao J, Tong L, Cossement D, Bénard P, Chahine R. CFD simulation for charge– discharge cycle of cryo-adsorptive hydrogen storage on activated carbon. Int J Hydrog Energy 2012;37:12893–904. doi:10.1016/j.ijhydene.2012.05.079.
[30] Xiao J, Bénard P, Chahine R. Adsorption–desorption cycle thermodynamics for adsorptive hydrogen storage system. Int J Hydrog Energy 2016;41:6139–47. doi:10.1016/j.ijhydene.2015.11.024.
[31] Xiao J, Bénard P, Chahine R. Charge-discharge cycle thermodynamics for compression hydrogen storage system. Int J Hydrog Energy 2016;41:5531–9.
doi:10.1016/j.ijhydene.2015.12.136.
[32] Hardy B, Tamburello D, Corgnale C. Hydrogen storage adsorbent systems acceptability envelope. Int J Hydrog Energy 2018;43:19528–39. doi:10.1016/j.ijhydene.2018.08.140. [33] DOE Technical Targets for Onboard Hydrogen Storage for Light-Duty Vehicles |
Department of Energy n.d. https://energy.gov/eere/fuelcells/doe-technical-targets-onboard-hydrogen-storage-light-duty-vehicles (accessed February 28, 2017).
[34] Hermosilla-Lara G, Momen G, Marty PH, Le Neindre B, Hassouni K. Hydrogen storage by adsorption on activated carbon: Investigation of the thermal effects during the
34
charging process. Int J Hydrog Energy 2007;32:1542–53. doi:10.1016/j.ijhydene.2006.10.048.
[35] Dubinin MM. Adsorption in micropores. J Colloid Interface Sci 1967;23:487–99. doi:10.1016/0021-9797(67)90195-6.
[36] Dubinin MM. Fundamentals of the theory of adsorption in micropores of carbon adsorbents: Characteristics of their adsorption properties and microporous structures. Carbon 1989;27:457–67. doi:10.1016/0008-6223(89)90078-X.
[37] Amankwah KAG, Schwarz JA. A modified approach for estimating pseudo-vapor pressures in the application of the Dubinin-Astakhov equation. Carbon 1995;33:1313–9. doi:10.1016/0008-6223(95)00079-S.
[38] Do DD, Do HD. Adsorption of supercritical fluids in non-porous and porous carbons: analysis of adsorbed phase volume and density. Carbon 2003;41:1777–91.
doi:10.1016/S0008-6223(03)00152-0.
[39] Richard M-A, Benard P, Chahine R. Gas adsorption process in activated carbon over a wide temperature range above the critical point. Part 1: modified Dubinin-Astakhov model. Adsorpt-J Int Adsorpt Soc 2009;15:43–51. doi:10.1007/s10450-009-9149-x. [40] Bénard P, Chahine R. Determination of the Adsorption Isotherms of Hydrogen on
Activated Carbons above the Critical Temperature of the Adsorbate over Wide
Temperature and Pressure Ranges. Langmuir 2001;17:1950–5. doi:10.1021/la001381x. [41] Nasrifar K. Comparative study of eleven equations of state in predicting the
thermodynamic properties of hydrogen. Int J Hydrog Energy 2010;35:3802–11. [42] Durette D, Bénard P, Zacharia R, Chahine R. Investigation of the hydrogen adsorbed
density inside the pores of MOF-5 from path integral grand canonical Monte Carlo at supercritical and subcritical temperature. Sci Bull 2016.
[43] Czerny AM, Bénard P, Chahine R. Adsorption of Nitrogen on Granular Activated Carbon: Experiment and Modeling. Langmuir 2005;21:2871–5. doi:10.1021/la0479760. [44] Gadiou R, Saadallah S, Piquero T, David P, Parmentier J, Vix-Guterl C. The influence
of textural properties on the adsorption of hydrogen on ordered nanostructured carbons. Mic Mes Mater 2005 2005;79:121–8.
[45] Schaefer S, Fierro V, Izquierdo MT, Celzard A. Assessment of hydrogen storage in activated carbons produced from hydrothermally treated organic materials. Int J Hydrog Energy 2016;41:12146–56. doi:10.1016/j.ijhydene.2016.05.086.
[46] Reddi K, Elgowainy A, Sutherland E. Hydrogen refueling station compression and storage optimization with tube-trailer deliveries. Int J Hydrog Energy 2014;39:19169– 81. doi:10.1016/j.ijhydene.2014.09.099.
[47] Wang LW, Tamainot-Telto Z, Thorpe R, Critoph RE, Metcalf SJ, Wang RZ. Study of thermal conductivity, permeability, and adsorption performance of consolidated
composite activated carbon adsorbent for refrigeration. Renew Energy 2011;36:2062–6. doi:10.1016/j.renene.2011.01.005.
[48] Bénard P, Chahine R. Modeling of adsorption storage of hydrogen on activated carbons. Int J Hydrog Energy 2001;26:849–55. doi:10.1016/S0360-3199(01)00018-0.
[49] Celzard A, Fierro V. Preparing a Suitable Material Designed for Methane Storage: A Comprehensive Report. Energy Fuels 2005;19:573–83. doi:10.1021/ef040045b. [50] Celzard A, Albiniak A, Jasienko-Halat M, Marêché JF, Furdin G. Methane storage
capacities and pore textures of active carbons undergoing mechanical densification. Carbon 2005;43:1990–9. doi:10.1016/j.carbon.2005.03.022.

![Table 1 shows the fixed parameters used to validate the model. Information regarding the geometry of the system, i.e., the area where the heat transfer takes place and the mass of the tank, were estimated from literature data [22] related to](https://thumb-eu.123doks.com/thumbv2/123doknet/14505305.528674/22.892.98.803.741.1157/parameters-validate-information-regarding-geometry-transfer-estimated-literature.webp)