HAL Id: inserm-01155119
https://www.hal.inserm.fr/inserm-01155119
Submitted on 26 May 2015HAL is a multi-disciplinary open access archive for the deposit and dissemination of sci-entific research documents, whether they are pub-lished or not. The documents may come from teaching and research institutions in France or abroad, or from public or private research centers.
L’archive ouverte pluridisciplinaire HAL, est destinée au dépôt et à la diffusion de documents scientifiques de niveau recherche, publiés ou non, émanant des établissements d’enseignement et de recherche français ou étrangers, des laboratoires publics ou privés.
Self-rated health and mortality: short- and long-term
associations in the Whitehall II study.
Archana Singh-Manoux, Alice Guéguen, Pekka Martikainen, Jane Ferrie,
Michael Marmot, Martin Shipley
To cite this version:
Archana Singh-Manoux, Alice Guéguen, Pekka Martikainen, Jane Ferrie, Michael Marmot, et al.. Self-rated health and mortality: short- and long-term associations in the Whitehall II study.. Psychosomatic Medicine, Lippincott, Williams & Wilkins, 2007, 69 (2), pp.138-43. �10.1097/PSY.0b013e318030483a�. �inserm-01155119�
Self rated health and mortality: short and long term associations in the Whitehall II study Archana Singh-Manoux*1,2 Alice Guéguen1 Pekka Martikainen2,3 Jane Ferrie2 Michael Marmot2 Martin Shipley2 *
Corresponding author & address 1
INSERM, U687
HNSM, 14 rue du Val d'Osne 94415 Saint-Maurice Cédex France Tel: + 33 (0)1 45 18 38 63 Fax: + 33 (0)1 45 18 38 89 Email: Archana.Singh-Manoux@st-maurice.inserm.fr 2
Department of Epidemiology and Public Health University College London, United Kingdom
3
Population Research Unit, Department of Sociology, P.O. Box 18, 00014 University of Helsinki, Finland.
Abstract
Objectives: Self-rated-health (SRH) refers to a single-item measure of health status where individuals are asked to rate their own health. SRH has been shown to predict mortality. It is unclear if it predicts mortality equally well in men and in women and whether the predictive ability of SRH diminishes with time.
Methods: Data (6316 men and 3035 women) are drawn from the Whitehall II study. SRH and covariates were measured at baseline (1985-1988) when the average age of individuals was 44.5 years (SD=6.1). Mortality follow-up was available for a mean of 17.5 years and was classified as having occurred in the first 10 years or the subsequent period of follow-up, ranging from 6 to 9 years. The association between SRH and mortality was assessed using a Cox regression model with Relative Index of Inequality (RII) to summarize associations. Results: There were no sex differences in the association between SRH and mortality in either the short (p = 0.39) or the long term (p = 0.16). Sex-adjusted short term association (RII = 3.80, 95% CI: 2.28, 6.35) was significantly (p=0.004) stronger than the long term
association (RII = 1.56, 95% CI: 1.04, 2.34). Explanatory variables accounted for 80% of the SRH-mortality association in men and 29% in women.
Conclusions: SRH predicts mortality equally well in men and women. However, the covariates explained a much larger proportion of the SRH-mortality relationship in men compared to women. In this middle-aged cohort, SRH predicts mortality strongly in the short term but only weakly in the long term.
Abbreviations
SRH: Self rated health ECG: Electrocardiogram CHD: Coronary Heart Disease ANOVA: Analysis of Variance RII: Relative Index of Inequality CI: Confidence Interval
Self-rated-health (SRH) refers to a single-item measure of health status where individuals are asked to rate their own health, usually on a 5-point scale. The first clear demonstration of a link between self rated health (SRH) and mortality in the early 1980s (1) has been followed by several studies showing the same to be true in different cultures
(2,3,4,5,6,7); both in adulthood (2,6,7,8,9,10,11,12,13) and in old age (1,3,14,15;16,17,18,19). For research purposes and for population health monitoring in particular the implication of this association between SRH and mortality is that asking a simple question might be as good as collecting extensive biological data. Thus, it is important to ascertain whether SRH predicts mortality in different population sub-groups and over different follow-up periods. Some studies suggest that SRH does not predict mortality in women (2,3,4,15,17,18,19,20,21), others report no sex differences (8,14) or stronger associations between SRH and mortality in women (16,22). Women have been widely reported to have poorer SRH (23,24), although this difference disappears at older ages (25,26). Thus, women report poorer SRH but experience longer life (27).
It is possible that some of this inconsistency in the association between SRH and mortality stems from the age at which the association between SRH and mortality is examined as the association has been shown to be weaker at older ages (1,2,3,8,9,28). Another possible factor is the length of follow-up; results on the elderly suggest that it is an important modifier of the SRH-mortality association (14,15,16), with some evidence of declining predictive ability over time in women (16). The objectives of this paper are to examine the link between SRH and mortality in a middle-aged sample with a view to addressing the following
questions:
1. Does SRH in midlife predict subsequent mortality and does this predictive ability decline over time?
2. Are there any gender differences in the predictive ability of SRH, either in the short- or the long-term?
3. What explains the predictive ability of SRH? The explanatory factors considered are early life factors, socio-demographic measures, health behaviors and measures of health status. (4,5).
MATERIALS & METHODS The Whitehall II Study
The Whitehall II study was established in 1985 as a longitudinal study to examine the socioeconomic gradient in health and disease among 10,308 civil servants (6,895 men and 3,413 women) (29). All civil servants aged 35-55 years in 20 London based departments were invited by letter to participate, and 73 percent agreed. The baseline examination (Phase 1) took place during 1985-1988, and involved a clinical examination and a self-administered questionnaire containing sections on demographic characteristics, health, lifestyle factors, work characteristics, social support and life events. Clinical examination included measures of blood pressure, anthropometry, biochemical measurements, neuroendocrine function, and sub clinical markers of cardiovascular disease. Subsequent phases of data collection have alternated between postal questionnaire alone (Phases 2 (1989-1990), 4 (1995-1996), and 6 (2001)) and postal questionnaire accompanied by a clinical examination (Phases 3 (1991-1993), 5 (1997-1999) and 7 (2003-2004). The University College London ethics committee approved the study.
Measures
Self rated health was assessed at Phase 1 (1985-1988) of the study with the question: “Over the last 12 months would you say your health has been - very good, good, average, poor or very poor”.
Mortality: 10301 (99.9 percent) of respondents were traced for mortality from the baseline through the national mortality register kept by the National Health Services Central Registry, by using the National Health Service identification number assigned to each British citizen. Mortality follow-up was available until 30th September, 2004; a mean of 17.5 years with all surviving respondents having a minimum of 16 years follow-up. Deaths were classified as having occurred in the first 10 years (Year 0-10) or the subsequent period, ranging from 6 to 9 years (Year 10 +).
Explanatory variables measured at baseline (Phase 1, 1985-1988).
Age was calculated from the date of birth taken from the questionnaire at baseline. Early life factors/ parental longevity were assessed via two measures: height and age of death of parents. Height, an indicator of early life environment, was measured at the phase 1 screening examination. Parental longevity was assessed from the response to questions on whether either parent had died and, if so, their age at death. These responses were combined and grouped according to whether both, one or neither parent died at or before age 70.
Socio-demographic measures were occupational position and marital status.
Occupational position was the British civil service grade of employment at Phase 1; a three level variable representing high (administrative grades), intermediate (professional or
executive grades) and low (clerical or support grades) grades. People in different grades differ with respect to salary, social status and level of responsibility. Marital status was assessed by
questionnaire and consisted of the following categories: married or cohabiting, never married, separated or divorced, widowed.
Health behaviors: The measure of smoking was a 5-level variable derived from several questions on smoking – never/ex/light/medium and heavy smoker. Alcohol consumption was assessed via questions on the number of alcoholic drinks (“measures” of spirits, “glasses” of wine, and “pints” of beer) consumed in the last seven days. This was converted to number of units of alcohol consumed in the last week. Frequency of fruit and vegetable consumption was assessed on an 8-point scale going from ‘seldom or never’ to ‘2 or more times a day’. Physical activity was assessed using questionnaire data: participants were asked about the frequency and duration of their participation in ‘mildly energetic’ (e.g., weeding, general housework, bicycle repair), ‘moderately energetic’ (e.g., dancing, cycling, leisurely swimming) and ‘vigorous physical activity’ (e.g., running, hard swimming, squash). The frequency and duration measures were combined to three levels of activity: low, medium and high.
Health: Seven measures of health were used. The presence of respiratory illness was detected using the Medical Research Council chronic bronchitis questionnaire (30). The category diabetes included self-report of doctor diagnosis or being on medication for diabetes. Electrocardiogram (ECG) abnormalities were probable/possible ischemia identified on ECG during the medical examination at baseline. The category hypertension included all
participants on antihypertensive medication or with a systolic or diastolic blood pressure greater or equal to 160 or 95 mm Hg respectively. Diagnosed heart trouble was assessed through self report of doctor diagnosis of coronary heart disease (CHD). Mental health was measured using caseness criteria (score ≥ 5) on the General Health questionnaire (31). Sickness absence was assessed through a question on number of sick days taken in the past year.
Statistical analysis
Sex difference in SRH was assessed using chi-square analysis. Descriptive analyses to examine the association between SRH and explanatory variables were carried out and tested using chi-square analysis for trend for categorical variables and by fitting a linear trend across the SRH categories for continuous variables. The distributions for units of alcohol consumed and number of sick days were skewed and therefore logged values of these measurements (after the addition of one to all values to remove the zeros) were used in all analyses.
Mortality rates for each SRH category (very good, good, average, poor or very poor) were calculated using person years at risk, expressed as deaths per 1000 person years. The association between SRH and mortality was examined using Cox regression in order to model survival time subsequent to assessment of SRH for each individual. A key assumption of Cox regression is the proportionality of hazards assumption, requiring the hazard ratio to be constant over the entire follow-up period (here 16-19 years). This assumption was tested using an interaction term between log-time and SRH in Cox regression. As there was evidence for non-proportionality of hazards over time, we carried out subsequent analysis separately for the short (follow-up Year 0-10) and long term (Year 10+) follow-up (32). This analysis was carried out using two strategies. The first was to model SRH as a categorical variable, where the first category (‘very good’ SRH) was the reference. Thus, the hazards-ratio for each subsequent category provides the relative likelihood of death compared to those with ‘very good’ SRH, the reference category.
The second strategy was to model the association between SRH and mortality using a summary measure called the Relative Index of Inequality (RII) (33). The RII is useful as one hazard ratio replaces the four obtained using the categories of SRH. Furthermore, the analyses for assessment of the importance of explanatory factors to the association between SRH and mortality become less cumbersome. The RII is a regression based measure, calculated by
creating a scale from 0 to 1 to indicate the two extremes of an underlying SRH distribution. A value of 0 represents the best SRH and 1 represents the worst SRH. Each SRH category (very good, good, average, poor, very poor) covers a range on this scale that is proportional to the number of individuals who endorsed that SRH category and it is given a value on the scale corresponding to the cumulative midpoint of its range. This procedure transforms a
hierarchical categorical variable into a continuous variable. For example, a measure having the frequency distribution of 30%, 40%, 20%, 8% and 2% would be transformed into a single scale taking the values 0.15, 0.50, 0.80, 0.94 and 0.99 for the five categories. The resulting Cox regression using the transformed SRH variable as a predictor estimates the hazard ratio for the worst SRH compared to the best SRH; the estimation takes into account data from all SRH categories and the index is weighted to reflect the size of these categories. Thus, an RII of 1.5 indicates that the mortality hazard between the extreme ends of the SRH distribution is 1.5 times higher for the worst compared to the best SRH; an RII of 1.00 would indicate equal mortality hazard. The RIIs were compared (men and women and long and short term) using a z-test.
The covariates were included in the regression model in successive models, using predefined categories of early life factors, socio-demographic variables, health behaviors and measures of health. The explanatory power of the covariates was examined by using the percentage reduction in RII (RIIcontrolling for age – RIIcontrolling for age and explanatory factor) / ( RIIcontrolling for age – 1)×100) when these variables were added to the model containing age, SRH and mortality. The percentage reduction in RII calculated in this way indicates the extent to which the covariates explain the SRH-mortality association and not the extent to which they predict mortality themselves. The original continuous (logged values of units of alcohol consumed and number of sick days) and fully categorized explanatory variables were used in these models.
RESULTS
Of the 10308 participants (6895 men and 3413 women) at baseline screening, 6316 (91.6 percent) men and 3035 (88.9 percent) women had complete data on SRH, mortality and all the covariates examined in this paper. Table 1 presents the SRH distribution as a function of sex. Women reported poorer SRH (p<0.0001), 7.1 percent of women reported poor or very poor health compared to 3.7 percent of men.
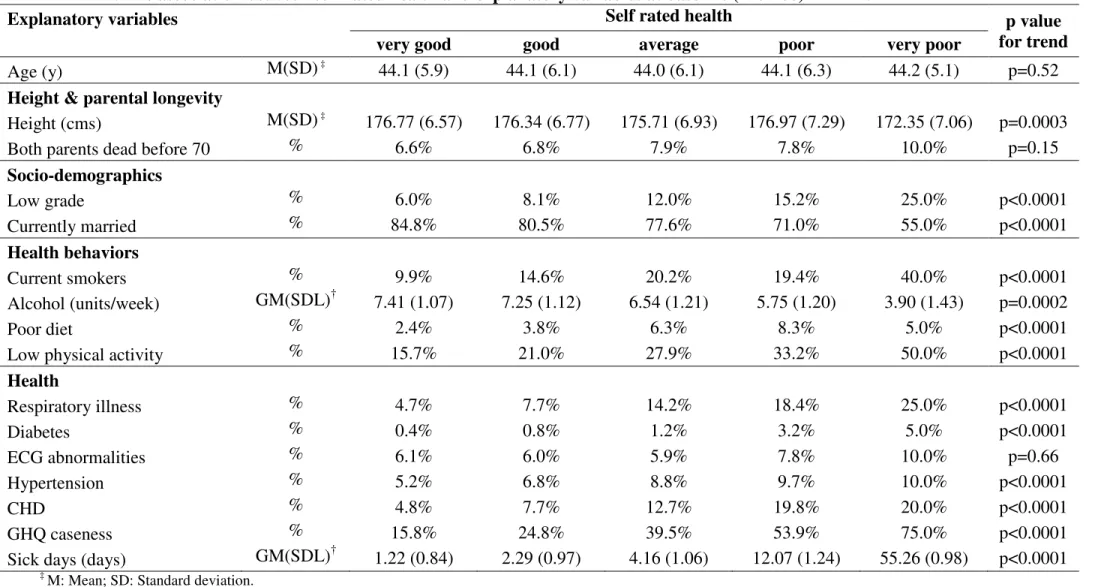
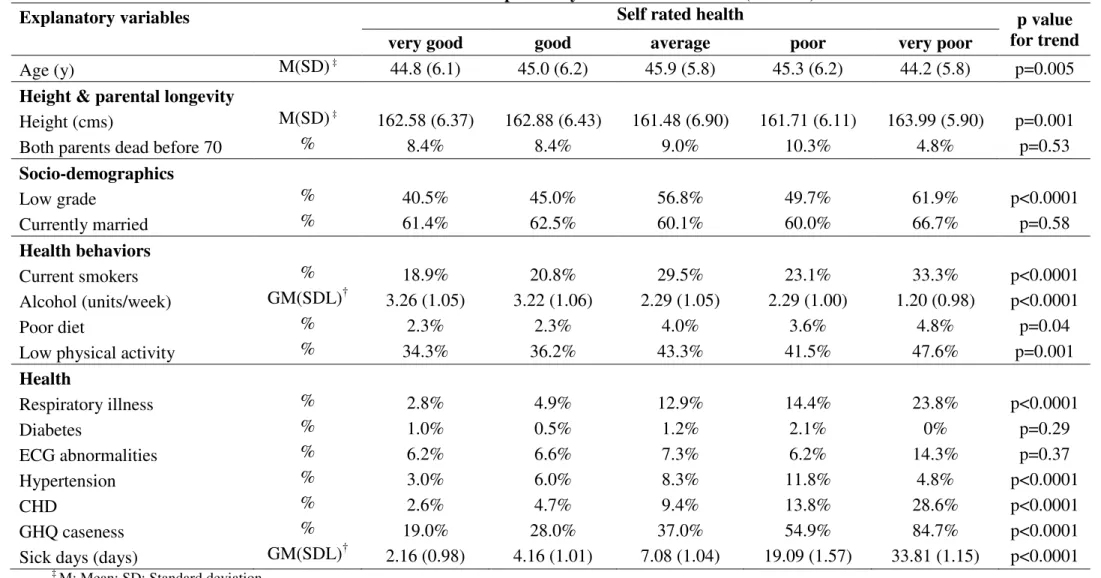
The association between SRH and the explanatory variables are presented in Table 2 for men and Table 3 for women. In men (Table 2), SRH was associated with all explanatory variables except age (p=0.52), parental longevity (p=0.15) and presence of ECG abnormalities (p=0.66). In women (Table 3), SRH was associated with all explanatory variables except parental longevity (p=0.53), being married (p=0.58) diabetes (p=0.29), and presence of ECG abnormalities (p=0.37).
Analysis of the association between SRH and mortality was carried out separately in the short (follow-up first ten years) and the long term (follow-up longer than 10 years, ranging from 16 to 19 years) as the test of non proportionality of hazards over the total follow-up period indicated declining hazards over time (χ2 = 6.43, p=0.01). Table 4 shows the mortality rates and the hazards-ratio associated with the five categories of SRH in men and in women and the summary measure using RII. In almost all cases we observed a monotonically increasing mortality with declining SRH. However, apart from the few men who rated their health as being “very poor”, the trend in SRH with long term mortality was weaker and statistically non significant. Also, the RIIs confirmed this weaker association in the long term in men (RII = 1.62, 95% CI: 0.98, 2.68) and in women (RII = 1.46, 95% CI: 0.73, 2.93). The SRH-mortality relationship was not significantly different in the two sexes either in the short (z = 0.53, p=0.30) or the long term (z = 0.23, p=0.41). In analyses combining men and women
the short term association (RII = 3.80, 95% CI: 2.28, 6.35) was significantly stronger (z = 2.68, p=0.004) than the long term association (RII = 1.56, 95% CI: 1.04, 2.34).
Table 5 shows the SRH-mortality relationship after adjustment for explanatory variables, carried out only for the short term associations as the long term associations (in analysis stratified by sex) between SRH and mortality were not statistically significant. Eighty percent of the association between SRH and mortality in men, compared with only 29 percent in women, was explained by the covariates examined in this study. In fact, SRH continued to be associated significantly with mortality (follow-up Year 0-10) in women after adjustment for all explanatory variables (RII = 3.63, 95% CI: 1.25, 10.53). Measures of health had the strongest explanatory role in men (66 percent) and health behaviors (23 percent) and health measures (22%) were equally important in women. Health behaviors were slightly more important in men (31 percent) compared to women (23 percent). Early life factors had little or no explanatory role in either men or women.
DISCUSSION
A single measure of self rated health was used to predict mortality in middle-aged individuals drawn from a large prospective cohort study of British civil servants. Although women reported poorer SRH at baseline, the association between the measure of SRH used in this study and mortality was similar in men and women in the short and the long term. Our results show that duration of follow-up is an important modifier of the SRH-mortality relationship in this group of middle-aged men and women; the short term association is stronger than the long term association. The explanatory variables explained more than three-quarters of the SRH-mortality association in men while they explained less than a third in women. In women, there remained a statistically significant relationship between SRH and mortality after adjustment for multiple covariates at the short term follow-up.
Before further discussion of the results it is important to consider the implications of the analytical strategy adopted in this paper. Associations between SRH and mortality are usually examined by comparing the worst category (‘very poor’ SRH) to the best category (‘very good’ SRH) despite evidence of a dose-response relationship.4 This approach has been popular as it provides a summary index of the association between SRH and mortality.
However, the results can be misleading and attempts have been made to use information from all five SRH categories. One approach is to dichotomize the 5-point measure by grouping the first two or three categories as ‘good’ SRH and the others as ‘poor’ SRH and then comparing these two groups. We use the RII, a summary measure that has the advantage of comparing mortality risk at the extremes of the SRH distribution, but is estimated using data from all SRH groups and is weighted to account for the size of these groups.
This study adds to the existing literature by examining the SRH-mortality relationship over time. The follow-up times in previous studies have ranged from a few months (16) to as much as 27 years in a study on young men (11). The few studies to have explicitly examined differences in the strength of the association as a function of the length of follow-up are on the elderly (14,15,16). The results from these studies are not consistent: Benyamini et al. found SRH to predict short term (4-year follow-up) but not long term mortality (9-year follow-up) in either men or women aged over 75 years (14), Deeg et al. found the SRH
mortality association only in men (aged 55-85), with hazards being similar in the short (3-year follow-up) and the long term (7.5 year follow-up) (15), and Grant et al. report declining hazards in women but not in men over a 3-year period in individuals over 70 years old (16).
In the elderly, it is possible that the normative decline in health (thus changing SRH) over time could, in itself, lead to decrease in the long term association between SRH and mortality. The same could also be true in a middle aged population. A recent study examined the 59-year longitudinal trajectory of SRH and concluded that it was relatively stable till age
50, with men consistently rating their health as better than women. After age 50, a steep decline in SRH among men left no gender differences in SRH by late adulthood (34). Given the age of our respondents (average age at baseline is 44.5, SD = 6.1), it is possible that changes in SRH account for some of the weakening of its relationship with mortality over the longer term. Furthermore, the measure of SRH health asks individuals to rate their health over the last twelve months rather than future or anticipated health; even if SRH were a very accurate and inclusive measure of health status it is not likely it would continue to be accurate over a prolonged period of time. SRH in our data predicts long-term mortality (in analyses combining men and women) but it was substantially weaker than the short term association.
In our sample, the ‘proportionality of hazards’ assumption, required for Cox regression, held over the 10-year period. In other words, one measure of SRH will predict mortality in a middle-aged population for the following ten years, referred to here as the ‘short-term’ period. Thus, the evidence from our and other studies (16) indicates that the delineation of the follow-up period into short and long periods is dependent on the age of the participants of the study. As the decline in SRH intensifies around age 50 (34), the ability of SRH to predict mortality is likely to be better in younger populations. The implication of this finding for research and health monitoring is that in older populations more frequent
assessments of SRH may be required. Till middle age, SRH is an easy and reliable measure, at least during the first 10 years of follow-up.
The SRH-mortality association was similar in men and women in the short and long term. The documentation and explanation of gender differences in the SRH-mortality relationship has been a major focus of research in this field. While some studies have found SRH to be a weak predictor of mortality in women (2,3,4,15,17,18,19,20,21), others have either found no sex differences (8,14) or stronger relationships in women (16,22). Our data show no sex differences in the overall SRH-mortality gradient in middle-aged men and
women despite differences in the univariate distribution of SRH, more women reported poor or very poor health. This suggests that differences across the SRH scale are being interpreted in a similar fashion by men and women.
Examination of the association between SRH and explanatory variables reveals minor sex differences, thus, men and women appear to use similar criteria to judge SRH. It has been suggested that even when there are no sex differences in the prevalence of chronic diseases, men experience more severe forms of these conditions (27,35). In men, measures of health explained around 66 percent of the SRH-mortality association whereas they explained only 22 percent in women. As a result, all the explanatory variables together explained a much larger proportion of the mortality relationship in men compared to women. In fact, the SRH-mortality association remained statistically significant after adjustment for all explanatory variables in women. Given the similarity in the SRH-mortality association in men and women and the differential impact of the explanatory variables, further research is required to
understand the mechanisms that explain the SRH–mortality association in women. A starting point would be to look at cause specific mortality, something our study is still underpowered to do. A further avenue of research could be to explore the impact of other measures of health.
There are some caveats to the results reported here. As the respondents are middle-aged the mortality rate is low, and in women results are based on a smaller number of deaths. Also, Whitehall II is not a population sample and it is likely that the explanatory variables will have different associations with both SRH and mortality in different samples. In this occupational cohort, there were no sex differences in the association between SRH and mortality but it is possible that working women differ from women in the general population.
Although the SRH –mortality relationship has been widely examined, it is little
understood as there have been few attempts to examine factors that moderate this relationship and the conditions under which it strengthens, weakens or disappears. Our results clearly
show that the SRH relationship to be stronger at shorter follow-up periods. Furthermore, there were no sex differences in the strength of this association in this middle-aged cohort. SRH appears to be a multidimensional phenomenon (4,36), and was related to socio-demographic variables, health behaviors and objective measures of health similarly in both men and women. These variables explained more of the SRH-mortality association in men than in women. Our results show SRH to be a pertinent, global measure of health status, particularly so in the short term.
Acknowledgements
The Whitehall II study has been supported by grants from the British Medical Research Council (MRC); the British Heart Foundation; the British Health and Safety Executive; the British Department of Health; the National Heart, Lung, and Blood Institute (grant HL36310); the National Institute on Aging (grant AG13196); the Agency for Health Care Policy and Research (grant HS06516); and the John D. and Catherine T. MacArthur Foundation Research Networks on Successful Midlife Development and Socioeconomic Status and Health.
We thank all of the participating civil service departments and their welfare,
personnel, and establishment officers; the British Occupational Health and Safety Agency; the British Council of Civil Service Unions; all participating civil servants in the Whitehall II study; and all members of the Whitehall II study team.
TABLE 1. Self rated health at baseline (1985-88) in men and women in the Whitehall II study.
Self rated health MEN WOMEN
N = 6316 N=3035 Very good 2258 (35.8%) 772 (25.4%) Good 2664 (42.2%) 1195 (39.4%) Average 1157 (18.3%) 852 (28.1%) Poor 217 (3.4%) 195 (6.4%) Very poor 20 (0.3%) 21 (0.7%)
TABLE 2. The association between self rated health and explanatory variables at baseline (1985-88) in MEN
Explanatory variables Self rated health p value
for trend very good good average poor very poor
Age (y) M(SD) ‡ 44.1 (5.9) 44.1 (6.1) 44.0 (6.1) 44.1 (6.3) 44.2 (5.1) p=0.52
Height & parental longevity
Height (cms) M(SD) ‡ 176.77 (6.57) 176.34 (6.77) 175.71 (6.93) 176.97 (7.29) 172.35 (7.06) p=0.0003 Both parents dead before 70 % 6.6% 6.8% 7.9% 7.8% 10.0% p=0.15
Socio-demographics Low grade % 6.0% 8.1% 12.0% 15.2% 25.0% p<0.0001 Currently married % 84.8% 80.5% 77.6% 71.0% 55.0% p<0.0001 Health behaviors Current smokers % 9.9% 14.6% 20.2% 19.4% 40.0% p<0.0001 Alcohol (units/week) GM(SDL)† 7.41 (1.07) 7.25 (1.12) 6.54 (1.21) 5.75 (1.20) 3.90 (1.43) p=0.0002 Poor diet % 2.4% 3.8% 6.3% 8.3% 5.0% p<0.0001 Low physical activity % 15.7% 21.0% 27.9% 33.2% 50.0% p<0.0001
Health Respiratory illness % 4.7% 7.7% 14.2% 18.4% 25.0% p<0.0001 Diabetes % 0.4% 0.8% 1.2% 3.2% 5.0% p<0.0001 ECG abnormalities % 6.1% 6.0% 5.9% 7.8% 10.0% p=0.66 Hypertension % 5.2% 6.8% 8.8% 9.7% 10.0% p<0.0001 CHD % 4.8% 7.7% 12.7% 19.8% 20.0% p<0.0001 GHQ caseness % 15.8% 24.8% 39.5% 53.9% 75.0% p<0.0001 Sick days (days) GM(SDL)† 1.22 (0.84) 2.29 (0.97) 4.16 (1.06) 12.07 (1.24) 55.26 (0.98) p<0.0001
‡ M: Mean; SD: Standard deviation.
TABLE 3. The association between self rated health and explanatory variables at baseline (1985-88) in WOMEN
Explanatory variables Self rated health p value
for trend very good good average poor very poor
Age (y) M(SD) ‡ 44.8 (6.1) 45.0 (6.2) 45.9 (5.8) 45.3 (6.2) 44.2 (5.8) p=0.005
Height & parental longevity
Height (cms) M(SD) ‡ 162.58 (6.37) 162.88 (6.43) 161.48 (6.90) 161.71 (6.11) 163.99 (5.90) p=0.001 Both parents dead before 70 % 8.4% 8.4% 9.0% 10.3% 4.8% p=0.53
Socio-demographics Low grade % 40.5% 45.0% 56.8% 49.7% 61.9% p<0.0001 Currently married % 61.4% 62.5% 60.1% 60.0% 66.7% p=0.58 Health behaviors Current smokers % 18.9% 20.8% 29.5% 23.1% 33.3% p<0.0001 Alcohol (units/week) GM(SDL)† 3.26 (1.05) 3.22 (1.06) 2.29 (1.05) 2.29 (1.00) 1.20 (0.98) p<0.0001 Poor diet % 2.3% 2.3% 4.0% 3.6% 4.8% p=0.04
Low physical activity % 34.3% 36.2% 43.3% 41.5% 47.6% p=0.001
Health Respiratory illness % 2.8% 4.9% 12.9% 14.4% 23.8% p<0.0001 Diabetes % 1.0% 0.5% 1.2% 2.1% 0% p=0.29 ECG abnormalities % 6.2% 6.6% 7.3% 6.2% 14.3% p=0.37 Hypertension % 3.0% 6.0% 8.3% 11.8% 4.8% p<0.0001 CHD % 2.6% 4.7% 9.4% 13.8% 28.6% p<0.0001 GHQ caseness % 19.0% 28.0% 37.0% 54.9% 84.7% p<0.0001 Sick days (days) GM(SDL)† 2.16 (0.98) 4.16 (1.01) 7.08 (1.04) 19.09 (1.57) 33.81 (1.15) p<0.0001
‡
M: Mean; SD: Standard deviation.
TABLE 4. Self rated health and mortality in the Whitehall II men and women. Self rated health Mortality Follow-up Interval Yr 0-10 Mortality Follow-up Interval Yr 10+ Rate† (No. of events)
Hazard ratio‡ (95% CI) Rate† (No. of events)
Hazard ratio‡ (95% CI)
MEN 2.3 (146) 4.6 (209) Very good 1.7 (39) 1.0 4.1 (68) 1.0 Good 2.0 (54) 1.17 (0.78, 1.77) 4.3 (84) 1.05 (0.76, 1.44) Average 3.1 (35) 1.78 (1.13, 2.81) 5.0 (42) 1.22 (0.83, 1.79) Poor 8.6 (18) 4.95 (2.83, 8.6) 6.7 (10) 1.66 (0.85, 3.22) Very poor 0.0 (0) 0.0 36.8 (5) 10.11 (4.07, 25.10) RII 3.46 (1.87, 6.40) 1.62 (0.98, 2.68) WOMEN 2.2 (66) 4.8 (107) Very good 1.0 (8) 1.0 4.2 (24) 1.0 Good 1.9 (22) 1.75 (0.78, 3.93) 4.6 (40) 1.07 (0.65, 1.78) Average 3.3 (28) 2.95 (1.34, 6.47) 5.2 (32) 1.14 (0.67, 1.94) Poor 2.6 (5) 2.36 (0.77, 7.21) 6.5 (9) 1.50 (0.70, 3.23) Very poor 15.5 (3) 15.57(4.13, 58.68) 14.8 (2) 3.32 (0.78, 14.05) RII 4.69 (1.85, 11.89) 1.46 (0.73, 2.93)
MEN & WOMEN RII
(adjusted for sex)
3.80 (2.28, 6.35) 1.56 (1.04, 2.34)
†
Mortality rates per 1000 person years ‡
TABLE 5. Explaining the association between self rated health and mortality in men and women over the short term (Year 0-10).
MEN WOMEN
Explanatory variables RII (95%CI) %†
reductio n RII (95%CI) %† reductio n N=6316 Deaths = 146 (2.3%) N=3035 Deaths = 66 (2.2%) Age 3.46 (1.87, 6.40) 4.69 (1.85, 11.89)
Age + height + parental longevity 3.39 (1.83, 6.27) 3% 5.24 (2.05, 13.39) -15%
Age + socio-demographics 2.82 (1.52, 5.24) 26% 4.35 (1.71, 11.06) 9%
Age + health behaviors 2.72 (1.45, 5.09) 31% 3.84 (1.50, 9.84) 23%
Age + health 1.84 (0.92, 3.65) 66% 3.89 (1.35, 11.22) 22%
Age + all explanatory variables 1.49 (0.74, 3.00) 80% 3.63 (1.25, 10.53) 29% †
References
1
Mossey JM, Shapiro E. Self-rated health: a predictor of mortality among the elderly. Am J Publ Hlth 1982;72:800-8.
2
Idler EL, Angel RJ. Self-rated health and mortality in the NHANES-I epidemiologic follow-up study. Am J Publ Hlth 1990;80:446-52.
3
Idler EI, Kasl S. Health perceptions and survival: Do global evaluations of health status really predict mortality. J Gerontol 1991;46:55-65.
4
Idler EL, Benyamini Y. Self-rated health and mortality: a review of twenty-seven community studies. J Health Soc Behav 1997;38:21-37.
5
Benyami Y, Idler EL. Community studies reporting association between self-rated health and mortality. Res Aging 1999;21:392-401.
6
Franks P, Gold MR, Fiscella K. Sociodemographics, self-rated health, and mortality in the US. Soc Sci Med 2003;56:2505-14.
7
Appels A, Bosma H, Grabauskas V, Gostautas A, Sturmans F. Self-rated health and mortality in a Lithuanian and a Dutch population. Soc Sci Med 1996;42:681-9. 8
Burstrom B, Fredlund P. Self rated health: Is it as good a predictor of subsequent mortality among adults in lower as well as in higher social classes? J Epidemiol Community Health 2001;55:836-40.
9
Helweg-Larsen M, Kjoller M, Thoning H. Do age and social relations moderate the relationship between self-rated health and mortality among adult Danes? Soc Sci Med 2003;57:1237-47.
10
Heidrich J, Liese AD, Lowel H, Keil U. Self-rated health and its relation to all-cause and cardiovascular mortality in southern Germany. Results from the MONICA Augsburg cohort study 1984-1995. Ann Epidemiol 2002;12: 338-45.
11
Larsson D, Hemmingsson T, Allebeck P, Lundberg I. Self-rated health and mortality among young men: what is the relation and how may it be explained? Scand J Public Health 2002;30:259-66.
12
Miilunpalo S, Vuori I, Oja P, Pasanen M, Urponen H. Self-rated health status as a health measure: The predictive value of self-reported health status on the use of physician services and on mortality in the working-age population. J Clin Epidemiol 1997;50:517-28.
13
Wannamethee G, Shaper AG. Self-assessment of health status and mortality in middle-aged British men. Int J Epidemiol 1991;20:239-45.
14
Benyamini Y, Blumstein T, Lusky A, Modan B. Gender differences in the self-rated health-mortality association: is it poor self-rated health that predicts health-mortality or excellent self-rated health that predicts survival? Gerontologist 2003;43:396-405.
15
Deeg DJ, Kriegsman DM. Concepts of self-rated health: specifying the gender difference in mortality risk. Gerontologist 2003;43:376-86.
16
Grant MD, Piotrowski ZH, Chappell R. Self-reported health and survival in the longitudinal study of aging, 1984-1986. J Clin Epidemiol 1995;48:375-87.
17
Jylhä M, Guralnik JM, Ferrucci L, Jokela J, Heikkinen E. Is self-rated health comparable across cultures and genders? J Gerontol B Psychol Sci Soc Sci 1998;53:S144-52.
18
Helmer C, Barberger-Gateau P, Letenneur L, Dartigues JF. Subjective health and mortality in French elderly women and men. J Gerontol B Psychol Sci Soc Sci 1999;54:S84-92.
19
Spiers N, Jagger C, Clarke M, Arthur A. Are gender differences in the relationship between self-rated health and mortality enduring? Results from three birth cohorts in Melton
Mowbray, United Kingdom. Gerontologist 2003;43:406-11. 20
Hays JC, Schoenfeld D, Blazer DG, Gold DT. Global self-ratings of health and mortality: hazard in the North Carolina Piedmont. J Clin Epidemiol 1996;49:969-79.
21
Idler EL, Russell LB, Davis D. Survival, functional limitations, and self-rated health in the NHANES I Epidemiologic Follow-up Study, 1992. First National Health and Nutrition Examination Survey. Am J Epidemiol 2000;152:874-83.
22
Kaplan GA, Camacho T. Perceived health and mortality: a nine-year follow-up of the human population laboratory cohort. Am J Epidemiol 1983;117: 292-304.
23
Kawachi I, Kennedy BP, Glass R. Social capital and self-rated health: a contextual analysis. Am J Public Health 1999;89:1187-93.
24
McDonough P, Walters V. Gender and health: reassessing patterns and explanations. Soc Sci Med 2001;52:547-59.
25
Macintyre S, Hunt K, Sweeting H. Gender differences in health: are things really as simple as they seem? Soc Sci Med 1996;42:617-24.
26
Macintyre S, Ford G, Hunt K. Do women ‘over-report’ morbidity? Men’s and women’s responses to structured prompting on a standard question on long standing illness. Soc Sci Med 1999;48:89-98.
27
Case A, Paxson C. Sex differences in morbidity and mortality. Demography 2005;42:189-214.
28
G Kaplan, V Barell and A Lusky. Subjective State of health and survival in elderly adults. J Gerontol 1988; 43:S114–20.
29
Marmot MG, Davey Smith G, Stansfeld S, Patel C, North F, Head J, White I, Brunner E, Feeney A. Health inequalities among British civil servants: the Whitehall II study. Lancet 1991;337:1387-93.
30
Rose GA, Blackburn H, Gillum RF, Prineas RJ. Cardiovascular survey methods. 2nd ed. Geneva: WHO; 1982.
31
Goldberg DP. The detection of psychiatric illness by questionnaire. Institute of Psychiatry Maudsley mongraphs No. 21. London: Oxford University Press, 1972.
32
Collett D. Modelling survival data in medical research. 2nd ed. Boca Raton, Fla: Chapman & Hall/CRC; 2003.
33
Mackenbach JP, Kunst AE. Measuring the magnitude of socio-economic inequalities in health: an overview of available measures illustrated with two examples from Europe. Soc Sci Med 1997;44:757-71.
34
McCullough ME, Laurenceau JP. Gender and the natural history of self-rated health: a 59-year longitudinal study. Health Psychol 2004;23:651-5.
35
Verbrugge LM. The twain meet: empirical explanations of sex differences in health and mortality. J Health Soc Behav 1989;30:282-304.
36
Borg V, Kristensen TS. Social class and self-rated health: can the gradient be explained by differences in life style or work environment? Soc Sci Med 2000;51:1019-30.