HAL Id: tel-01618646
https://tel.archives-ouvertes.fr/tel-01618646
Submitted on 18 Oct 2017HAL is a multi-disciplinary open access archive for the deposit and dissemination of sci-entific research documents, whether they are pub-lished or not. The documents may come from teaching and research institutions in France or
L’archive ouverte pluridisciplinaire HAL, est destinée au dépôt et à la diffusion de documents scientifiques de niveau recherche, publiés ou non, émanant des établissements d’enseignement et de recherche français ou étrangers, des laboratoires
Dendrimers as a powerful tool in theranostic
applications
Flonja Liko
To cite this version:
Flonja Liko. Dendrimers as a powerful tool in theranostic applications. Human health and pathology. Université d’Angers, 2016. English. �NNT : 2016ANGE0039�. �tel-01618646�
Mémoire présenté en vue de l’obtention du : Grade de Docteur de l'Université d'Angers sous le sceau de l’Université Bretagne Loire École doctorale : Biologie Santé
Discipline : Sciences de la vie et de la santé
Spécialité : Pharmacologie expérimentale et clinique
Unité de recherche : UMR_S 1066 INSERM MINT, l'Université d'Angers
Grade de Docteur de l'Université Santiago de Compostela sous le sceau de l’Université Santiago de Compostela
École doctorale : Erasmus MundusDoctoral Program on Nanomedicine and Pharmaceutical Innovation
Discipline : Nanomedicine
Unité de recherche : Center for Research in Biological Chemistry and Molecular Materials (CIQUS) at the USC
Soutenue le 16.12.2016 Thèse N° : 107857
Flonja LIKO
Dendrimers as a powerful
tool in theranostic
applications
JURYRapporteurs : Claire BILLOTEY, Professeur des universités, Université Jean Monnet, Saint-Étienne. Diego PENA, Professeur étranger, Université Santiago de Compostela.
Examinateurs : Emmanuel GARCION, Directeur de recherche, MINT, UMR-S 1066 Inserm.
Nicolas NOIRET, Professeur des universités, École nationale supérieure de chimie de Rennes. Directeur de Thèse : François HINDRE, Maitre de conférences, Université d'Angers.
L’Université Bretagne Loire
L’Université Santiago de Compostela
Dendrimers as a powerful tool in theranostic applications
Résumé
Une nouvelle stratégie oncologique, basée sur l’intégration de la radiothérapie nanovectorisée et l’administration loco-régionale, a été évaluéee pour le traitement et l’imagerie du glioblastome, le type le plus commun des tumeurs cérébrales primaires. Les dendrimères Gallic Acid-Triethylène Glycol (GATG) sont des nanovecteurs de choix pour délivrer simultanément l’agent thérapeutique (le radioisotope 188Re par son
rayonnement béta a été retenu) et l’agent diagnostique (le gadolinium est un agent paramagnétique utilisé en Imagerie par Résonance Magnétique (IRM)). Leur évaluation a été réalisée par administration loco-régionale par stéréotaxie sur un modèle de rat F 98. Les données pharmaco-cinétiques ont été également obtenues après injection intraveineuse permettant d’apprécier les propriétés des différents dendrimères synthétisés. Leur apport en terme de confinement au site d’injection représente un avantage majeur de ce nouveau type de radiopharmaceutiques.
Mots clés
GATG, dendrimères, radiothérapie interne, MRI, glioblastoma, 188Re, Gd3+, 99mTc.
Flonja LIKO
Abstract
A new oncologic strategy, based on the integration of nanovectorized radiotherapy and locoregional delivery, was evaluated for the treatment and imaging of glioblastomas, the most common and lethal type of primary brain tumors. Gallic acid-triethylene glycol (GATG) dendrimers were the nanovectors of choice to deliver the radiotherapeutic
188Re and paramagnetic nuclei Gd3+, with a minimally
invasive stereotactic injection, directly depositing the radiotherapeutic dose to the tumor site in a F98 rat glioma model. Intravenous injection was used to further investigate the pharmacokinetics, throughout body distribution and clearance profiles of these dendrimers. Molecular weight and architecture had an important role on the in vivo behavior of the dendrimers. Their use as nanovectors prevented the fast brain clearance of the radionuclide alone, and prolonged the confinement of the internal radiation at the tumor site.
Key words
GATG, dendrimer, internal radiotherapy, MRI, glioblastoma, 188Re, Gd3+, 99mTc.
Liko Flonja
Sous la direction de
Dr. Hindré François
Dr. Fernandez-Megia Eduardo
Membres du jury Billotey Claire, PU-PH | Rapporteur Peña Diego, PU | Rapporteur Garcion Emmanuel, DR | Examinateur Noiret Nicolas, PU | Examinateur Hindré François, MCU | Directeur de thèse Fernandez-Megia Eduardo, MCU| Directeur de thèse
Dendrimers as a powerful
tool in theranostic
L’auteur du présent document vous autorise à le partager, reproduire, distribuer et communiquer selon les conditions suivantes :
Vous devez le citer en l’attribuant de la manière indiquée par l’auteur (mais pas d’une manière qui suggérerait qu’il approuve votre utilisation de l’œuvre).
Vous n’avez pas le droit d’utiliser ce document à des fins commerciales. Vous n’avez pas le droit de le modifier, de le transformer ou de l’adapter. Consulter la licence creative commons complète en français :
http://creativecommons.org/licences/by-nc-nd/2.0/fr/
L’auteur du présent document vous
Vous devez le citer en l’attribuant de la manière indiquée par l’auteur (mais pas d’une manière qui suggérerait qu’il approuve votre utilisation de l’œuvre).
Vous n’avez pas le droit d’utiliser ce document à des fins commerciales. Vous n’avez pas le droit de le modifier, de le transformer ou de l’adapter.
In loving memory of my father
and to my wonderful mother.
Ackn
ow
led
gements
Firstly, I would like to express my sincere gratitude to my directors, François Hindre (Associate Professor, University of Angers, France) and Eduardo Fernandez-Megia (Associate Professor, University of Santiago de Compostela, Spain) for the continuous support of my PhD study and related research, their motivation and immense knowledge. Their guidance helped me in all the time of research and writing of this thesis.
Besides my advisors I would like to thank Prof. Frank Boury, as the coordinator of the European Doctorate in Nanomedicine and Pharmaceutical Innovation (NanoFar) that made possible the realization of this PhD research.
I would like to thank the rest of my thesis committee: Claire Billotey (Professor at the University of Jean Monnet, Saint-Étienne, France) and Diego Peña (Associate Professor at the University of Santiago de Compostela, Spain) for giving me the honor of being reviewers for this PhD; my sincere gratitude to Nicolas Noiret (Professor at ENSCR, Rennes, France) and Emmanuel Garcion (Director of Research at Inserm U646, Angers, France) for the time dedicated to evaluate and examine this work.
My heartfelt thanks also goes to Juan Francisco Correa Chinea, not only for the great and unlimited help during my work at the Center for Research in Biological Chemistry and Molecular Materials in Spain, but also for his friendship.
Thank you to Florence Franconi for her extremely valuable MRI technical support and to Benedicte Lelievre for the ICP-MS measurements and very professional attitude. I am grateful to Jérôme Roux and Pierre Legras from the Service Commun d’Animalerie Hospitalo-Universitaire (SCAHU, Angers, France) for the sympathy and help for during the animal experimentation. I would also like to thank Clement Tetaud with Natacha Galopin for their very important technical support, during the in vivo work.
Many thanks to Marion Toucheteau (responsible for Erasmus Mundus and communication at the University of Angers), Edith Greleau (UMR 1066 Micro et Nanomédecines Biomimétiques (MINT), University of Angers), and Purificación Domínguez (CIMUS, University of Santiago de Compostela) for their valuable help with the administrative procedures, during this joint PhD program, both in France and Spain.
I would like to thank all of my colleagues, who in one way or another, helped me during this PhD. One page of acknowledgements is not enough to thank all of them. Thank you
Table of Contents
List of Figures ... 4
List of Tables ... 9
List of Abbreviations ... 10
PART 1. Glioblastoma management ... 20
1.1. Diagnosis modalities of glioblastoma (PET, SPECT, CT, MRI) ... 24
MRI, in diagnostic imaging of glioblastoma ... 28
T1/ T2 relaxation times and T1/ T2 mapping ... 30
Spin/gradient echo (T1/T2 weighting) and inversion recovery sequences ... 33
Tissue characterization with and without injection of Gd CA ... 35
Relaxivity of Gd CA ... 38
Dendrimer-based Gd CA and their effect on proton/water exchange ... 39
1.2. Glioblastoma treatment ... 44
Radionuclides for the therapy of malignant gliomas ... 48
Vectors for internal radiotherapy of glioblastoma ... 50
Dendrimers as the vectors of choice ... 53
The role of dendrimers in biomedical applications ... 58
1.3. Review Article: Dendrimers as innovative radiopharmaceuticals in cancer radionanotherapy. ... 63
Conclusions ... 78
PART 2. Strategies and Objectives ... 82
2.1. Modern strategies for the accelerated synthesis of dendrimers ... 86
Results and Discussion ... 91
Experimental Information ... 109
Materials and Instrumentation ... 109
Synthesis and characterization of new compounds ... 112
Conclusions ... 121
2.2. GATG dendrimers for integrated radiotherapy and MRI of glioblastoma ... 124
Preamble ... 124
2.2.1. Materials and methods ... 128
Characterization of starting dendrimers ... 130
Synthesis and characterization of new compounds ... 131
NMR spectra ... 134
IR spectra ... 137
Technetium radiolabeling ... 138
In vivo study of 99mTc-2[Gn]-DTPA dendrimers following iv injection ... 139
Gadolinium labeling ... 141
Molar relaxivity measurements of Gd-2[Gn]-DTPA dendrimers ... 141
Ethic statement ... 143
Preparation of the glioma animal model ... 143
CED procedure of Gd-2[G3]-DTPA dendrimers ... 145
MRI with Gd-2[G3]-DTPA dendrimers in F98 glioma rats, following CED ... 145
Dual labeling with radioactive 188-rhenium and gadolinium. ... 147
Experimental conditions for the tissue distribution study following the CED of dual labeled dendrimers. ... 147
2.2.2. Results and Discussion ... 152
2.3. Complementary results ... 167
Synthesis and characterization of 2[Gn]-DOTA dendrimers ... 169
2.3.2. Results and discussion ... 180
Comparison of relaxivity properties between Gd-2[Gn]-DTPA and Gd-2[Gn]-DOTA dendrimers ... 180
2.4. Conclusions ... 183
PART 3. General Conclusions ... 187
Bibliography ... 195
List of Figures
Figure 1.1 Brain, nervous system tumors: ASR (World) per 100 000 (all ages). ... 21
Figure 1.2 A simplified algorithm for classification of the diffuse gliomas based on histological and genetic features. ... 22
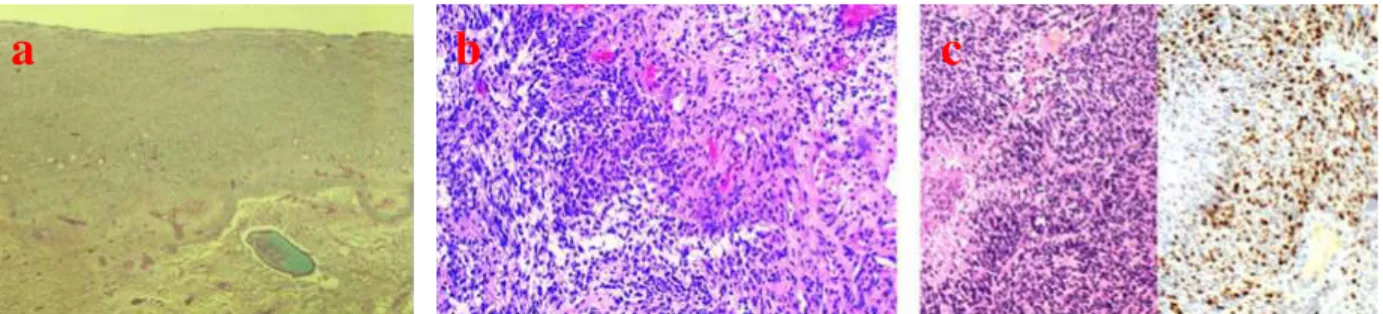
Figure 1.3 Histologic characteristics of glioblastoma tumors. (a) Three zones can be recognized: central necrosis, proliferation, and infiltration zone. H&E, 25x; (b) Area of disrupture with high cell density, vessels of different size and edema dissociation of the tissue; (c) Circumscribed necrosis with pseudo-palisading in an area with high cell density (H&E, 100x) and area with a high Ki-67/MIB.1 proliferation index (DAB, 100x). ... 23
Figure 1.4 MRI scans of a patient with a right temporal glioblastoma illustrating the spread of the disease. (A) Pre-surgical scan, GBM (arrow) is surrounded with edema. (B) Scan after surgery and radiation therapy showing “gross total resection” and clear resection cavity, and (C) six months later, showing recurrence not only at the resection margin (arrow) but a second focus of GBM across the Sylvian fissure in the frontal lobe (arrow). (D) Postresection scans of both recurrent tumors. (E) Scan 3 months later, showing the tumor recurring at the resection margin and crossing the corpus callosum to the other hemisphere (arrow) ... 29
Figure 1.5 Behavior of T1 and T2 as a function of correlation time. ... 31
Figure 1.6 (a) Return to equilibrium of the magnetization, (b) return to equilibrium on the z axis: ... 32
(Mz = M × [ - e -tT ]), (c) return to equilibrium in the xy plane (My = M × e -tT ). ... 32
Figure 1.7 Gd contrast agent was selectively taken up in the tumor region due to pathological changes in the BBB, whereas an intact BBB prevented contrast agent accumulation in unaffected brain tissue. ... 37
Figure 1.8 Activation of a Microglia cell during a pathological state in the brain. ... 53
Figure 1.9 Schematic of three main architectural components of dendrimers.. ... 54
Figure 1.10 Schematic depicting the building blocks of the dendrimer and generation growth. ... 55
Figure 1.12 Schematic of the iterative sequence of reactions, needed for the generation growth of the
dendrimers. ... 56
Figure 1.13 Applications of dendrimers with high potential. ... 59
Figure 2.1 Convergent approach toward triazole dendrimers. a) CuSO4 (5 mol%), sodium ascorbate (10 mol%), H2O/tBuOH (1:1); b) 1.5 eq. NaN3, CH3COCH3/H2O (4:1), 60 0C, 1–3 h. ... 87
Figure 2.2 Synthetic scheme for carbamate dendrimers ... 90
Figure 2.3. Synthetic scheme for RU-1 ... 91
Figure 2.4 Fragment of the core: 2 ... 92
Figure 2.5 The synthetic scheme of the G1cb-1 ... 94
Figure 2.6 The synthetic scheme of the G1cb-2 ... 97
Figure 2.7 Elongation of the carbamate repeating unit from RU-1 to RU-2 ... 98
Figure 2.8 Scheme depicting the steps for the synthesis of RU-2; 1. first step for the synthesis of product A; 2. second step for the synthesis of product B; 3. third step for the combination of A and B to give RU-2-OH; 4. fourth step resulting in RU-2. ... 99
Figure 2.9 Disappearance of the azide band during the coupling reaction ... 101
Figure 2.10 The synthetic scheme of the G1cb-4 ... 102
Figure 2.11. Scheme for the azide substitution reaction ... 103
Time (min) ... 103
Figure 2.12 Structure of G2cb-4 ... 104
Figure 2.13 The synthetic scheme of 1 ... 105
Figure 2.14 The chemical structure of G1cb-5 ... 106
Figure 2.16 Structure of G2cb-5 ... 108
Figure 2.17 Structure of G1cb-6 ... 108
S1. 1H and 13C NMR spectra of RU-1 ... 112
S2.1H and 13C NMR spectra of RU-2 ... 114
S3. 1H and 13C NMR spectra of G1cb-4 ... 115
S4. 13C-13C HMQC of G1cb-4 ... 116
S5. 1H-1H COSY of G1cb-4 ... 116
S6. 1H NMR spectrum of the chlorinated core 1 ... 117
S7. 1H NMR spectrum of the core 1 ... 118
S8. 1H and 13C NMR spectra of G1cb-5 ... 119
S9. 13C-13C HMQC and 1H-1H COSY of G1cb-5 ... 120
S10. 1H NMR spectrum of 2[G2]-N3 ... 130
S11. 1H NMR spectrum of 2[G3]-N3 ... 131
S12. 1H NMR spectrum of 2[G4]-N3 ... 131
S13. 1H NMR spectrum of 2[G2]-DTPA (Dfilter 50 ms) ... 134
S14. 13C NMR spectrum of 2[G2]-DTPA ... 134
S15. 1H NMR spectrum of 2[G3]-DTPA (Dfilter 200 ms) ... 135
S16. 13C NMR spectrum of 2[G3]-DTPA ... 135
S17. 1H NMR spectrum of 2[G4]-DTPA ... 136
S19. IR spectrum of 2[G2]-DTPA ... 137
S20. IR spectrum of 2[G3]-DTPA ... 137
S21. IR spectrum of 2[G4]-DTPA ... 138
S22. Elution profile detected by the gamma counter following the radiolabeling reaction of 2[Gn]-DTPA dendrimers with pertechnetate in rt. ... 139
S23. Rat in a metabolic cage ... 140
S24. CED procedure ... 145
S25. F98 glioma rat ready to be put in the MRI system. ... 146
Figure 2.18. Functionalization of GATG dendrimers with DTPA ligands. (a) Chemical structure of 2[Gn]-N3 dendrimers. (b) One-pot DTPA functionalization reaction. (c, d) 1H NMR and IR confirming complete reduction of azide groups. (e, f) GPC and DLS of 2[Gn]-DTPA dendrimers with concentration of 1 mg/mL in 10 mM PB pH 7.4/ 150 mM LiCl. ... 153
Figure 2.19 Degree of Conjugation of DTPA ligands to 2[Gn] dendrimers. ... 155
Figure 2.20 (a) Biodistribution analyses (n=3/group). (b) In vivo blood clearance in adult female Wistar rats, injected via the tail vein with 3.7 Mbq of 99mTc-2[Gn]-DTPA in 0,2 mL saline. ... 158
Figure 2.21. Evaluation of 2[Gn]-DTPA dendrimers by MRI following Gd labeling. (a) Schematic including CED of Gd-2[G3]-DTPA dendrimers in F98 glioma tumor bearing rats. An extensive invasion of normal brain with islands of F98 tumor cells at varying distances from the tumor mass is observed. (b) R1 and R2 plots for Gd-2[G2]-DTPA (pink), Gd-2[G3]-DTPA (orange), Gd-2[G4]-DTPA (black), and Gd-DTPA (blue); (c) T1W and T1maps of the F98 glioma rats 0.5h post-CED (7T MRI). Orange circles indicate the presence of 2[Gn]-DTPA-Gd. ... 162
Figure 2.22. Brain retention and clearance of 2[Gn]-DTPA dendrimers following dual labeling with Gd and 188Re. Tissue distribution comparison between 188Re-perrhenate (3.7 MBq) and of [188Re, Gd]-2[G3]-DTPA dendrimers (3.7 MBq) (a) 24 hours (b) and 96 hours following their CED in F98-glioma rats (n=3). ... 164
S27. 13C NMR spectrum of 2[G2]-DOTA. ... 171 S28. IR spectrum of 2[G2]-DOTA. ... 172 S29. 1H NMR spectrum of 2[G3]-DOTA. ... 172 S30. 13C NMR spectrum of 2[G3]-DOTA. ... 173 S31. IR spectrum of 2[G3]-DOTA. ... 173 S32. 1H NMR spectrum of 2[G4]-DOTA. ... 174 S33. 13C NMR spectrum of 2[G4]-DOTA. ... 174 S34. IR spectrum of 2[G4]-DOTA. ... 175
S35. Purity check of [Gn]-DOTA dendrimers by SEC. ... 175
S36. DLS measurements of 2[Gn]-DOTA dendrimers (2[G2]-DOTA-2[G4]-DOTA from left to right) ... 175
Figure 2.23. Chemical structure of 2[G2]-DOTA/DTPA ... 176
Figure 2.24. NMR interpretation of 2[G2]-DTPA structures ... 177
Figure 2.25 NMR interpretation of 2[G2]-DOTA structures. ... 178
Figure 2.26. a) R1 plots for 2[G2]-DOTA (violet), 2[G3]-DOTA (red), 2[G4]-DOTA (green), Gd-2[G2]-DTPA (pink), Gd-2[G3]-DTPA (orange), Gd-2[G4]-DTPA (black), and Gd-DTPA (blue); b) R2 plots for 2[G2]-DOTA (violet), 2[G3]-DOTA (red), 2[G4]-DOTA (green), 2[G2]-DTPA (pink), Gd-2[G3]-DTPA (orange), Gd-2[G4]-DTPA (black), and Gd-DTPA (blue). ... 182
List of Tables
Table 1.1. Features of modalities used for glioma imaging. ... 27
Table 1.2 General characteristic of therapeutic radionuclides used for malignant gliomas treatment. ... 49
Table 2.1 Stability tests of the RU-1 in various microwave assisted AAC conditions ... 91
Table 2.2 Results of the tests following the reactions of the RU-1 with core fragment 2, in various microwave assisted AAC conditions ... 93
Table 2.3 Results of various microwave assisted AAC conditions tested for the synthesis of G1cb-1 ... 95
Table 2.4 Results of various microwave assisted AAC conditions tested for the synthesis of G1cb-2 ... 96
Table 2.5 Stability tests of the RU-2 in various microwave assisted AAC conditions ... 100
Table 2.6 Microwave assisted AAC conditions tested for the synthesis of G1cb-4 ... 101
Table 2.7 Microwave assisted AAC conditions tested for the azide substitution reaction ... 103
Table 2.8 Microwave assisted AAC condition tested for the synthesis of G2cb-4 ... 104
Table 2.9 Microwave assisted reaction conditions tested for the azide substitution reaction ... 105
Table 2.10 Microwave assisted AAC conditions tested for the synthesis of G1cb-5 (AAC 16), the azide substitution reaction of G1cb-5, the synthesis of G2cb-5 (AAC 17) and the synthesis of G1cb-6 (AAC 18). 107 Table 2.11. Relaxivities of macromolecular CAs compared with Gd-DTPA in 7T. ... 160
Table 2.12 Relative NMR integration data to measure the % DC of chelates to 2[Gn]-DTPA/DOTA dendrimers ... 179
Table 2.13 Characterization of 2[Gn]-DTPA and 2[Gn]-DOTA dendrimers ... 179
List of Abbreviations
% IA: percentage of injected activity. 1/Ti,d: diamagnetic relaxation rate. 1/Ti,obs: observed solvent relaxation rate. 1/Ti,p: paramagnetic relaxation rate. 11C-MET: 11C-methionine. 123I: iodine-123. 125I: iodine-125. 131I: iodine-131. 188Re: rhenium-188 18FET: 18F-fluor-ethyl-tyrosine. 1H: proton. 201Tl: thallium-201. 90Y: yttrium-90. 99mTc: technetium-99m.
AAC: azide-alkyne cycloaddition.
Ar: argon.
ATCC: American Type Culture Collection. BBB: blood brain barrier.
BCNU: biodegradable polymer releasing carmustine. BTEAC: benzyltriethylammonium chloride.
CA: contrast agents.
CED: convection-enhanced delivery. CHCl3: chloroform.
CNS: central nervous system.
COSY: homonuclear correlation spectroscopy. CSF: cerebrospinal fluid.
CT: computed tomography.
CuAAC: copper-catalyzed azide–alkyne cycloaddition reaction. DEPT: distortionless enhancement by polarization transfer. DLS: dynamic light scattering.
DMSO: dimethyl sulfoxide. DSC: disuccinimidyl chloride.
DTPA: diethylenetriaminepentaacetic acid.
DOTA: 1,4,7,10-tetraazacyclododecane-1,4,7,10-tetraacetic acid EBRT: external beam radiotherapy.
EPR: enhanced permeability and retention. EI: experimental information.
EtOAc: ethyl acetate. FCS: fetal calf serum.
FDA: U.S. Food and Drug Administration. FDG: [18F]fluoro-2-deoxy-2-glucose. FOV: Field of View.
G: generation of dendrimer.
G1cb: first generation carbamate dendrimer. GATG: gallic acid triethylene glycol.
GBM: glioblastoma.
Gd: gadolinium.
Gd CA: gadolinium contrast agents.
GE: gradient echo.
GPC: gel permeation chromatography.
HMQC: heteronuclear multiple quantum correlation spectroscopy HN3: hydrazoic acid.
ICP-MS: inductively coupled plasma-mass spectrometry. IMT: 3-[123I]iodo-α-methyl-l-tyrosine.
IR: Inversion recovery.
iv: intravenous.
LET: linear energy transfer. LiCl: lithium chloride. LNCs: lipid nanocapsules. MeCN: acetonitrile.
MeOH: methanol.
MGMT: O6-methylguanine-DNA-methyltransferase. moAbs: monoclonal antibodies.
MPLC: medium pressure liquid chromatography. MRI: magnetic resonance imaging.
NIR: near-infrared.
NMR: nuclear magnetic resonance. PB: phosphate buffer.
Pd/C: palladium on activated charcoal. PEG: poly(ethylene glycol).
PET: positron emission tomography. Ph3P: triphenylphosphine.
Py: pyridine.
RES: reticuloendothelial system.
RF: radiofrequency.
RIT: radioimmunotherapy.
rt: room temperature.
RU: repeating unit of dendrimers.
SE: spin echo.
SLNs: sentinel lymph nodes. SOCl2: thionyl chloride.
SPECT: single photon emission computed tomography. SRS: stereotactic radiosurgery.
T1: longitudinal relaxation time.
t1/2: half-life.
T1W: T1-weighted.
T2: transverse relaxation time.
T2W: T2 weighted.
tBuOAc: tert-butyl acetate.
TE: echo time.
TI: inversion time.
TMZ: temozolomide.
TR: repetition time.
Vd: volume of distribution. Vi: volume of infusion.
αμ alpha.
μ beta.
mots-clés : GATG, DTPA, dendrimères théranostic, radiothérapie interne MRI, glioblastoma, 188Re, Gd3+, 99mTc.
keywords: GATG, DTPA, theranostic dendrimers, localized radiotherapy, MRI, F98 glioma rats, glioblastoma, 188Re, Gd3+, 99mTc.
RÉSUMÉ
Une nouvelle stratégie oncologique, basée sur l’intégration de la radiothérapie nanovectorisée et l’administration loco-régionale, a été évaluéee pour le traitement et l’imagerie du glioblastome, le type le plus commun des tumeurs cérébrales primaires. Les dendrimères Gallic Acid-Triethylène Glycol (GATG) sont des nanovecteurs de choix pour délivrer simultanément l’agent thérapeutique (le radioisotope 188Re par son rayonnement béta a été retenu) et l’agent diagnostique (le gadolinium est un agent paramagnétique utilisé en Imagerie par Résonance Magnétique (IRM)). Leur évaluation a été réalisée par administration loco-régionale par stéréotaxie sur un modèle de rat F 98. Les données pharmaco-cinétiques ont été également obtenues après injection intraveineuse permettant d’apprécier les propriétés des différents dendrimères synthétisés. Leur apport en terme de confinement au site d’injection représente un avantage majeur de ce nouveau type de radiopharmaceutiques.
ABSTRACT
A new oncologic strategy, based on the integration of nanovectorized radiotherapy and locoregional delivery, was evaluated for the treatment and imaging of glioblastomas, the most common and lethal type of primary brain tumors. Gallic acid-triethylene glycol (GATG) dendrimers were the nanovectors of choice to deliver the radiotherapeutic 188Re and paramagnetic nuclei Gd3+, with a minimally invasive stereotactic injection, directly
depositing the radiotherapeutic dose to the tumor site in a F98 rat glioma model.
Intravenous injection was used to further investigate the pharmacokinetics, throughout body distribution and clearance profiles of these dendrimers. Molecular weight and architecture had an important role on the in vivo behavior of the dendrimers. Their use as nanovectors prevented the fast brain clearance of the radionuclide alone, and prolonged the confinement of the internal radiation at the tumor site.
ENGAGEMENT
DE NON PLAGIAT
Je, soussigné(e) Flonja LIKOdéclare être pleinement conscient(e) que le plagiat de documents ou d’une partie d’un document publiée sur toutes formes de support, y compris l’internet, constitue une violation des droits d’auteur ainsi qu’une fraude caractérisée.
En conséquence, je m’engage à citer toutes les sources que j’ai utilisées pour écrire ce rapport ou mémoire. signé par l'étudiant(e) le 10 / 10 / 2016
General Introduction
The main objective of this thesis was to develop a new oncologic strategy, based on the integration of nanovectorized radiotherapy, with radiolabeled dendrimers, and intratumoral injection, via convection enhanced delivery, for the theranostics of glioblastomas. In the first part of this manuscript the general characteristics of glioblastoma will be introduced, while exposing the urgent need to find new diagnosis and treatment regimens for the improvement of this brain cancer prognosis. It will be continued with the currently used diagnosis modalities in clinical settings, focusing on the magnetic resonance imaging (MRI), which is considered at this time as the gold standard for the diagnosis and follow up of the glioblastoma. MRI parameters, important for the second part of this thesis, are going to be explained shortly, continuing with the preparation of contrast agents used for MRI, such as diethylenetriaminepentaacetic acid (DTPA) and 1,4,7,10-tetraazacyclododecane-1,4,7,10-tetraacetic acid (DOTA) derivatives for MRI enhancement.
It is known that in order to increase the relaxation rate of bulk solvent the paramagnetic ion should (1) efficiently relax the water that comes into contact with it, and (2) the relaxed water should exchange rapidly with the bulk water, to be able to transmit the relaxation effect to it. For fast tumbling complexes, such as Gd-DTPA, it is relaxation of the bound water that is the rate limiting process. On the other hand, slower tumbling will result in a more efficient relaxation mechanism of the bound water. For most biological targets of interest for imaging, multiple gadolinium ions are required to provide the necessary relaxation rate change. However, linking complexes in a linear fashion gives an oligomer, where rotation about the short axis of the molecule is fast and limits relaxivity. Since relaxivity is so dependent on molecular motion, the rotational dynamics of the final molecule are critical. The architectural characteristics of the dendrimers
General Introduction
comprised of gadolinium complexes impose a more isotropic rotational dynamic, resulting in a better translation of the effect of the high molecular weight in the increase of the relaxivity.
Following the presentation of the most important methods used nowadays in clinics for the diagnosis and follow up of glioblastoma, new modalities in locoregional therapy, for a localized irradiation to glioblastoma tumor cells will be introduced. The introduction part of this thesis will be concluded after paying special attention to the localized internal radiotherapy for glioblastoma treatment, including the used radionuclides, innovative vectors and their characteristics. The reason why dendrimers were our nanovector of choice as a multifunctional platform, to be dual labeled with Gd for MRI and 188Re for glioblastoma treatment, is discussed when assessing the role of dendrimers in biomedical applications and in our review on the use of dendrimers in cancer radionanotherapy.
General Introduction
PART 1. Glioblastoma management
Gliomas are the most common primary intracranial tumor, representing 81% of malignant brain tumors. Glioblastoma, the most occurring glioma histology (45% of all gliomas), has a 5-year relative survival of less than 5%. It develops from star-shaped glial cells (astrocytes and oligodendrocytes) that support the health of the nerve cells within the brain. These are the most invasive type of glial tumors, rapidly growing and commonly spreading into nearby brain tissue. Incidence rates for brain and other central nervous system (CNS) cancer are highest in Northern Europe and lowest in Western Africa (Figure 1.1), with the highest world age-standardized incidence rates in Albania for men and Sweden for women (2012).1
For the first time in 2016, the World Health Organization (WHO) Classification of Tumors of the CNS introduced molecular parameters in addition to histology to diagnose many tumor entities.2 This new classification from a pathogenetic point of view is based on both phenotype and genotype; from a prognostic point of view, it groups tumors with similar prognostic markers; and from the patient management point of view, it guides the use of therapies (conventional or targeted) for biologically and genetically similar entities (Figure 1.2).
Most notably, while in the past all astrocytic tumors had been grouped together, now all diffusely infiltrating gliomas (whether astrocytic or oligodendroglial) are grouped together: based not only on their growth pattern and behaviors, but also more pointedly on the shared genetic driver
General Introduction
mutations in the IDH1 and IDH2 genes. This is aimed to facilitate clinical, experimental and epidemiological studies that will lead to improvements in the lives of patients with brain tumors.
Figure 1.1 Brain, nervous system tumorsμ ASR (World) per 100 000 (all ages). Reprinted with permission from reference 1. Copyrightμ International Agency for Research on Cancer (IARC), β016.
General Introduction
In this new classification, glioblastomas are divided into (1) glioblastoma, IDH-wildtype (about 90% of cases), which corresponds most frequently with the clinically defined primary or de
novo glioblastoma and predominates in patients over 55 years of age3; (2) glioblastoma, IDH-mutant (about 10% of cases), which corresponds closely to so-called secondary glioblastoma with a history of prior lower grade diffuse glioma and preferentially arises in younger patients3 and (3) glioblastoma, a diagnosis that is reserved for those tumors for which full IDH evaluation cannot be performed.
Figure 1.2 A simplified algorithm for classification of the diffuse gliomas based on histological and genetic features. Reprinted with permission from reference β.
General Introduction
The tumor corresponds to WHO Grade IV, and it is composed of three zones: central necrosis, proliferation and infiltration zones (Figure 1.3a). Proliferation region is characterized by hypercellularity, nuclear polymorphism, brisk mitotic activity, prominent microvascular proliferation, and/or necrosis (Figure 1.3b and c).4-5Circumscribed necrosis and angiogenesis are
the absolute features of glioblastoma and their occurrence is needed for its recognition, because they are direct signs of malignancy. Infiltration zone represents the invasion into the brain of tumor cells that acquire a particular phenotypic and molecular signature. It is not uniform along the tumor borders and often it is so mild that it is hardly detectable, also histologically.6
Figure 1.3 Histologic characteristics of glioblastoma tumors. (a) Three zones can be recognizedμ central necrosis, proliferation, and infiltration zone. H&E, β5xν (b) Area of disrupture with high cell density, vessels of different size
and edema dissociation of the tissueν (c) Circumscribed necrosis with pseudo-palisading in an area with high cell density (H&E, 100x) and area with a high Ki-67/MIB.1 proliferation index (DAB, 100x). Reprinted with permission
from reference 6.
The most conclusive prognostic factors for glioblastoma are extent of tumor resection, age at diagnosis, and Karnofsky performance status, which allows patients to be classified as to their functional impairment.7Age is significantly associated with survival after diagnosis for all glioma, but the effect is most pronounced for glioblastoma.8 In general, gliomas with an oligodendroglial component have increased survival, as opposed to those with an astrocytic component.7-9 The
complex character of this tumor is one of the main reasons of the resistance of glioblastoma to
General Introduction
therapeutic intervention. Glioblastoma treatment challenges can be summarized as due to the following characteristics:
Localization of tumors in the brain;
Inherent resistance to conventional therapy; Limited capacity of the brain to repair itself;
Migration of malignant cells into adjacent brain tissue;
The variably disrupted tumor blood supply which inhibits effective drug delivery;
Tumor capillary leakage, resulting in an accumulation of fluid around the tumor; (peritumoral edema) and intracranial hypertension;
A limited response to therapy;
The resultant neurotoxicity of treatments directed at gliomas.
Despite new diagnostic and treatment opportunities such as magnetic resonance imaging (MRI), microneurosurgery, neuronavigation, and the development and testing of various cytotoxic agents this cancer remains incurable.
1.1. Diagnosis modalities of glioblastoma (PET, SPECT, CT, MRI)
Neuroimaging has become invaluable in the management of glioblastoma. Routine diagnosis of glioblastoma critically relies on MRI, owing to the variety of soft tissue contrasts available and its ability to provide morphological, physiological and metabolic information about the tumor. MRI is used at all stages of glioma management, from the detection and localization of the tumor to the planning of neurosurgery and radiotherapy, followed by the assessment of treatment
General Introduction
Positron emission tomography (PET) and Single Photon Emission Tomography (SPECT) can complement MRI by providing access to molecular targets with high sensitivity. Both SPECT and PET give information based on the spatial concentration of injected radiopharmaceuticals. PET uses short-lived positron-emitting radiotracers, which can be replace an atom or a molecule of a biological subtrat, enzyme or other biological active compounds (e.g. with 11C, 18F), or linked with them via a radioligand (e.g. with 68Ga). These radiopharmaceuticals allow to evaluate with PET imaging of proliferation and metabolic activity, to assess differential diagnosis,10-11 biological tumor volume, intratumoral heterogeneity12 and to monitor therapy.12-13 SPECT uses gamma emitting radionuclides.14
PET can utilize biochemically active molecules15 radiolog of [18F]fluoro-2-deoxy-2-glucose (FDG), and amino acids as radiotracers. It is well known that the transport of amino acids and subsequent protein synthesis is upregulated in many tumor types. Thus, labelled amino acids, such as 11C-methionine (11C-MET), 18F-fluor-ethyl-tyrosine (18FET) are the most commonly applied for the imaging of gliomas. 11C-MET and 18FET are superior for the detection of gliomas even in the regions of infiltrative tumor cells, not detectable by MRI.16 They are more useful than 18F-FDG, which produces a high background signal in the brain (because of high glucose consumption) and has limited sensitivity in detecting brain tumors.17 PET also allows the monitoring of tumor hypoxia, an important feature of high grade gliomas.
Similar to PET tracers, most SPECT tracers are metabolism substrates that are labeled with radionuclides. The simple preparation make SPECT more attractive than PET, the most used radionuclides in SPECT (99mTc), which restricts the compounds, which can be labeled with these nuclides. Four nuclides are used currently in SPECT imaging: thallium-201 (201Tl),
technetium-General Introduction
99m (99mTc), iodine-123 (123I), and indium-111 (111In).15, 18 Several radioisotope-labeled compounds including 201Tl, technetium-99m-hexakis-2-methoxyisobutyl isonitrile (99mTc-MIBI), and 3-[123I]iodo-α-methyl-l-tyrosine (IMT) have been developed and utilized for glioma imaging.13, 19 The poor targeting and specificity of these chelates prohibit their widespread use. Mainly due to its limited availability and associated costs, metabolic imaging has not yet been routinely implemented into a current standard of care algorithm for glioblastoma patients.
Computed tomography (CT) often provides the anatomical context in PET and SPECT studies, but can also be used to detect tumors (after injection of contrast) and in perfusion studies. However, CT may cause small tumors to be missed and may not depict all multifocal lesions.
Given the poor prognosis of patients with glioblastoma the overall clinical utility of SPECT and PET is mostly suited to the evaluation of treatment response in experimental protocols designed to improve the patients' outcome.13 Functional images can provide additional information, useful to determine the degree of malignancy and as a guide for biopsy, by locating tumor hot spots. Ultimately, tissue samples are needed for definite histological diagnosis.
Table 1.1. provides an overview of some of the most important features of the different modalities used for the imaging of gliomas.20
General Introduction
Table 1.1. Features of modalities used for glioma imaging. Modality Key features
MRI Based on the magnetic properties of hydrogen nuclei placed in a high magnetic field (non-ionizing radiations)
Versatile modality with wide variety of soft tissue contrasts available High spatial resolution (0.2–1 mm) and fair sensitivity (10− 3–10− 5 molL) Provide anatomical, functional and metabolic information
PET Nuclear imaging technique that uses positron emitting radionuclides with fluorine-18 (110 min)
High sensitivity (10− 11–10− 12 mol/L) and limited spatial resolution (5–10 mm) Production of radiolabeled isotopes is expensive and requires the proximity of a cyclotron
Molecular imaging of targets such as receptors, enzymes or protein sites Biodistribution of tracers may depend on blood–brain barrier, trapping of enzyme substrates, cell surface internalization, protein binding and metabolism SPECT Nuclear imaging technique that uses the direct gamma radiations emitted by
radioisotopes such as technetium-99 m (6 h) or iodine-123 (13 h) Well established, widely available and cheaper than PET
Good sensitivity (10− 10–10− 11 mol/l) and limited spatial resolution (7–15 mm) Simultaneously image several radionuclides (differentiated by their energy) CT Fast, effective and high resolution technique based on X-ray attenuation in
tissues
Often used to provide the anatomical context in PET or SPECT studies
General Introduction
MRI, in diagnostic imaging of glioblastoma
MRI is used at all stages of glioblastoma management, from the detection and localization of the tumor, to the planning of neurosurgery and radiotherapy and the assessment of treatment efficacy.21 Even though MRI scans for glioblastoma diagnosis frequently visualize mass lesions that enhance with contrast in T1-weighted sequences, accompanied by perifocal edema as being depicted on T2-/fluid-attenuated inversion recovery-weighted images, the neoplastic cells extend far beyond the area of enhancement. A typical result of “gross total resection” of a temporal lobe of glioblastoma, followed 6 months later by recurrence at the surgical margin and elsewhere, is shown in Figure 1.4.22
MRI technique is based on the principles of nuclear magnetic resonance (NMR), and takes advantage of the tissue contrast generated from the NMR signals received from hydrogen nuclei of water molecules located in different physiological environments throughout an organism.21 MRI has excellent soft-tissue specificity, and can be used to identify many types of lesions in the brain and spinal cord.
General Introduction
Figure 1.4 MRI scans of a patient with a right temporal glioblastoma illustrating the spread of the disease. (A) Pre-surgical scan, GBM (arrow) is surrounded with edema. (B) Scan after surgery and radiation therapy showing “gross
total resection” and clear resection cavity, and (C) six months later, showing recurrence not only at the resection margin (arrow) but a second focus of GBM across the Sylvian fissure in the frontal lobe (arrow). (D) Postresection
scans of both recurrent tumors. (E) Scan γ months later, showing the tumor recurring at the resection margin and crossing the corpus callosum to the other hemisphere (arrow). Copyright© β000, the National Academy of Sciences.
The predominant factors that influence the amount of signal and contrast are the longitudinal relaxation time (T1), transverse relaxation time (T2) and spin density (ρ) of the different area.. The patients are often injected with a contrast agent such as gadolinium (Gd) chelates, which alter the
T1 and/or T2 of the water protons in the vicinity of the agent and, thus, help to improve image
contrast (bright/dark) for diagnosis.21
MRI is a non-invasive diagnostic technique based on computer-assisted imaging of the relaxation signals of nuclei spins following their excitation by radiofrequency (RF) waves in a strong magnetic field.23 The proton (1H) has been the most studied nuclei due to its high gyromagnetic ratio and abundance in biological tissue, particularly in the human body.Placed inside a magnetic field, all nuclei spins are aligned, more in the same direction of the magnetic field, with a precession movement depending on the gyromagnetic moment of the spin. This
General Introduction
precessional frequency, known as the Larmor frequency, depending to the magnetic field level (B0) and the gyromagnetic ratio of the proton spin, is calculated from the equationμ 0=− ( /βπ)B0, whereμ 0is the Larmor frequency in MHz , is the gyromagnetic ratio in MHz/Tesla and B0 is the strength of the static magnetic field in Tesla.24 The majority of contrast agents available at present belong to the class of T1 materials, and are essentially based on metal ions such as Gd3+ and Mn2+
or Mn3+ bound to chelating ligands with a labile site for coordination of water molecules.
T1/ T2 relaxation times and T1/ T2 mapping
Spin-lattice (longitudinal) or T1 relaxation is the process by which the longitudinal
magnetization recovers after the RF pulse, which has been traditionally associated to the enthalpic interaction of the excited nucleus with its environment (the lattice), and in particular with the magnetic active agents of this environment (1H protons, unpaired electrons e−). The longitudinal relaxation time T1 is characteristic of the return to equilibrium of the magnetization along the z
direction. It corresponds to the time required for the system to return to 63% of its equilibrium value, after it has been exposed to a 90° RF pulse. In most situations T1relaxation is optimal if the
average rate of molecular reorientation in space is at the Larmor precession frequency. In mobile liquids near room temperature the average rates of molecular rotation are several orders of magnitude higher than 0, leading to very inefficient relaxation (long T1). For larger molecules and
more viscous solutions molecular motions become slower and T1 shortens. However, at some point
General Introduction
Figure 1.5 Behavior of T1 and Tβ as a function of correlation time.β5
Spin-spin (transverse) or T2relaxation is the process by which the transverse magnetization
decays due to dephasing of proton spins. The contribution of all the spins precessing around the external magnetic field B0 produces a net magnetization M0. After a 90º RF pulse is applied, the magnetization flips at the same angle from the longitudinal axis to the xy-plane (Figure 1.6). Dephasing of the spins is an entropy phenomenon that results in a quick exponential decrease of the net magnetization in the xy plane. T2 is caused by transient magnetic fields at any frequency.
Thus T2 keeps getting shorter as molecular reorientation rates slowdown, as shown in Figure 1.5.
Different scan sequences show up differences in these relaxation times generating what are referred to as T1, T2 or proton density (the concentration of protons) weighted images.
General Introduction
Figure 1.6 (a) Return to equilibrium of the magnetization, (b) return to equilibrium on the z axisμ (� = � × [ − �−�⁄� ]), (c) return to equilibrium in the xy plane (� = � × �−�⁄ ).β5
The high-resolution rapid computation and the intensity consistency provided by modern T1
mapping renders it a new and straightforward candidate data type in MRI.26 T
1 maps are
quantitative images of T1 relaxation times. The image intensity of a parametric image is known to
be proportional to the T1relaxation times and it can give a quick view of how these values differ
across an image. Since T1 maps are parametric images of pure T1, they are expected to contain
reduced bias and other distortions, compared with conventional T1-weighted (T1W) images, and
are believed to improve the performance of segmentation.27
For commonly used T1W imaging, the accumulation of paramagnetic contrast agent is
General Introduction
sensitivities, gain calibration, sequence timing parameters and fluctuations in electrocardiogram or respiratory triggering intervals.
While T1 maps are not immune to artifacts, they are measurements of a physical property,
and so are comparable across subjects and scanners. This stability of the intensity profile reduces the complexity of registration and segmentation and may provide information about complex changes in tissue composition.28-29 New segmentation frameworks either directly take T1 maps as
input28 or combine them with T
1-weighted images in multi-channel image segmentation.29
An important question is whether the in vivo MRI contrast change can be quantitatively related to local contrast agent concentration in the tissue. In case of paramagnetic nanoparticles, robust T1 mapping techniques are needed to address this issue.30 The group of Gustav31 found that
regional elevations in longitudinal relaxation rates R1 (R1=1/T1) following injection of paramagnetic liposomes in a mouse model of myocardial infarction, correlated well with local Gd-concentrations as determined by Inductively Coupled Plasma-Mass Spectrometry (ICP-MS).
T2 parametric maps are generated on the basis of a similar principle of T1 mapping, where a
series of images are obtained to calculate a T2 decay curve. T2 mapping techniques have not yet
received the same focus as T1 mapping.32 A comparison of diagnostic efficacy between the two
techniques will be better served in future investigations.
Spin/gradient echo (T1/T2 weighting) and inversion recovery sequences
There are two principle types of pulse sequence, called spin echo (SE) and gradient echo (GE). SE sequences use two RF pulses to create the echo, which measures the signal intensity and produce T1-, T2-, or proton density (ρ) weighted images depending on the choice of TR and TE.
General Introduction
SE sequences generally produce the best quality images but they take a relatively long time, several minutes rather than seconds. GE sequences use a single RF pulse followed by a gradient pulse to create the echo, which also measures the signal intensity and produce images with T1-, T2- or ρ
weighting. Generally, these sequences have much shorter TRs than SE, resulting in shorter scan times. However, they are influenced to an extent by the inhomogeneity of the main magnetic field and timing parameters.33
T1W imaging is one of the basic pulse sequences in MRI and demonstrates differences in the
T1relaxation times of tissues. The T1of a tissue reflects the amount of time needed for its protons'
spins to realign with the main magnetic field (B0), and to get back to equilibrium. T1 weighting
tends to have short TE and TR times, to minimize T2relaxations effect. If T1W images did not have
short TR´s, then all the protons would recover their alignment with the main magnetic field and the image would be uniformly intense. Selecting a TR shorter than the tissues' recovery time allows one to differentiate them. Tissues with high fat content quickly realign their longitudinal magnetization with B0, and therefore appear to be bright on a T1 weighted image. Conversely,
compartments filled with water have much slower longitudinal magnetization realignment after an RF pulse, and therefore less transverse magnetization. Thus, water has low signal and appears as dark. This is useful to demonstrate anatomy. T1W sequences provide the best contrast for
paramagnetic contrast agents.
T2W imaging is useful to differentiate anatomical structures mainly on the basis of T2values.
The scanning parameters are set as long TR/long TE to minimize T1 relaxation effects. If the TE
is extended out over a very long time, only tissues with a very long T2relaxation time will retain
General Introduction
This is useful for demonstrating pathology since most lesions/tumors are associated with an increase in water content. Paramagnetic contrast agents (e.g. gadolinium (Gd) containing compounds) do not cause the same bright tissue contrast as they do on T1W imaging. Gd shortens
T2 relaxation time and actually results in hypointense signal.
The traditional inversion recovery (IR) pulse sequence is a variation of the spin echo sequence. It is a spin echo sequence with an additional 180° pulse, usually slice-selective, which is applied prior to the initial excitation pulse. IR pulse sequences are used to give heavy T1
-weighting. The inversion time (TI) is a user-selectable delay time between the 180° pulse and the excitation pulse and determines the amount of T1 relaxation that occurs between the two pulses.
The inversion pulse also allows for the suppression of signals through the proper choice of TI. If the TI time is chosen so that the tissue of interest has no longitudinal component at the time of the excitation pulse, then that tissue contributes no signal to the final image. The two most common applications of IR sequences are for the suppression of cerebrospinal fluid (CSF) and fat.
Tissue characterization with and without injection of Gd CA
MRI signal intensity is expressed in gray levels: a high intensity signal appears in white and a weak intensity signal in black or dark gray. An MRI is obtained by contrasts between different biological tissues. The contrast-to-noise ratio is chosen by the MRI user who can modify the sequence parameters (TR: Repetition Time, TEμ Echo Time, flip angle, FOV: Field Of View, etc.) in order to obtain the desired contrast between tissues. The choice of the MRI parameters allows the image contrast to be varied according to the values of their intrinsic physical parameters. If T1
General Introduction
are defined by the choice of TR and TE, taking into account the repetition of the basic sequence. The transverse magnetization is the maximum at a short TE. The rate at which each tissue recovers its longitudinal magnetization depends on its T1value.
The efficacy of contrast agents with regard to their application in MRI is defined by their relaxivity. This property describes the ability of a 1 mM solution of CA to enhance the relaxation rate of solvent nuclei in close vicinity of the paramagnetic entity, which increases signal intensity in a magnetic resonance image. The effect of the contrast agent on the signal intensity can either be positive (increase in signal or T1-enhancement) or negative (signal reduction or T2
-enhancement). Almost all MR contrast agents will affect both T1- and T2- relaxation times and the
distinction between them will depend on many MR-specific parameters as well as contrast agent dose. The most widely used class of MRI contrast agents is based on the mechanism of longitudinal relaxation (T1).34-36 It is usually the motion of the neighboring 1H protons which creates an
oscillating magnetic field that stimulates a return to equilibrium of the H2O protons. If molecules containing unpaired electrons (e−) are introduced into the H2O molecule environment, they will trigger the return to equilibrium of the H2O protons much more effectively, because the magnetic moment of the electron is 658 times stronger than that of the proton.
Lanthanides contain unpaired electrons, including Gd that contains seven unpaired electrons. Although Gd is very effective, it is always used as a very stable chelate, to prevent toxicity issues. Gd complexes reduce the value of neighboring water hydrogens T1 (and T2), generating a reduction
in signal intensity (line broadening) in an acquisition. Taking into consideration that the production of an image requires the accumulation of many acquisitions for a sufficient signal to noise ratio (SNR), the Gd contrast agent shorten the time of return to equilibrium of the magnetization (z
General Introduction
axis). This results in a shorter TR, offering the opportunity for more accumulations per unit time (several TRs), and therefore recording more signal per unit time for spins with reduced T1.
The presence of the contrast agent Gd in a particular location of a living tissue will result in a stronger signal (positive enhancement) in this region of the image. For example, in normal tissue, the “large” Gd chelate cannot cross the blood–brain barrier; by contrast, in certain tumors the vascularization is higher than the surrounding tissues and the blood brain barrier is locally porous, so Gd chelate can penetrate the tumor that appears hyperintense on the corresponding MRI, as shown in the Figure 1.7.
Figure 1.7 Gd contrast agent was selectively taken up in the tumor region due to pathological changes in the BBB, whereas an intact BBB prevented contrast agent accumulation in unaffected brain tissue. Adapted from ref. γ7.
Preparation of lanthanide complexes is mostly simple. The formation kinetic of the complexes differs for two main ligand families, the open-chain ligands (DTPA derivatives) and macrocycles (DOTA derivatives). The open-chain ligands form complexes at room temperature immediately once pH is in the appropriate range. Generally, a careful control of solution pH is very important and the base should be added very slowly to avoid precipitation of uncomplexed
General Introduction
ions as hydroxides during the reaction course. The most common reaction pH range is 5–7 and should be kept unchanged during the complexation reaction. The labeling reaction is commonly done in water, using lanthanide (III) salts of non-complexing anions. Ligands are mostly polyvalent acids, which must be at least partially, deprotonated to form the complexes. The metal ions and ligands can be reacted in the equimolar amounts or in an access of the metal ion or ligand. A slight ligand excess is used to ensure a complete binding of the metal ion.38 If excess of metal ion is present, it must be removed. The simplest way is raising the pH above 8 leading to precipitation of the excessive metal ion as metal hydroxide, which is removed by filtration (e.g., through syringe filters) or by centrifugation.39
Relaxivity of Gd CA
The aim of using a contrast agent in MRI is to accelerate the relaxation of water protons in the surrounding tissue. Nowadays, Gd complexes are far the most widely used MRI contrast agents in the clinical practice. The choice of Gd is explained by its seven unpaired electrons which makes it the most paramagnetic stable metal ion. Gd complexes induce an increase of both the longitudinal and transverse relaxation rates, R1=1/T1 and R2=1/T2 respectively, of the solvent
nuclei. The observed solvent relaxation rate, 1/Ti,obs, is the sum of the diamagnetic (1/Ti,d) and paramagnetic (1/Ti,p) relaxation rates. The diamagnetic term, 1/Ti,d, corresponds to the relaxation rate of the solvent (water) nuclei in the absence of a paramagnetic solute. The paramagnetic term, 1/Ti,p, gives the relaxation rate enhancement caused by the paramagnetic substance which is linearly proportional to the concentration of the paramagnetic species, [Gd]:
General Introduction
In the above equation for nondilute systems the linear relationship is valid only if the concentration is given in millimoles per kilogram solvent (mmol/ kg; millimolality). According to this equation, a plot of the observed relaxation rates versus the concentration of the paramagnetic species gives a straight line and its slope defines the relaxivity, ri (ri=1/Ti,p, in units of mM−1s−1). If we consider the relaxation of water protons, which is the basis of imaging by MRI, the corresponding term proton relaxivity can be introduced. Proton relaxivity directly refers to the efficiency of a paramagnetic substance to enhance the relaxation rate of water protons, and thus to its efficiency to act as a contrast agent. It has to be noted that the simple term “relaxivity” is often used in the context of MRI contrast agents and refers to “longitudinal proton relaxivity enhancement”.
Dendrimer-based Gd CA and their effect on proton/water exchange
For the molecular MRI, a main challenge for the T1 agents is represented by low
accumulation and sensitivity. This insufficient accumulation can be compensated by attaching multiple MRI labels to a single multivalent scaffold. One of the first reported dendrimer-contrast agent systems was based on PAMAM dendrimers functionalized with isothiolcyanobenzyl-DTPA ligands to be labeled with Gd.40 This initial study directly compared PAMAM G2 and G6 dendrimers. The G6 dendrimer had 170 Gd sites per molecule and a very high ‘per Gd’ relaxivity of 34 mM−1 s−1, which was higher than that of G2 (r1= 21.3 mM−1 s−1) at 0.6T. The authors later described that this difference was directly related to gains in rotational correlation time.41 They
General Introduction
demonstrated that the blood circulation half-lives (t1/2) depended on the molecular weight of the dendrimer used.
Another interesting feature is that differences in the dendrimer molecular shape, in aqueous solution, can affect their relaxivity properties. CA based on PPI dendrimers have higher relaxivity than the corresponding PAMAM dendrimers, and thus are more efficient.42 The PPI dendrimers are more ellipsoid shaped than PAMAM dendrimers. This shape has been claimed to lead to a higher T1relaxivity.42 The first commercial dendrimer-based CA was Gadomer-17, which was
developed by Schering AG. It is based on a polylysine core substituted with 24 Gd-DOTA groups at the surface and is presumably marketed as a contrast agent for dynamic contrast enhanced MRI applications.
The overall proton exchange rate in a neutral pH is generally equal to the exchange rate of the entire water molecules, meaning that each proton exchanges with the bulk in the form of intact H2O molecules. On increasing the acidity or basicity of the solution, the proton exchange may become considerably faster than the water exchange due to acid- or base-catalyzed pathways.43 The exchange of coordinated water protons can occur in two ways: independently of the exchange of the entire water molecule on which it resides, or via the exchange of the water molecule itself. In any case, the water exchange rate represents a lower limit for the proton exchange rate. Since the water exchange rate on DOTA- and DTPA-type complexes is lower than the optimal values to attain maximum relaxivities, there has been a continuous effort to design novel ligands that ensure stable Gd complexes with accelerated water exchange.
The negative charge of the complex and an increased steric crowding around the water binding site were identified as the two main factors, contributing to the acceleration of the water
General Introduction
exchange. While increasing the negative charge on the complex is not always a viable route to optimize water exchange, the design of ligands ensuring steric compression has proved to be a successful strategy. The steric compression has been induced in DTPA- or DOTA-derivative complexes, either by the addition of a CH2 group in the amine backbone of the ligand or in the carboxylate arm. The introduction of one six membered chelate ring in the complex, always increases the stearic crowding. The stearic crowding and the consequent acceleration of the water exchange is more important on the elongation of the amine backbone than on the elongation of the carboxylate pending arm (DTPA- DOTA-derivative complexes).
Obviously, rotation is slowed down to a smaller or higher extent when a monomer Gd chelate is attached to a macromolecule, but it is less straightforward to predict how the water exchange is affected. To confirm if the attachment of a macrocyclic unit to a large dendrimer molecule influenced the kinetics of water exchange on the Gd chelate, a pioneer study was done with three different generations of PAMAM dendrimers (G3-G5) functionalized with DO3A-monoamide Gd chelates, comparing them to the corresponding monomer chelate.44 The water exchange rates of all the three generations of dendrimers were similar to that of the monomer chelate, demonstrating for the first time that the attachment of a macrocyclic unit to a large dendrimer molecule does not significantly influence the kinetics of water exchange on the Gd chelate. Similar results were obtained later on other dendrimer systems.45
However, reliable kinetic parameters can only be obtained for the proton exchange if the exchange of the entire water molecules is considerably slower than that of protons. For the Gd chelates used as MRI contrast agents, at physiological pH the proton exchange rate equals the water exchange rate. For small-molecular-weight Gd chelates, it is the rotational correlation time
General Introduction
(τR), that mainly determines the effective correlation time of proton relaxation. In other words, the fast rotation is the limiting factor for proton relaxivity at magnetic fields relevant to MRI. This fact led to a wide variety of approaches to slow down rotation by increasing the molecular weight of the complex. The Solomon-Bloembergen-Morgan (SBM) theory of paramagnetic relaxivity predicts that the relaxivity of a Gd complex with optimally fast water exchange rate can be drastically increased upon slowing its molecular tumbling. This general trend holds true for magnetic fields up to 3T, corresponding to proton Larmor frequencies of ∼127 MHz, but starts to decline at higher magnetic fields. For instance, as the SBM theory predicts, at proton Larmor frequencies above 200 MHz, r1 increases with the inverse rotational correlation time 1/τR, in contrast to lower frequencies where it is proportional to τR.
The τR values generally increase with increasing molecular weight, however, this relation is far from the linearity. While, the proton relaxivities attained by Gd chelates attached to dendrimers increased with molecular weight, they were lower than expected solely on the basis of the molecular weight. A part of the reason is that the linking group between the Gd chelate and the rigid dendrimer molecule has some flexibility and consequently the Gd chelate experiences a more rapid motion when compared to the rotation of the dendrimer as a whole. Since the molecules are not completely rigid, the motion which then determines proton relaxivity can be considerably faster than the motion of the whole molecule, which is itself related to the molecular weight. This phenomenon is particularly important for several types of macromolecular agents, either due to the general flexibility of the whole molecule or to the flexibility of the linking group that is used to attach the Gd chelate to the macromolecule.