Publisher’s version / Version de l'éditeur:
Canadian Journal of Earth Sciences, 2, pp. 1-10, 1965-02
READ THESE TERMS AND CONDITIONS CAREFULLY BEFORE USING THIS WEBSITE.
https://nrc-publications.canada.ca/eng/copyright
Vous avez des questions? Nous pouvons vous aider. Pour communiquer directement avec un auteur, consultez la
première page de la revue dans laquelle son article a été publié afin de trouver ses coordonnées. Si vous n’arrivez pas à les repérer, communiquez avec nous à PublicationsArchive-ArchivesPublications@nrc-cnrc.gc.ca.
Questions? Contact the NRC Publications Archive team at
PublicationsArchive-ArchivesPublications@nrc-cnrc.gc.ca. If you wish to email the authors directly, please see the first page of the publication for their contact information.
NRC Publications Archive
Archives des publications du CNRC
This publication could be one of several versions: author’s original, accepted manuscript or the publisher’s version. / La version de cette publication peut être l’une des suivantes : la version prépublication de l’auteur, la version acceptée du manuscrit ou la version de l’éditeur.
For the publisher’s version, please access the DOI link below./ Pour consulter la version de l’éditeur, utilisez le lien DOI ci-dessous.
https://doi.org/10.1139/e65-001
Access and use of this website and the material on it are subject to the Terms and Conditions set forth at
Annual heat and mass transfer at an Ottawa site
Gold, L. W.; Boyd, D. W.
https://publications-cnrc.canada.ca/fra/droits
L’accès à ce site Web et l’utilisation de son contenu sont assujettis aux conditions présentées dans le site LISEZ CES CONDITIONS ATTENTIVEMENT AVANT D’UTILISER CE SITE WEB.
NRC Publications Record / Notice d'Archives des publications de CNRC:
https://nrc-publications.canada.ca/eng/view/object/?id=b3930b6b-36c5-4208-9661-69d83c3bfa6a https://publications-cnrc.canada.ca/fra/voir/objet/?id=b3930b6b-36c5-4208-9661-69d83c3bfa6a
A N A L Y Z E D
ANNUAL HEAT AND MASS TRANSFER AT AN OTTAWA SITE1
L. W. GOLD
Division of Building Research, Naliofzal Research Cozincil, Ollazoa, Carzada
AND
D. W. B O Y D ~
il~eleorological Branch, Department of Transport, Toronto, O?ztario
Received April 10, 1964
ABSTRACT
T h e Fourier component of period 1 year is calculated for the net radiation, net solar r a d i a t i o ~ ~ , incomirig solar radiation, and ground heat flux froin observations made a t a grass-covered site in Ottawa in the 2-year period 1 January 19Gl to 31 December 1962. T h e Fourier approximation of the evapotranspiration and subli~nation loss is determined from estimates of the average Inass transfer a t the time of maximum in sulnnler and minimum in winter. The approximation of the annual component of the convective transfer is obtained using the heat balance - equation.
During the 6-month period 1 April to 30 September about 48% of the net solar radiation was dissipated by evapotranspiration, 42% dissipated by long- wave radiation, 7% dissipated by convection, and 3% was stored in the ground.
I-Ieat and moisture transfers a t the ground surface undergo an annual cycle as a consequence of the annual variation in solar radiation. Observations indicated that net radiation and heat flow from the ground a t an O t t a v a site were closely approximated by a simple harmonic function ~ v i t h period of 1 year, and that the amplitude and phase of this function did not change appreciably froill year t o year. This suggested that useful approximations of the other coinponents of the heat balance could be obtained for the site with similar functions. Although it was not possible t o measure these components con- tinuously, it \I-as considered that the amplitude and phase of the simple har- monic approximation could be deduced for the moisture transfer from estimates of the average maximum and minimum values, and the times of the year a t which these extremes occur. The simple harmonic approximatioil to the convective exchange could then be obtained as the difference in the heat balance equation. I t was realized that the approximations might a t times be in considerable relative error, particularly during the period of miniinurn exchange, but it \\-as considered that they would provide a useful picture of the annual exchange, a reference framework for more accurate measureinents and probably as accurate an indication of heat and moisture loss over a long period
'Issued a s N.R.C. NO. 8198.
ZSeconded t o the Division of Building Research, iyational Research Council, Ottawa, C a ~ ~ a d a .
Canadian J o u r ~ ~ a l of Earth Sciences. Volume 2 (1965) I
2 CAXADIAN J O U l i N A L O F EARTI-I SCIENCES. VOL. 2, 1965
of time a s could be obtained with present-day instruments. I t was with this in mind, as well as the intention of obtaining additional insight into the relation- ships between cliinate and the ground thermal regime, t h a t the study recorded in this paper was undertalcen. The results presented are based on observations made over the 2-year period January 1, 1961, to December 31, 1962.
T h e observation area \\.as some 60 meters square and covered with field grass allowed to grow t o a height of between 15 and 20 crn before being cut. There \\rere a number of one- and two-storey buildings in the vicinity, the nearest about 45 nleters north and south of the measurement area. The site was open to the west, and buildings were a t least 120 meters away t o the east. There was a single rolv of trees about 30 meters t o the southwest.
Air temperature about 120 cm above the soil surface was measured in a Stevenson screen with a ventilated thermocouple immersed in oil in a glass tube about 0.73 cin in diameter and 20 cm long. Wind speed was measured 2 ineters above the soil surface n i t h a type 4.5 anemometer made b y the i\Ieteorological Service of Canada. Dew point a t the 2-meter level was ~neasured continuously on the north side of a small instrument hut with a "De\\~cel" ~nanufactured by the Foxboro Co. Ltd. Evaporation observations were made with a class A pan supplied by the ~~Ieteorological Service of Canada. T h e net radiation observations were made with a radiometer (designed by the Coinmon- wealth Scientific and Industrial Research Organization of Australia) i ~ u n k 1959) mounted about 2 ineters above the soil surface. I n November of 1961 observations were begun on net solar radiation using two Eppley pyrhelio- ineters mounted horizontally about 2 meters above the soil surface. One instrument faced up\\-ard, the other do\\-n~vard.
Ground temperatures have been observed a t the site since 1937. A descriptioil of the installation is given in a paper by Pearce and Gold (1939). The ground heat flow component was estimated froin the measured temperatures, the necessary soil thermal properties having been determined in the earlier study (1 959).
CALCULATION O F COMPONEXTS
Net Radiation
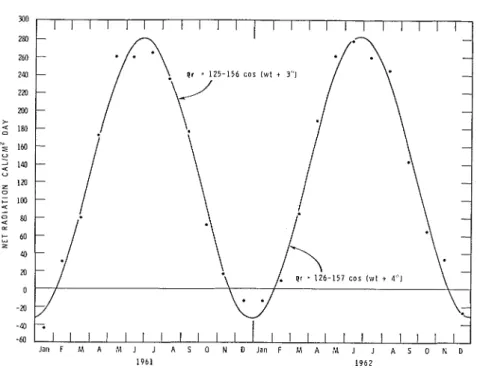
AlIonthly averages of the measured daily net radiation are presented in Fig. 1. Shown as well is the Fourier approximation given by
q, = R O + X I cos (wt
+
6)where q, is the daily net radiation, positive for heat supplied t o the surface,
w is equal to 360 deg per year,
t is the time in years measured from the beginning of January,
6 is the phase angle in degrees,
R o is the annual average of the daily net radiation,
R1 is the amplitude of the Fourier component with period 1 year. The monthly average values calculated from the Fourier approximation are within f 2 0 cal/cm2 day of the observed values. This difference is less than 10%
GOLD i\YD BOYD: I-IEAT A N D MASS TRANSFIZK 3
FIG. 1. Dependence of net radiation on time of year. T h e plotted points are monthly averages of daily net radiation.
of the observed daily average for each month in mid-summer, but alnlost 100yo of the observed average in mid-winter.
These figures indicate the significance of the winter exchange relative t o the larger summer exchange. T h e relative ~vinter error is not considered significant in this present study because it is very difficult t o measure net radiation in the field with a n accuracy better than about f 30 cal/cm2 d a y using radiolneters available a t present (Boyd 1962).
Ground Heat Flow
T h e Fourier approxinlation of the heat flow from the ground is given by (1) q, = d ( w / A ) k T ~ exp ( - zd(w/2A)) cos (wt
+
6 - zv'(w/2A)) where q, = heat flow from ground, positive for heat flow t o the surface,A = thermal diffusivity of soil, k = thermal conductivity of soil, z = depth of observation below surface,
6 = phase angle of the heat flux a t the surface,
= amplitude a t the surface of Fourier colilponent of the ground temperature with a period of 1 year.
IJsing the soil thermal properties given by Pearce and Cold (1959) (A = 10.8 cm2 h , k = 8.43 cal/cm "C h) and calculating TI from ground temperature observations, the following approxilnations were obtained for the ground heat flow a t the surface:
4 CANADIAN J O U R N A L O F EAKTI-I SCIENCES. VOL. 2, 1965
Period Fourier approximation 1 January 1960 - 31 December 1960 18.9 cos (wt
+
20") cal/cm2 day 1 January 1961 - 31 December 1961 17.5 cos (wt+
24") cal/cm2 day For the purpose of the present discussion, the Fourier approxiination for the 2-year period was talten as 18 cos (wt+
22") cal/cm2 day.ibfass Transfer
T h e heat flux associated with the average inass transfer, including evapora- tion, transpiration, and sublimation, often is estimated for periods of 1 day or longer with semiempirical forinulae of the form
where q, is the heat flux associated with the average mass transfer, positive for vapor transfer to the surface,
U,
is the average wind speed a t the measuring height a , en is the average water vapor pressure at the same height,e, is the saturatioil vapor pressure a t the average surface temperature, A and B are constants.
Earlier observations indicated that a t Ottawa the average daily snow surface temperature is usually between 0 and 1 C deg colder t h a n the average daily air temperature, and that in sunliner the average daily soil surface temperature is about 1 to 3 C deg warmer than the average daily air temperature (Gold 1963). T h e average daily air teinperature was used, therefore, in calculating the saturation vapor pressure a t the surface for periods of snow cover. The saturation vapor pressure a t the surface in suininer u7as assumed t o be t h a t for a temperature equal to the average daily temperature of the soil surface a t the base of the grass stems. Average daily values for c , were calculated from observed average hourly values. Average monthly values of e, - e, as well as Fourier approximations calculated froin 5-day averages of en - e,, are plotted in Fig. 2.
Penman (1948, 1956) gave, for a saturatecl surface, the following values for the constants in equation (2):
for U, measured in cm/h a t a height of 2 meters above the surface; en a n d e, in inb. T h e average wind speed a t the site in July (the time of inaximuin evapo- transpiration) was (53.4 X lo4 cm/h in 1961, and 59.9 X lo4 cin/h in 1962. The average daily value for e,
-
e, a t the time of maximum was about -18.6nlb in 1961, and about
-
13.3 illb in 1962. Assunling e,-
e, to be - 16 m b and the average wind speed 56 X lo4 ccm/h, equation (2) givesq, = - 13.8 cal/cm2 h = -330 cal/cm2 day.
GOLD A N D BOYD: HEAT AND MASS TRANSFER
,
,
,
I
1 7 1 ~ . 2. Time dcpcndellce of the monthly averages of the vapor pressure diffcrcnce between
the 2-meter level and the gro~und surface. The \ apor pressure a t the surface is assumed to be the saturation value a t the average surface temperature.
The measured average evaporation rate from the class A pan was observed t o be 0.49 c n ~ water per day in July 1961 and 0.55 cm in July 1962, equivalent to about 290 cal/cm2 day and 320 cal/cin2 day, respectively. Converting class A pan observations t o lake evaporation gives about 0.38 c n ~ in 1961 and 0.42 cm in 1062, ecluivalent t o about 225 and 250 cal/cm2 day, respectively. Since the average surface teinpcrature of a lake is probably cooler than the average surface teinperature of a freely evapotranspirating grass surface subject t o t h e same weather, the daily moisture loss froin such a surface should be between that for a lalie and that for the class A pan. The class A pan observations, therefore, indicate a value for evapotranspiration somewhat lower than t h a t obtained froin equation (2) using constants established by Penman. The value of e, used in equation ( 2 ) , however, was based on average temperatures mea- sured a t the base of the grass steins, and these temperatures ~vould be expected t o be higher than the average temperature of the transpirating surfaces. This ~vould result in an absolute value for e,
-
e, in equation (2) that is too large and, therefore, an estimate of the evapotranspiration loss t h a t is too high. I t \vas assunled for the purpose of the present calculations, therefore, that the average moisture loss from a freely evapotranspirating surface during July a t Ottawa was equivalent t o 280 cal/cm2 day, and recognized that this estimate inay be in error by about f 10%.If the soil moisture content is not a t field capacity, evapotranspiration will be less than that from a saturated surface. Penman found that, for the grass surfaces upon which he made his observations, evapotranspiration was between 0.60 and 0.80 of that calculated from equation (2), depending on the
6 CANADIAN JOURNAL O F EARTH SCIENCES. VOL. 2. 1966
amount of water stored in the soil (Penman 1936). T h e value of 0.60 \\-as obtained under winter conditions in southeast England.
During July a t Ottawa it is normal for evapotranspiration t o exceed rainfall by allnost 6 cm of water, but conditions vary a great deal from year t o year. In July 1961 the soil moisture content remained nearly a t field capacity for 3 weeks (according to calculations based on the Thornthwaite method (Thorn- thwaite and Mather 1957)) but was rapidly reduced during the last week t o about 4.5 cm below field capacity. In July 1962 the soil moisture content was about 8 cm below field capacity a t the beginning of the month and remained between 8 and 12 c n ~ throughout the month. These calculations are in agree- ment with observations made by the Soil NIechanics Section of the Division of Building Research, National Research Council, on the soil water pressure measured with a piezometer a t the 3-meter depth a t a site about 12 meters east of the row of trees. In July 1961 the soil water pressure a t that depth varied between 253 and 300 till of water, and in July of 1962, betn-een 193 and 241 cm of water.
T h e observations on soil inoisture and the Thornth\\7aite calculations indi- cated a good supply of soil water. I t was assumed, therefore, based on Penman's observations, that average evapotranspiration during July for the 2 J-ears was 0.80 of the assumed evaporation from a saturated surface (280 cal/cm2 da).), that is, about 225 cal/cm2 day.
T h e ground a t the observation site is fairly level, usually with no surface runoff in summer. Because the underlying soil is clay, i t was considered that there was no net loss of water fro111 the site due to ground water flow. filIeas~ired rainfall, therefore, should give the lolver limit t o the evapotranspiration loss. In July of 1961 the average rainfall was 0.38 cm/day, equivalent t o about 223 cal/cm2 day. In July 1962 the average rainfall was 0.33 cm/daj., equivalent t o about 193 cal/cm2 day. These values are in good agreenlent with the estiinate obtained from equation (2) and the class A pan observations.
For sublimation in winter, reasonable values for the constants in equation (2) are
A = 1.5 X lopG cal/cm3 mb, B = 0 (Williams 1959).
T h e average wind speed a t the site in January is about 63 X l o 4 cm/h (4 1n.p.h.). Figure 2 indicates t h a t the monthly average value for e, - e, a t the time of ininin~unl average sublimation loss in winter is about -0.67 mb. Substituting these values into equation (2) gives
On t h e basis of the preceding discussion, it was assuilled that the Fourier approximation of the heat loss by evaporation and sublimation had a maxim~uii of 225 cal/cm2 day in summer, a lniniinum of 15 cal/cmWay in winter, and an annual average value of 120 cal/cin2 day. From the observations on e, - e , , it
GOLD A N D BOYD: I-IEAT A N D 1M:ISS T R A X S F E R 7 was assumed t h a t the phase angle was -2 deg, with time measured from the beginning of January, giving maximum evapotranspiration in early July and minimum sublimation in early January. In choosing the phase angle, greater weight was given t o the observations for 1962 than to those for 1961. T h e equation obtained is given belo~v:
p, = - 120
+
105 cos (wt-
2) cal/cm2 day.Figure 2 indicates t h a t for a saturated surface the Fourier component with period of 1 year is only a fair approximation of the observations of e,
-
e,. T h e reason for this, in part, is the non-linear dependence on temperature of the saturation vapor pressure of \\later. T h e drying of the soil from evapotrans- piration \\-ill reduce the actual difference between the average vapor pressure of the air and a t the surface during the summer months. This reduction would probably cause the Fourier component of period of 1 year to be a better approximation of the evapotranspiration loss than is indicated in Fig. 2.Colzvecf i-de Loss
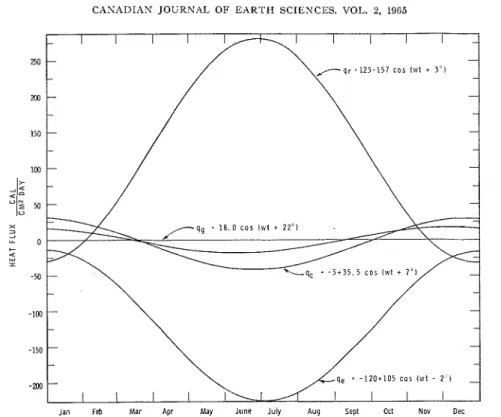
No observations \\-ere available from which estimates could be made of the average convective loss a t the time of maximum in summer and minimum in winter. T h e expression for the convective loss was obtained by putting it equal to the sum of the other three components of the heat balance. T h e phase angle obtained (7 deg) is about 8 deg greater than t h a t given by observations on the difference between the average daily air and surface temperatures. T h e approxiillations for all four components of the heat balance are given below and plotted in Fig. 3.
Fourier approxilnation of components of heat and mass transfer a t grass surface a t Ottawa
in cal/cmz day (t = 0, January 1)
q, = 125 - 157 cos (wt
+
So),y, = 18 cos (wt
+
22"),q, = -120
+
105 cos (wt - 2"),pc = -5
+
35 cos (wt+
7"). Incoming solar = 329 - 208 cos (wt+
13"). Net solar = 252 - 211 cos (wt+
4"). S e t long wave =-
127+
54 cos (zut+
So).SOLAR RADIATION A N D ALBEDO
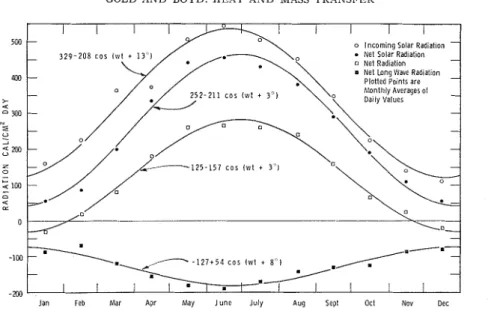
Incoming solar radiation on a horizontal surface was measured near the site \\-it11 a n Eppley pyrheliometer supplied by the R4eteorological Service of Canada. Average monthly values for the daily radiation for the 2-year period are plotted in Fig. 4. Shown also is the Fourier component with a period of
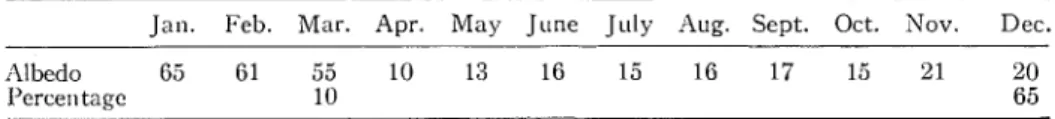
1 year. Average monthly values for the albedo obtained with the two Eppley instruinents mounted baclc t o baclc are as follo\vs.
--
Jan. Feb. Mar. Apr. May June July Aug. Sept. Oct. Nov. Dec. illbedo 65 61 55 10 13 16 15 16 17 15 21 20
8 C A N A D I A N JOURNAL O F EARTH SCIENCES. VOL. 2, lSG5
Jan Feb Mar Apr May June July Aug Sepl ocl NOV Dec
FIG. 3. Fourier component of period 1 year for t h e net radiation, convection, mass tra~lsfcr,
and ground heat flow a t the Ottawa site.
A comparison with other radiometers indicated that these albedos are accurate t o within 5 albedo units. The two albedo values for the months of December and March are for the periods with and xvithout snow cover. Of interest is the marked increase in albedo when the ground becoilles covered with snon- and the gradual increase for the grass cover during the summer. A Ion- value for the albedo in summer and a relatively high value in winter are character- istic of most terrains in Canada.
T h e albedos above were used t o calculate for each month the average daily net solar radiation from the incoming solar radiation observations. Average daily net long-wave radiation for each month was obtained by subtracting net solar radiation from the net radiation. T h e inonthly averages for the daily net solar and long-'ivave radiation are plotted in Fig. 4. Given also are the Fourier components with period 1 year.
DISCUSSION
One of the more difficult aspects of establishing the heat balance a t ground surfaces is t o determine the probable accuracy of observations and calculations. T h e Fourier approximation for the net radiation given in Fig. 3 agrees within f 2 0 cal/cm"ay with the observed average daily values for each month for the 2-year period. A check of the calibration of the net radiometer in 1963 gave a calibration factor for long-wave radiation within 2y0 of t h a t used for t h e period of observations.
GOLD AND BOYD: I-IE.-\T A N D MASS TRANSFER 9
-2W
Jan Feb Mar Apr hlay June July Aug Sept Oct Nov Dec
FIG. 4. T i m e depeilder~ce o f t h e incoming solar, net solar, net long-w;lve, and net radiation.
o Incoming Solar Radiation -
Net Solar Rad~ation
o Net Radialion -
-
1 2 5 - 1 5 7 c o s lvrl + 3 ' 1
I t is considered that the Fourier approximation for t h e ground heat flow agrees \\;ithill f 3 cal/crn2 day with the average daily values for each inonth for the 8-year period. The approxiinatioll for evapotranspiration and sublima- tion is considered to be ~vithin f 25 cal/cm2 day of the average daily values for each inonth during the period from early winter to the middle of summer, but inay be in error by inore than this amount in the fall and late summer. Little can be said about the accuracy of t h e approxiillatioil for the coilvective component, except to aclcno~vledge that it probably has the largest relative error.
A checlc was inade on the evapotranspiratioil approximation by integrating the equation in Fig. :3 over the period 1 April to 30 September. The loss \vas calculated t o be equivalent t o 57 till of ~ v a t e r . This is in good agreement with
the observed rainfall of between 45 and 50 cm as there was a net loss of soil water during that period for both years. T h e heat associated \\:it11 the approxi- mation for each of the other components \\;as obtained b y integration for the above period as well. The values obtained are given in Table I , expressed both in cal/cm%nd as the height of a column of water 1 c111V11 cross-sectional area that could be evaporated a t 0 O C by the heat associated ~ v i t h each component.
Froin this table it may be seen that for the Ottawa site about 48% of t h e net solar heat gain in summer was dissipated by evapotranspiration, 42% by long- wave radiation, and 7Yo by convection and that only 3% was stored in the ground. Because the components are alnlost in phase, the above figures indicate also the approximate average partitioning of heat amongst the coillponents throughout the summer. T h e heat used for plant gro~vth, probably less than
1% of the net solar radiation, was not considered in the study.
The compone~lts given in this paper are expressed as average daily values, but it should be kept in mind that each component iindergoes a daily fluctuation
CANADIAN J O U R K A L O F EARTI1 SCIENCES. VOL. 2, 1935 TABLE I
Net heat associated with each Fourier component during the pxiod April 1 to September 30
- --
Equiv. ht. of Percentage of Ileat, column of water net solar Component cal/cm2 evaporated, cm radiation Incoming solar 8 . 3 ~ x lo4 140.8
Net solar 7 .O5 X 10' 118.5
Xet long wave -2.95X101 49.6 41.8
Yr 4.10X10.' 68.9
PC -3.41X10" 57.3 48.4
Qc -0.51X101 8.5 7 . 0
Yg -0.20X10L 3 .3 2.8
as well. For example, unless there is nlarlred advection, most of the evapo- transpiration mill occur during the daytime in association wit11 the absorption of solar radiation. During the daytime convection will dissipate heat, but a t night, if there is a significant long-wave radiation loss, convection will probably carry heat from the atmosphere t o the ground surface. T h e partitioning of the heat over long periods as determined in the present analysis, therefore, gives no indication of the partitioning for each instant.
T h e calculated heat flow rates are all about the same absolute size in winter and, except for the ground heat flo\v, about equal to the probable error in the observations or calculations. This demonstrates one of the difficulties that is encountered in trying to determine the heat balance a t the ground surface in winter for periods of 1 day or longer. I t is of interest t h a t the calculations indi- cate a net convective heat gain t o the surface in winter.
ACKNOLVLEDGMENTS
T h e authors record their sincere appreciation for the assistance given by R. Armour and P. Montford in talring and analyzing the observations. This paper is a joint contribution from the Division of Building Research, National Research Council, Canada, and the RIeteorological Branch of the Department of Transport, and is published with the approval of their Directors.
REFEREYCES
BOYD, D. W. 1962. Co~nparison of CSIRO and Suomi radiometers. Symposiu~n on the Heat Exchange at Snow and Ice Surfaces, Associate Committee on Soil and Snow Mechanics, Ottawa. Tech. Mem. No. 78.
FUNK, J. P. 1959. Inlproved polythene-shielded net radiometer. J . Sci. Instr. 36(6), 267.
GOLD, L. \V. 1963. The influence of snow cover on the average annual ground temperature a t Ottawa, Canada. Presented to the Intern. Union Geodesy Geophys., Intern. Assoc. Sci. Hydrol., General Assembly, Berkeley, Calif. August, 1963. Publ. No. 61, pp. 82-91.
PHAIICE, D. C. and GOLD, L. W. 1959. Observations of ground temperature and heat flow a t Ottawa, Canada. J. Geophys. Res. 64(9), 1293.
PENAIAN, H. L. 1948. Aratllral evaporation from open water, bare soil and grass. Proc. Roy. Soc. London, Ser. A, 193, 120.
1956. Evaporation: a n introductory survey. Yetherlands J . Agric. Sci. 4(1), 9. THOIINTHIVAITH. C. CV. and MATHBII. 1. R. 1957. I~~structions and tables for c o r n o u t i ~ ~ r
p o t e ~ ~ t i a l evapotranspiration a n d the water balance. Publ. Climatology, lO(3). brexel Inst. Technology, Laboratory of Climatology, Centerton, N.J.
WILLIAJIS, G. P. 1959. Evaporation from snow covers in Eastern Canada. Div. Bldg. Res. Natl. Res. Council Canada, N.R.C. No. 5003.