Publisher’s version / Version de l'éditeur:
Journal of Applied Chemistry, 13, 9, pp. 375-382, 1963-11-01
READ THESE TERMS AND CONDITIONS CAREFULLY BEFORE USING THIS WEBSITE. https://nrc-publications.canada.ca/eng/copyright
Vous avez des questions? Nous pouvons vous aider. Pour communiquer directement avec un auteur, consultez la première page de la revue dans laquelle son article a été publié afin de trouver ses coordonnées. Si vous n’arrivez pas à les repérer, communiquez avec nous à PublicationsArchive-ArchivesPublications@nrc-cnrc.gc.ca.
Questions? Contact the NRC Publications Archive team at
PublicationsArchive-ArchivesPublications@nrc-cnrc.gc.ca. If you wish to email the authors directly, please see the first page of the publication for their contact information.
NRC Publications Archive
Archives des publications du CNRC
This publication could be one of several versions: author’s original, accepted manuscript or the publisher’s version. / La version de cette publication peut être l’une des suivantes : la version prépublication de l’auteur, la version acceptée du manuscrit ou la version de l’éditeur.
For the publisher’s version, please access the DOI link below./ Pour consulter la version de l’éditeur, utilisez le lien DOI ci-dessous.
https://doi.org/10.1002/jctb.5010130902
Access and use of this website and the material on it are subject to the Terms and Conditions set forth at
A datum point for estimating the absorbed water in hydrated Portland
cement
Feldman, R. F.; Sereda, P. J.
https://publications-cnrc.canada.ca/fra/droits
L’accès à ce site Web et l’utilisation de son contenu sont assujettis aux conditions présentées dans le site LISEZ CES CONDITIONS ATTENTIVEMENT AVANT D’UTILISER CE SITE WEB.
NRC Publications Record / Notice d'Archives des publications de CNRC:
https://nrc-publications.canada.ca/eng/view/object/?id=bc3fee0b-d31d-4dbe-9200-dc51ca3307c2 https://publications-cnrc.canada.ca/fra/voir/objet/?id=bc3fee0b-d31d-4dbe-9200-dc51ca3307c2Ser
THL
1
N21r2
, no.
204
c.
2
NATIONAL
RESEARCH
COUNCIL
C A N A D A
DIVISION O F BUILDING RESEARCH
A DATUM POINT F O R ESTIMATING T H E
ADSORBED WATER IN HYDRATED PORTLAND C E M E N T
BY
R. F. FELDMAN A N D
P. J . SEREDA
R E P R I N T E D F R O M J O U R N A L O F A P P L I E D C H E M I S T R Y , VOL. 1 3 , 1963, P. 375-
382 R E S E A R C H P A P E R N O . 2 0 4 O F T H EDIVISION O F BUILDING RESEARCH
P R I C E 2 5 C E N T S
OTTAWA
T h i s publication i s being d i s t r i b u t e d by the D i v i s i o n s f Building R e s e a r c h of the National R e s e a r c h Council. It ehould not be r e p r o d u c e d in whole o r in p a r t , without p e r m i s - s i o n of the o r i g i n a l p u b l i s h e r . T h e Division would be glad to be of a s s i s t a n c e in obtaining s u c h p e r m i s s i o n .
P u b l i c a t i o n s of the Division of Building R e s e a r c h m a y be obtained by m a i l i n g the a p p r o p r i a t e r e m i t t a n c e , ( a Bank, E x p r e s s , o r P o s t Office M ~ n e y O r d e r o r a cheque m a d e p a y - able a t p a r in Ottawa, to the R e c e i v e r G e n e r a l of C a n a d a , c r e d i t National R e s e a r c h Council) t o the National R e s e a r c h Council, Ottawa. S t a m p s a r e not a c c e p t a b l e .
A coupon s y s t e m has been i n t r o d u c e d to m a k e p a y - m e n t s for publications r e l a t i v e l y s i m p l e . C ~ u p o n s a r e a v a i l - able in d e n o m i n a t i o n s of 5, 2 5 and 50 c e n t s , and m a y be o b - tained by m a k i n g a r e m i t t a n c e a s indicated above. T h e s e coupons m a y be u s e d f o r the p u r c h a s e of a l l National R e s e a r c h Council publications including s p e c i f i c a t i o n s of the Canadian G o v e r n m e n t Specific ations B o a r d .
A N A L Y Z E D
Reprinted fro171 the Jolonal o f Applied Chetnistry, 1963, Vol. 13, pp. 375-382
A DATUM POINT FOR ESTIMATING THE ADSORBED
WATER IN HYDRATED PORTLAND CEMENT
By R. P. FELDMAN and P. J. SEREDA
' I n order t h a t i t may be possible t o differentiate bctween adsorbed water and water chemically bound in hydratcd Portland cement, a study was conducted o i the dimensional-change sorption characteristics a t low relative vapour pressures.
B y use of compacts of bottle-hydrated ccnlcnt fabricated a t loads between 5000 and 65,000 lb., equilibrium as well as dynamic values were obtained for dimensional change and moisture change rclationsllips below 20% R.1-I. The apparatus enabled experiments t o be performed in high vacuum.,\
For t h e first rewetting a n d second drying i t was found t h a t for equilibrium points from 7.2 t o 17.6 a n d 17.7 t o 7.9% R . H . the plots o i ( A1/1) vs ( AWIW) mere both linear. After degassing the
specimens beyond 7.99; R.H., the dynamic points continued along the straight line traced o u t by tlic cquilibriunl points in the plot mentioned and a sharp transition point was obtained. The vapour pres- sure in the region of this transition point, referred t o a s datuin point, was less t h a n 10 p. Further degassing produced another linear region.
< I t was concluded with supporting evidence from worlc on other porous materials t h a t t h e datum point where the transition between t h e linear portions of the curve occurs, xvill yield a good estimate of the true value for adsorbed water a n d will t h u s approximate t o the point for zero adsorbed water ;
i t will also separate the processes of dcsorption and dehydration. This establishes therefore a method for determining t h e adsorbed water in hydrated cement.
The results obtained from the compacts of bottle-hydrated cement indicate t h a t by t h i s method the surface area, as calculated from the L3.E.T. theory, will be considerably lower t h a n t h a t obtained from the high value for the cvaporablc waterldetermined by t h e method of Copeland & Hayes).
. - . ~. ,
Introduction
Hydration products of Portland cement are described as ribbon-lilte fibres, plates and crumpled sheets, the substance being poorly crystallised and given the general name 'paste'. The chemically combined water in these hydrates, termed 'non-evaporable water' of amount 'T.V,'%,* can be partially withdrawn a t very low vapour pressures1 because of decomposition of the hydrates before all the physically adsorbed water has been removed from the surfaces of the microcry-
stalline material. Thus during drying a t 21°, the removal of the sorbed water merges into the
removal of the chemically bound water so t h a t it is difficult to distinguish between the two. Since the knowledge of W,, is essential t o the study of the chemical and physical properties
of the paste, arbitrary conditions of drying were established w l ~ i c l ~ defined the point when
practically all adsorbed water was removed. Polvers & Brownyard2J have determined W , after
drying the hardened cement paste in a vacuum system containing rnagnesiurn perchlorate dilly-
drate and tetrahydrate, whereas Copeland & Hayes4 used a dry-ice trap to establish the water-
vapour pressure. I n these methods, however, the paste does not reach constant weight; rather, a
constant rate of loss of weight is attained. Copeland & Bragg5 state, l~owever, that non-evaporable
water in specimens dried by the procedure of Copeland & Hayes probably corresponds 1-atller
closely to chemically combined water.
Once the drying procedure for Portland cement paste had been established, the theory of
Brunauer, Emmett & Teller6 was applied by Inany w ~ r l t e r s . ~ ~ 7-11 This application of the theory
is still in constant use, and has proved to be a valuable tool for studying the physical structure. This work largely provided the informatioil by which it is now understood that the products of cement hydration consist of submicroscopic crystals which form a stiff colloidal gel. Nitrogen
sorptiongJ2 as well as otlier e v i d e n ~ e l ~ ~ ~ ~ have also demonstrated this.
There is considerable controversy, however, regarding the values obtained for the surface area of paste because there is a difference between tlle values obtained by nitrogen sorption and those obtained when water is used as sorbate. Even values obtained with water differ consider- ably depending on the history of the sample.ll The uncertainty in the determination of W,, and
V,
(the parameter in the B.E.T. equation from which a value for specific surface is calculated),caused by the somewhat arbitrary definition of the dry state may be contributing t o some of the variations noted above. For this reason, it would be a great advance to find an absolute method
for determining
V,
and W,.Studies on other porous materials15-l7 have shown that a knowledge of the relationship between dimensional cllange and moisture content provides valuable information for the study * W , is defined as the quantity of water retained by the hydrated paste when dried to constant weight through
a dry-ice trap.
376 FELDMAN 6 SEREDA-ADSORBED WATER I N PORTLAND CEMENT
of the process of adsorption and of the physical characteristics of these porous materials. Work by the present authors18 on other hydrous porous systems, notably CaS0,,0.5H20, has shown that combined measurements of water uptake or loss and corresponding dimensional changes can be used to differentiate between the sorbed water and the chemically bound water, because the dimensional change due to unit change of chemically bound water content is usually different from the dimensional change due to unit change in adsorbed water content.
Although experimental results of the shrinkage of hydrated have served to esplain
certain practical problems, the drying conditions have not been defined sufficiently accurately, nor measurements made precise enough to enable the use of the results in analyses or interpreta- tions of the phenomenon. Even reports of results of equilibrium measurements of shrinkage as a function of the water loss23-26 do not differentiate between the different types of water because most of the measurements were not estended below 30% R.H.
The present work was done to provide precise equilibrium information below 20% R.H. for dimensional-change-moisture-change relationships of hydrated Portland cement paste with a view to differentiating between the adsorbed and non-evaporable water content.
Experimental
To obtain precise measurements of the changes in water content a t given conditions of vapour pressure and the corresponding dimensional changes, it was desirable to use rigid samples of hydrated Portland cement paste which would have a well-defined and reproducible total pore system. I n addition, the samples should be very thin to allow a short time to equilibrium and to minimise gradients of moisture content which may affect dimensional change measurements.
Finally, it was desirable to have the cement completely hydrated. A sample of polyethylene
bottle-hydrated cement paste" was obtained from the Portland Cement Association laboratories which was considered completely hydrated. (Experience in the study of cement hydration is that
cements with W , of 23-25% are almost completely hydrated.) Information concerning the
composition of the clinker and its calculated potential composition has been publi~hed.~8 I t has
been designated as No. 18 and is a Type I cement.
After the cement had been dehydrated in a polyethylene bottle on a rotating wheel a t waterlcement ratio ('CVIC) of 5 for 90 days, it was dried over calcium chloride (CaC1,,2H,O, 11% K.H.) and stored. The hydrated cement was in powdered form. The non-evaporable water in this paste, determined by ignition at 1050" after drying at 105", was found to be approx. 23% as compared with the value 21.7% obtained by hydrating the cement a t a W/C ratio of
0.4 for 1 year.
Compacts made from this powdered paste of particle size less than I p were formed in a range
of porosities by varying the pressure a t which the samples were compacted. Compacts in the
form of discs of about
&
in. thickness were conlpacted in a mould 1.250 in. in diameter. Loadsof from 5000 to 65,000 lb. were applied to the pistoils to form the compacts of different porosities. Hereafter the symbol 'L' will represent 1000 lb. load on a pistoil of 1.250 in. diameter. Thus a compact designated as 5 L represents one compacted a t 5000 lb. Previous work on compacts made from a variety of powders17,18 has shown that the dimensional changes of a compact during sorption give a true representation of a rigid porous system. Results of this work substantiate the belief that compacts of hydrated Portland cement also give a true representation of a rigid
system defined by the geometry and size of the particles and their spacing. It is not known,
however, whether the pore system of a compact of a given equivalent W,/C ratio* is truly
representative of paste hydrated from a mix of the same W/C ratio. \IToi-lc in progress is attempt-
ing to clarify this question.
Afijnratzu
The high-vacuum apparatus used for this work was designed to expose 12 samples simul- taneously for long periods to the same vapour pressure conditions, with exclusion of air. Six of these samples were mounted in individual tubes on quartz spirals of the McBain-Bakr type
giving the results of the weight changes to a sensitivity of 2-6 x 1 0 - Q . The remaining six
samples were mounted on modified Tuckerman optical extensometers and placed in individual
cells equipped with optical w i n d o ~ v s . ~ ~ This yielded the dimensional changes with changes in
*W,/C t h e equivalent water-cement ratio of t h e colnpact, is defined as t h e \V/C of normally hydrated cement which will produce on approximately complete hydration t h e same total pore volume as t h a t of the compact of bottle-hydrated cement. This is calculated b y use of t h c density of hydrated cement a s 2.67 g./c.c. and of unhydrated cement as 3.0 g.1c.c. The volume of gel pores is talcen as 2Bo/, b y volume ot t h e gel system.
FELDMAN 6 SEREDA-ADSORBED PVATER I N PORTLAND CEMENT 377
vapour pressure to a sensitivity of 2 x in./in.
A three-stage oil diffusion pump baclced by a rotary vacuum pump was used to obtain pressures of mm. Hg.
The adsorbate was introduced into the system Irom a bulb which was immersed in a bath that could be controlled a t temperatures between 0" to 70°r; to within 0 . 1 " ~ . The samples were maintained a t 70°r; by immersing the lower ends of the tubes and cells containing the samples to a depth of 12 in. in a controlled bath. Room temperature was coiltrolled at 73 f lor;. Procedz~re
Two samples measuring about I & x
8
x2,:
in. 1vei-e cut from each compact and mounted, one on the extensometer and the other on the quartz spiral. Initial degassing of these samples (referred to below as 'first drying') was acllieved by evacuating simultaneously through a mani- fold. A dry-ice trap was used together with three-stage diffusion and rotary pumps; degassing continued for as long as 8 days.Adsorption was achieved by allowing the manifold to attain a humidity of 7.2% by control of the temperature of the bath in which the water source was immersed, and exposing the samples simultaneously to this humidity. This procedure was continued for ecluilibriuin points up to 17.6% humidity. Three days \yere allowed for equilibrium to be attained between points and 15 h. of constant weight always elapsed before the system was considered to be in equilibrium. The samples were then talcen to saturation and redried to 17.7% and four equilibrium points were again obtained between 17.7 and 7.9% humidity. The samples were then dried in pairs by evacuation, those that had been made at the same pressure, simultaneously, one oil a spiral and the other on the extensometer. Dimensional-change and ~veight-change measuremeilts were talcen continuously. (Humidity in this paragraph is R.H.).
Results
( I ) First drying (from 11% R.H.)
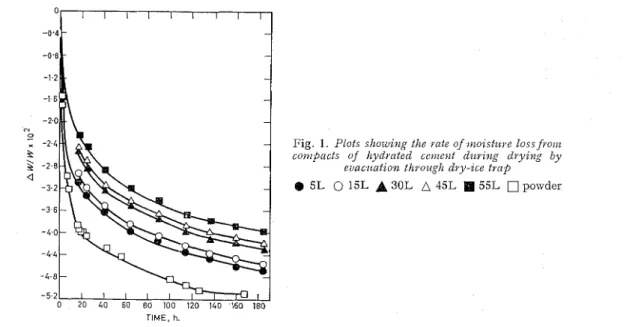
Fig. 1 shows the weight loss-tiinc curves lor the 5L to 55L compacts and also for a powdered sample. I t is seen that the rate of weight loss is greatest for the powdered material and decreases considerably the higher is the fabrication pressure of the compact. These curves demonstrate how the porosity of the sample can affect the rate of water loss during drying by evacuation through a dry-ice bath. Thus different amouilts ol total water call be removed from different samples even though they all may be dried until they reach the point when they lose water at the same rate of
1 mg. per g. of sample per day \vhich was arbitrarily set as the point \vhen the evaporable water has been removed. Thcse results show that the criterion for determining the cvaporable water cannot be used for compacts as the sample must be grouild to a fine particle sizc.4 The evaporable water was determined for the powclerecl material and, as shown in Fig. 1, is not far removed from that ol the 5L compact.
Fig. 1. Plots showz11g the i a t e of ~ ~ z o z s t ~ l v e loss fvoiiz c o ~ t ~ p n c t s of I~y(ydi*nted cerilolt d ~ ~ v z ~ z g dyyzn," b y
evac~ccct~o~z thvoz~glz dvy-zce t v n p
5L 0 15L
A
30L 45L 55L powderTIME, h.
378 FELDMAN C SEREDA-ADSORBEL) WATER I N PORTLAND CEMENT
Fig. 2 shows a plot of the length change vs the weight loss which yields straight lines for all
the compacts made a t the different pressures ; the greater the load for compaction, the steeper
is the slope of these curves. This plot also shows that il the straight lines are extrapolated they will not pass through the point representing the state of the compacts before drying from 11.0
R.H.
In order to pass through this point, a breali in the straight line, i.e. a change in slope, is anticipated.A W I W x 10'
Fig. 2. Plot of co)zlvactio~z us weiglrt loss cluri?2gjirst drying of conzpacts of lzyydvaterl ce))ze?zt
e 5L
o
15LA
30L n 45L H 55L 65LI t is significant that despite the obvious differences in the permeability of the samples (the 5L compacts have quite a high porosity compared with the 65L compacts, see Table I), all the
compacts give the same general results : straight lines which do not extend through the starting
point. These values were obtained over a period of S days, during which time the rate of weight
loss was very slow. I t can bc concluded that little or 110 moisture gradients existed through the
samples and that the values represented on Fig. 2 are well clefinecl, although the equivalent equili-
brium relative humidities were not known. I t is known, howevcr, that these humidities were xvell below 7.5%.
(2) First rewetting
The equilibrium points for the first rewetting between 7.2 and 17.6% R.H. show a linear plot for the dimensional change vs change in moisture content. I l this linear plot is extrapolated back, it is seen that to pass through the starting point for rewetting a change in slope has to occur.
These results are shown in Figs. 3 and 4 for the 5L and 45L compacts respectively. Both these
plots are considerably below their respective first drying curves.
Table I
Physical cl~ctracie~isfics of co)npacts of bottle-hyclrated cen~ent a)zcl its wcrier conte~lt at 17.7% X . H . relative to dntunz point
Load, lb. Porosity, % void fraction Equivalent W/C ratio % water* from datum point to 17.7% R.H.
1st Rewetting 2nd Drying
O/, watert for 1st drying from 11% R.H. % watert for 1st rewetting from driest point to 17.6% R.H.
30L 45L 55L 65L Powder
42.9 39.5 35.8 33.8
-
0.581 0.505 0.467 0.436 -
* based on weight a t datum point
t
based on wcight a t driest pointFELDMAN C SEREDA-ADSORBED TIT~TEI? I N PORTLAND CElldENT 379
A W I W x l o 2
Fig. 3. Plot of lelzgth c l ~ a ~ t g e vs ntoistztve co~ztsnt cl~olzge fov 5L comnpact of hydrated cenzelzt
A first drying (dynamic points)
A
second drying (dynamic points)0 first rewetting (equilibrium points) 0 second drying (equilibrium points)
(3) Second drying curve
All the samples were talten to approximately saturation conditions and then redried t o 17.7% R.H. ; four equilibrium points were talten down to 7.9% R.H. The ( A1/1) vs ( AWIW) plot is again linear, the plot for the 5L compact being slightly above its first wetting curve and the 45L compact somewhat below the first wetting curve. The significance of this will not be discussed here, suffice it to say that it is considered to be in line with accepted ideas of drying shrinkage.
At the stage after 7.9% R.H., further drying was effected by contiiluous pumping. The curve
for both plots (Figs. 3 and 4) continues to follow closely the straight line traced out by the
previous equilibrium points. At a certain point these straight lines showed an abrupt change i n
A W I W x 10'
Fig. 4. Plot of le~zgth chctrzge vs moistlire co~ztent clzccngefov 45L cow~pnct of hydmtscl cenzeltt
A first drying (dynamic points)
A
second drying (dynamic points)0 first rewetting (equilibrium points) 0 second drying (equilibrium points)
380 F E L D M A N & SEREDA-ADSORBED WATER I N PORTLAND C E M E N T
slope and continued along a new linear curve of steeper slope. I t was found that the change in slope was more abrupt for the compacts formed a t the higher pressures than the ones at the lower.
This is typified in Figs. 3 and 4. I t was also observed that the slopes of these linear portions seem
to decrease with the repeating cycles of wetting and drying.
The above experiment, where drying below 7.9% R.H. was effected by continuous pumping,
was repeated on another sample ; here, however, pumping was carried out for short periods,
followed by long intervals of up to 15 11. to attain equilibium. I t was found that the results of the
two experiments did not differ. Shortly after the abrupt change in slope on the (Alll) vs (AWIW) plot, pumping was terminated and the sample was allowed to reach equilibium within the sorption system for 4 days. Manometer measurements indicate that the equilibrium vapour pressure is
less than 30 p and computations from the knowledge of sample weight loss and dead space of the
apparatus using the gas laws sholv that the vapour pressure is less than 10 p.
Discussion
A sharp break in the (A1/1) vs (AWIW) curve was discovered in this second drying curve,
and served as the boundary between two linear portions. The same plot for other adsorbents with water as adsorbate, Vycor glass,lG precipitated calcium carbonate, and 'Cab-0-Sil' silica,l7
wl~ich is a form of silica in the particle size range 0.01-0.03 p, shows a linear portion through the
origin, i.e. zero adsorbed water and zero expansion, and extending to one or two molecular layers of adsorbed water. This linearity also occurs for CaS0,,O.5H2O before dehydration of the sample taltes place a t low pressures.18 As these cement compacts also show this characteristic down t o low humidities, and then show a sharp brealc after some period of evacuation, it is considered that, in the transition region between the two linear portions of the curve, the point representing the onset of dehydration of the cement exists. This point is referred to henceforth as the 'datum point'.
Since the free-energy change of the surface on sorption can be expressed in terms of the dimensional change,l5 it is expected that the processes of sorption and hydration should yield different (Al/l) vs (AWIW) relationships. I t is possible that during evacuation, both processes-
dehydration and desorption-may take place simultaneously. This, however, appears not to be
the case for the first period of evacuation where the points obtained dynan~ically on the (AWIW)
vs (Alll) plot follow precisely the straight line formed by the equilibrium points. In Figs. 3 and 1,
assuming that line E F represents the desorption process and line FG represents the dehydration process and possibly the continuing desorption process, the intersection of these lines represents
the datum point. As shown in Figs. 3 and 4, however, line FG remains linear for the full range of
observations. I t is expected that the dehydration process alone will provide a linear (Al/l) vs
(AWIW) relationship, and thus the linear curve FG can only represent two possible cases :
(i) Hj~drate water alone is being removed along line FG ; some adsorbed water remains, this
being the amount in equilibrium with the vapour pressure at which tlle cement is dehydrating. (ii) The hydrate water and adsorbed water are being removed simultaneously in the same proportions.
The probability of the latter case is considered remote ; as adsorbed water is removed, the
greater will be the adsorption energy of the remaining water. Further, the vapour pressure in this region is in the order of a few microns, and the amount of adsorbed water remaining will be very small. From these considerations the first case is favoured with F representing the point above which no hydration water can be removed and below which the amount of adsorbed water remain- ing is necessarily small. This datum point yields a value for adsorbed water closely approximating the true value.
The slight deviation of the actual points in this transition regions shows that the two processes do talte place simultaneously for a short period. The degree of deviation is greater for the 5L compact, however, than for the 45L compact and it is almost negligible for the latter. This can be well understood when one considers the permeabilities of the respective samples. Evacuation for 50 min. is required for the 5L compact before the datum point is reached from the last equilibrium point, while 110 min. are required for the 45L compact. Because of this, there is more chance of the two processes, desorption and dehydration, occurring separately for the 45L compact, and thus for that sample the transition region is sharper.
In Figs. 3 and 4, line BC was constructed by drawing a line parallel to G F and through B,
the point reached for the first drying. Where BC intersects DC, the first rcn~ettiilg curve, a t C, is
FELDMAN 6 SEREDA-ADSORBED WATER I N PORTLAND CEMENT 381
considered to approximate the datum point. When considering the reverse process of adsorption,
BC represents the l~ypothetical rehydration curve. This shows that the datum points in Figs. 3
and 4 for the first rewetting and second drying curves are considerably displaced. Study of the equilibrium data 01 weight change to relative humidity from 0 to 17.6% for both first rewetting and second drying (Fig. 5), using the respective datum points as the points for zero adsorbed water shows that the whole curve for drying (desorption) lies coilsiderably above that for rewetting (adsorption) and that the difference between the zero point and 17.6% R.H. for both cases is very similar. I t is now seen (Fig. 5) that the equilibrium curves for adsorption and desorption are separate, the position in terms of the moisture content a t similar relative humidities being that the desorption value is much higher than the adsorption value. The full significance of this fact is being investigated more thoroughly.
Fig. 5. Plot of weight chazge vs relative
uapoz6r pressl6re for coriq5acts of I ~ y d m t e d cement
9 second drying 0 first rewetting (a) compact 5L (b) compact 45L
Table I shows the values obtained in terms of weight per cent, using the weight of the sample a t the datum point in each case as the dry weight of the sample. These quantities are for the change in weight ( AWIW) from the datum point to 17.7% R.H. humidity. For the first rewetting the average for the six pressures of fabrication is 2.18% and for the second drying 1.94%. There is a decrease in this value from 2.18 to 1.94% fromfirst rewettingto seconddrying. Thisisprobably
due to a decrease in area as shown by Tomes e t al.1° on cycling experiments. The similarity
between the above values for all pressures of fabrication, despite the great change in the total porosity of the compact with pressure of fabrication (Table I) or equivalent W,/C ratio, indicates that these results are not affected by moisture gradients that might have occurred during evacuation when the dynamic points were obtained.
Comparison of the data obtained by Lerch e t n1.2s for the same cement (Table 11) (results
recalculated as
%
of dry paste through knowledge ofw,),
shows that for a one-year hydratedcement a t \V/C ratio of 0.4, the sorbed water a t 36% R.H. is 5.8%. This means that, at 17.7%
R.H., the sorbed water would be approximately 4.1% by weight of the dry paste or 70% of sorbed water a t 36% R.H. This is considerably higher than the 2.18% obtained in this work. I t is possible, however, that the bottle-hydrated cement does not have the same morphology and surface area as the cement hydrated in the normal manner.
By use of these compacted samples, the comparison of results obtained by measuring the sorbed water from the datum point to 17.7% R.H. (new method) with those obtained by the conventional method of degassing until a weight loss of less than 1 mg./g. of sample per day is recorded, shows that values obtained by the new method are much lower than those obtained for either the first drying or the first rewetting by the conventional method.
Table I1
Co~lve~ztio)zal nzethorl of detenninntio?zZ8 of physical cl~avacle~istics
(Non-evaporable water % for W/C of 0.4)
Time 7 days 28 days 3 months 1 year
% * 16.2 19.2 20.9 21.7 Sorption a t 0,367 PIPo, % 4.0 5.3 6 .O 5.8 Approximate sorption 7
a t 17.7% R.H., % 2 43 3.7 4 . 2 4.1
* based on weight of original unhydrated cement
t based on weight of d r y hydrated cement
382 FELDMAN 6 SEREDA-ADSORBED I/T/;LTER I N PORTLAND CEMENT
Conclusion
A new method for differentiating between adsorbed and non-evaporable water llas been developed. 13y plotting dimensional changes against weight change, two distinct linear portions are obtained in tlle curve. I t is concluded, with supporting evidence from work on other porous materials, that the point where the transition between the linear portioils of the curve occurs is here defiiled as the datum point for zero adsorbed water. I t then appears that this is a method for determining the adsorbed water in a compact of hydrated cement. The values obtained by the conventional method of drying differ greatly from compact 5L to 65L, although the value for the powdered sample does not differ much from the 5L compact. The values obtained by the new method are practically independent of pressure and are much less than the values obtained for either the first drying or the first rewetting by the method of Copeland Sz ha ye^.^ This means that the surface area as calculated from tlle B.E.T. theory will be much less than t h a t obtained when the high value for the evaporable water (as determined by the Copeland Sz Hayes method) is used.
t l further comparison shows that tlie values obtained for bottle-hydrated cement by the new
method is much less tlian that obtained by conventional methods4 for samples of the same cement hydrated a t \V/C of 0.4 in the normal manner, although the W,, is greater for the bottle-hydrated cement than the cement hydrated normally for a year. I t is possible, however, that the bottle- hydrated cement does not have the same morphology and surface area as the cement hydrated in the normal manner.
Acknowledgments
The authors are grateful to Mr.
N.
R. Greening of the Portland Cement Association who supplied the sample of bottle-hydrated Portland cement. They also wish to acknowledge the valuable assistailce of H. F. Slade and S. E. Dods in setting up the apparatus and recording the information. This paper is a contribution from the Division of Building Research, National Research Council, Canada, and is published with the approval of the Director of the Division.Division of Building Research, National Research Council,
Ottawa 2, Canada
Received 18 March, 1963
References
Brunauer, S., Copeland, L . E., & Bragg, R. I-I.,
J . f i l ~ y s . Cl~e~tr., 1956, 60, (1/2), 112
2 Powers, T . C., & Brownyard, T. L., Proc. ilri~e;,.
Colzcrete Inst., 1947, 43, 101, 249, 469, 549, 669,
845, 865, 933, 971
3 Powers, T. C., Bzlll. A ~ J z ~ Y . SOC. Test. Mat., 1949,
No. 158, 68
4 Copeland. L. E., & Hayes, J . C., B.LLIZ. Amer. Soc.
Test. Mat., 1953, No. 194, 70
"opeland, L . E., & Xragg, R . H., Bzlll. nt~ner. Soc. Test. M a t . , 1955, No. 204, 31
Brunauer, S., 'The adsorption of gases and vapours', 1943, Vol. I (Princeton Univ. Press)
7 Jesser, L., Zement, 1927, 16, 741
8 Giertz-I-Iedstrom, S., Puoc. S y ~ ~ z p . Chemistry o f Ce)~zents (Stockholm), 1938, p . 505
0 Gleysteen, L . F., & I<alouselc, G. L., Proc. Avner.
Concrete Ivzst., 1955, 51, 437
10 Tomes, L . A , , H u n t , C. %I., & Blaine, R. L., J . Res.
nat. Bztr. Stand., Wash., 1957, 59, 357
Hunt, C. &I., Tomes, L. A , , & Blaine, R. L., J . Res.
nat. B L ~ . Stand. Wash., 1960, 64A, 163
l-lainc, R. L., & Valis, H. J., J . Res. nat. B U Y . Stand. Wash., 1919, 42, 257-267
13 Bernal, J. D., 'Structures of cement hydration
compounds', Proc. 3rd I n t . S y ~ z f i . Chemistry of Ceirzent (London), 1952, p. 222
1-1 Sxx~erdlow, M., McMurdie, H . F., & Heckman, F.
A,, Proc. 1721. COT$. Electron iMicroscopy (London),
1954, p. 500
'"angham, D. H., & Maggs, F. A. P., Proc. Conf. o n the ultra-fine structure of coals a n d cokes (British Coal Utilization Res. Ass.), J u n e 1943, p . 118
10 Amberg, C. H., L%L Macintosh, I<., Cannd. J. CI~ern.,
1952. 30. 1012 , ,
-l7 Sereda, P. J., & Feldman, R. F., J . appl. Chem.,
1963, 13, 150
l8 Feldman, R. F., & Sereda, P. J., J . appl. Chejn.,
1963. 13. 158
l"Ienzc1, c.-A., Proc. A ~ n e r . Concrete Inst., 1935, 31,
125
"
Carlson, R . W., Proc. Anzer. Soc. Test. Mat., 1935, 35, 370Piclictt, G., Proc. Amev. Concrete Inst., 1956, 52, 581
'2 IAlexandcr, I<, %I., & Wardlaw, J., A z ~ s t . appl. Sci.,
1959, 10. 201
?3 Dutron, I<., AIL^. Trav. pz~bl. Belg., 1934, 35, 243,
347
I-Ialler, P., Eidg. Mat. Pruf. Anstalt (E.M.P.A.), Zurich, Diskussionsber., 1940, No. 124
25 Powers, 'I. C., J . Anzer. ceramic Soc., 1958, 41, (I ) , 1 20 I<alousek, G. L., A.~Jzer. Co~lcrete I?zst., 1954, 26, 233
"
Brunaucr, S., Kantro, D. L., & Copeland, L. E.. 1. A w e r . chenz. Soc., 1958, 80, 7612 8 ~ e r c h , W., & Ford, C. L., Proc. A m e r . Co?zcretc Inst.,
1948, 44, 745
? V e l d m a n , R. I;.. CS. Sereda, P. J., Proc. Amer.
Concrete I~zst., 1961, 58, 203