HAL Id: hal-00924436
https://hal.archives-ouvertes.fr/hal-00924436
Submitted on 22 Jun 2016
HAL is a multi-disciplinary open access
archive for the deposit and dissemination of
sci-entific research documents, whether they are
pub-lished or not. The documents may come from
teaching and research institutions in France or
abroad, or from public or private research centers.
L’archive ouverte pluridisciplinaire HAL, est
destinée au dépôt et à la diffusion de documents
scientifiques de niveau recherche, publiés ou non,
émanant des établissements d’enseignement et de
recherche français ou étrangers, des laboratoires
publics ou privés.
Distributed under a Creative Commons Attribution - NonCommercial - NoDerivatives| 4.0
International License
Unexpected variability of Martian hydrogen escape
Michael S. Chaffin, Jean-Yves Chaufray, Ian Stewart, Franck Montmessin,
Nicholas M. Schneider, Jean-Loup Bertaux
To cite this version:
Michael S. Chaffin, Jean-Yves Chaufray, Ian Stewart, Franck Montmessin, Nicholas M. Schneider, et
al.. Unexpected variability of Martian hydrogen escape. Geophysical Research Letters, American
Geophysical Union, 2014, 41 (2), pp.314-320. �10.1002/2013GL058578�. �hal-00924436�
Geophysical Research Letters
RESEARCH LETTER
10.1002/2013GL058578 Key Points:•A large decline in hydrogen escape flux from Mars to space is seen in late 2007
•This variation is not explained by prior models or measurements
•Lower atmospheric dust storms may greatly enhance water escape from Mars
Correspondence to:
M. S. Chaffin,
michael.chaffi[email protected]
Citation:
Chaffin, M. S., J.-Y. Chaufray, I. Stewart, F. Montmessin, N. M. Schneider, and J.-L. Bertaux (2014), Unexpected vari-ability of Martian hydrogen escape,
Geophys. Res. Lett., 41, 314–320,
doi:10.1002/2013GL058578.
Received 1 NOV 2013 Accepted 19 DEC 2013
Accepted article online 26 DEC 2013 Published online 22 JAN 2014
This is an open access article under the terms of the Creative Commons Attribution-NonCommercial-NoDerivs License, which permits use and dis-tribution in any medium, provided the original work is properly cited, the use is non-commercial and no modifications or adaptations are made.
Unexpected variability of Martian hydrogen escape
Michael S. Chaffin1, Jean-Yves Chaufray2, Ian Stewart1, Franck Montmessin2, Nicholas M. Schneider1, and Jean-Loup Bertaux2
1Laboratory for Atmospheric and Space Physics, University of Colorado Boulder, Boulder, Colorado, USA,2LATMOS/IPSL,
Guyancourt, France
Abstract
Mars today is much drier than the Earth, though they likely began with similar relative amounts of water. One potential cause for this discrepancy is hydrogen loss to space, which may have removed a large fraction of Mars’ initial water. Here we demonstrate an order-of-magnitude change in the Martian hydrogen escape rate in 2007, inconsistent with established models for the source of escaping hydrogen. We analyze 121.6 nm (hydrogen Lyman-𝛼) airglow observations made by the ultraviolet spectrometer on the Mars Express spacecraft over the second half of 2007. The enhanced escape rates we observe may be due to lower atmospheric heating and overturn during the 2007 (Mars Year 28) global dust storm, suggesting that hydrogen escape from Mars during dust storms may dominate loss of the planet’s water inventory. This scenario has major implications for reconstructing the total amount of water lost to space over Martian history.1. Introduction
The first observations of atomic hydrogen in the upper atmosphere of Mars were made by Mariners 6, 7, and 9, which observed 121.6 nm (hydrogen Lyman-𝛼) sunlight scattered by the outer fringes of the Martian atmosphere, known as the hydrogen corona [Anderson, 1974]. More recent investigations have been per-formed with the ultraviolet spectrometer on the European Space Agency’s Mars Express mission, SPICAM (Spectroscopy for the Investigation of the Characteristics of the Atmosphere of Mars) [Bertaux et al., 2000, 2006]. Previous work studying the hydrogen corona using SPICAM by Chaufray et al. [2008] focused on seven observations; we extend their method to analyze 21 observations in time sequence, taken over the second half of 2007. All of these previous studies were limited in time resolution; the longest contiguous time span previously studied spanned 30 days beginning in March 2005. Ours is thus the first study with the poten-tial to determine the long-term average H escape rate from Mars and the first capable of detecting its time variability on the scale of months.
These observations were selected for analysis to determine the escape rate of hydrogen from the atmo-sphere of Mars, which is thought to be controlled by near-surface and ionospheric chemistry and diffusion through the thermosphere. Soon after the discovery that Mars has a CO2atmosphere, early work established that this atmosphere remained stable against photochemical conversion of CO2into CO and O2through
the odd hydrogen cycle, which catalyzes the recombination of CO and O species into carbon dioxide via photodissociation products of water near the Martian surface [McElroy and Donahue, 1972; Parkinson and
Hunten, 1972]. As a by-product, this cycle produces molecular hydrogen, which has an atmospheric
life-time of hundreds of years [Hunten and McElroy, 1970]. Because molecular hydrogen is light and volatile, it can be mixed upward into the ionosphere, whereas water is trapped close to the surface by the cold trap at the tropopause [Clancy et al., 1996]. Once it arrives in the ionosphere, most of this molecular hydrogen is quickly destroyed through reaction with CO+
2[Krasnopolsky, 2002], producing atomic hydrogen which
dif-fuses toward the exobase. At the exobase, the fraction of the hydrogen atoms with velocities greater than Martian escape velocity can escape to space. In this model, because the escaping hydrogen is sourced from long-lived molecular hydrogen, its escape rate should not be a strong function of season or solar cycle but should only respond modestly to changes in the solar extreme ultraviolet flux that drive the dissociation and ionization processes relevant to hydrogen.
Geophysical Research Letters
10.1002/2013GL058578
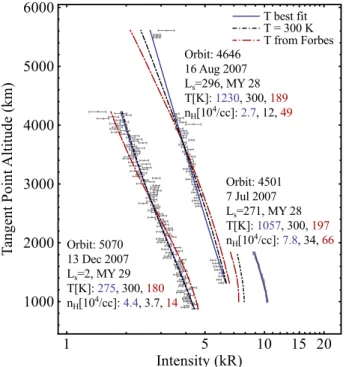
Figure 1. Atmospheric airglow observations and model with three temperature assumptions. Gray points represent observed Lyman alpha airglow intensity in kiloRayleighs (1 kR= 109∕4𝜋photons/cm2/ster/s) and associated uncer-tainties (see text) as a function of minimum altitude along instrument line of sight (tangent point altitude) for three observations. Curves represent best fit model output for three different temperature assumptions: solid blue, best fit model temperature in the range 100–1600 K; short dash-dotted black, temperature fixed at 300 K; long dash-dotted red, temperature from the empirical thermosphere model of Forbes et al. [2008]. Profiles are annotated with observation orbit number, date, and best fit temperature and density for each temperature assumption in the order listed above. The model accurately reproduces observed brightness with a single population across a wide range of observations. Obser-vations are in time sequence from right to left, demonstrating the decrease in hydrogen corona brightness observed in Fall 2007.
2. Observations and Model
For these dedicated observations, SPICAM was pointed inertially across the limb of Mars, along a fixed direction as the spacecraft body moved along its elliptical orbit, so that the spacecraft line of sight passed through a subset of altitudes in the range 400–6000 km over the course of each observation. At these alti-tudes, the dominant planetary emission is at 121.6 nm (H Lyman-𝛼) [Leblanc et al., 2006]. For this work, we isolate the Lyman-𝛼 flux from the corona, subtracting detector and interplanetary backgrounds from the total instrument observed brightness. The interplanetary background, obtained from a model calibrated on Lyman-𝛼 data from the Solar Wind Anisotropy instrument on the Solar and Heliospheric Observatory, constitutes at most 20% of the observed signal for the faintest altitude profiles at the highest altitudes and is more typically<10% of the observed intensity [Quémerais et al., 2008; Lallement et al., 1985]. We bin and average the resulting atmospheric intensity as a function of instrument pointing altitude so that ∼100 intensity-altitude data points result for each observation. The standard deviation in each bin, used to esti-mate measurement uncertainty, tracks the photon noise of the observations well, except in cases where a known high-voltage fluctuation in detector electronics requires exclusion of data.
Three examples of the data, chosen to span the observation period, are shown in Figure 1. We observe a fac-tor of 2 decrease in the brightness of the Lyman-𝛼 corona between July and December in 2007, far larger than that expected from the increase in Sun-Mars distance over this period (see Figure 3). Many of the alti-tude profiles studied show a convex shape that prevents extraction of the coronal temperature from the slope of the profile. This is due to multiple scattering of photons within the corona and the nature of the spacecraft observations, which are made from inside the corona itself.
To extract an escape rate from these profiles, we employ a two-parameter spherically symmetric model of hydrogen density in the upper atmosphere of Mars. In the collisionless exosphere, we adopt a classi-cal Chamberlain model without satellite orbits following Chamberlain [1963], defined completely by the
Geophysical Research Letters
10.1002/2013GL058578
Figure 2. Best fit temperature and density for the hydrogen corona as a function of time. Parameters are shown for all 20 observations analyzed using three temperature assumptions: circles, temperature as a free parameter over the range 100–1600 K; triangles, temperature fixed at 300 K; diamonds, temperature from the empirical thermosphere model of
Forbes et al. [2008]. Symbols are colored by time of observation. Contours give Jeans escape flux of hydrogen at the
exobase. Dotted lines connect parameters fit to observations shown in Figure 1 for each temperature assumption, iden-tified by orbit number. These lines demonstrate the anticorrelation of model fitted temperature and density. Dashed line indicates the exobase temperature for which the effusion velocity from the exobase is equal to the thermospheric dif-fusion velocity. Independent of exobase temperature, we observe a nearly uniform order of magnitude decrease in the escape flux of hydrogen at the exobase of Mars over 6 months in the fall of 2007.
hydrogen number density and Maxwellian temperature at the exobase (assumed to be at 200 km altitude). Given the Maxwellian temperature, we compute the number of atoms with a thermal velocity greater than the escape velocity of Mars, determining the thermal (or Jeans) escape flux of hydrogen [Jeans, 1925]. Below the exobase, we model hydrogen diffusion through the predominantly CO2thermosphere
accord-ing to Krasnopolsky [2002], usaccord-ing the exobase temperature and density as a boundary condition to integrate downward to 120 km altitude. Using the density model, we solve the radiative transfer equation in three dimensions to obtain the photon production rate as a function of altitude and local time, assuming constant solar Lyman-𝛼 intensity across the planetary line width (obtained from Solar Radiation and Climate Exper-iment [Rottman et al., 2006]), Doppler scattering line profiles, and complete frequency redistribution [see
Bush and Chakrabarti, 1995]. Integrating the production rate along the instrument line of sight yields
theo-retical intensity-altitude profiles for comparison with spacecraft data. By adjusting the exobase temperature and density, chi-square deviations of the model from the data are minimized, obtaining best fit parameters and parameter uncertainty estimates.
3. Escape Rate Variation
Extracted model intensity-altitude profiles are shown with the data in Figure 1. Allowing the temperature to be a free parameter results in very high temperatures for our earliest observations. These temperatures are best fit hydrogen temperatures required by the model to fit observed intensities, which diminish slowly with altitude, indicating a more energetic hydrogen exosphere early in the second half of 2007. These best fit temperatures may not indicate the temperature of the bulk atmosphere at the exobase, which is dominated by carbon dioxide and oxygen [see Lichtenegger et al., 2004; Tucker et al., 2013].
Because Jeans escape is quite sensitive to exobase temperature, the effect of temperature on the derived escape rates was investigated by fixing the temperature using two assumptions: first, using a constant tem-perature of 300 K, close to that found by Anderson and Hord [1971] through analysis of Mariner data; second, using the temperature given by Forbes et al. [2008] from an empirical model of Mars Global Surveyor ther-mospheric drag measurements (hereafter, the Forbes temperature), which agrees well with predictions
Geophysical Research Letters
10.1002/2013GL058578
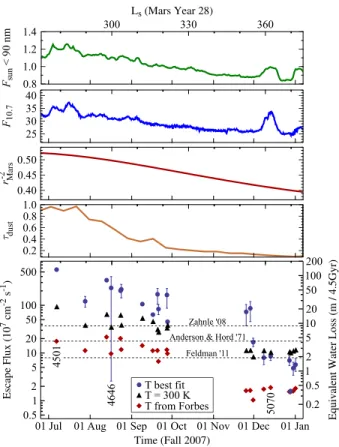
Figure 3. Derived H escape flux and potential explanatory parameters across Fall 2007. (bottom panel) H escape flux for three temperature assumptions: blue circles, temperature as a free parameter over the range 100–1600 K; black triangles, temperature fixed at 300 K; red diamonds, temperature from the empirical thermosphere model of Forbes et al. [2008]. Observations shown in Figure 1 are identified by orbit number. Right axis shows amount of water lost if the correspond-ing H escape flux were constant with time throughout Martian history. Error bars represent derived 95% uncertainties propagated from uncertainties in observed brightness. Where not shown, uncertainties are smaller than point size. Escape flux decline is nearly exponential with time, independent of temperature assumptions. Also shown (dashed lines) are three prior estimates of H escape flux (see text). (first–fourth panels) Potential explanatory parameters. (from top) Total solar flux less than 90 nm in units of W cm−2measured by TIMED/SEE [see Woods et al., 2005] and Solar decimetric radio flux (in10−22W m−2Hz−1), both scaled and phase delayed to Mars following Mitchell et al. [2001]; Inverse square of Mars-Sun distance in AU−2; and optical depth of lower atmospheric dust measured by THEMIS [see Smith, 2009]. Cor-relation of escape flux with solar indices is due to distance scaling of these indices to Mars. Decline of escape flux is well correlated with Mars-Sun distance and lower atmospheric dust opacity but not with short-timescale solar forcing.
of computational thermosphere models described by Valeille et al. [2009]. While there are some concerns about the accuracy and independence of the Forbes temperatures [see Krasnopolsky, 2010], we use them as a proxy for the variation in temperature expected from current models of the Martian thermosphere. In most cases the fit using these temperature assumptions is comparable to, though poorer than, the free tempera-ture fit, indicating the difficulty of extracting temperatempera-ture from these observations. In some circumstances (e.g., for Orbit 4501) specifying an a priori temperature results in a fit inconsistent with the data, indicating that the best fit temperature is well constrained by the model for these observations.
Best fit exobase densities and temperatures for all 20 observations and all three temperature assumptions are shown in Figure 2. Independent of temperature, we find at least an order of magnitude decrease in hydrogen escape flux over the study period. For the highest best fit temperatures, the escape parameter (𝜆, defined as the ratio of most probable thermal velocity to escape velocity) approaches unity, so that the Jeans escape formula (used to determine the escape rate) is not quantitatively accurate; it nevertheless indicates the qualitative magnitude of the escape flux variation we observe. To determine whether the vari-ation we observe is temporal or spatial in nature, we compared the spacecraft observvari-ation geometry with the 3-D thermosphere model of Valeille et al. [2009]. For the observation geometries studied, we find that model predicted variations in temperature and density along the lines of sight are inadequate to support the large-scale changes we observe. In addition, the smooth nature of the decline in escape flux as
com-Geophysical Research Letters
10.1002/2013GL058578
pared with the abrupt changes in observation geometry required by the Mars Express (MEX) orbit indicates that spatial variation in the escape rate is a second-order effect.
For most of our observations, the characteristic effusion velocity from the exobase (defined as the ratio of escape flux to exobase density) is greater than the diffusion velocity of hydrogen through CO2in the thermosphere (defined as the ratio of diffusion coefficient to scale height) [see Hunten, 1973]. Thus, for the free parameter and constant (300 K) temperature models, loss of hydrogen from Mars is limited by the sup-ply of hydrogen from lower regions of the atmosphere (diffusion limited). Because the derived escape rates are so much larger than the rate of diffusive supply, the change in escape rates we observe must be due to a change in the hydrogen density in the thermospheric source region. Among the Forbes temperature fits, one third have an exospheric temperature low enough that the exobase effusion velocity is lower than the diffusion velocity at 120 km, indicating that supply to the exobase is adequate and the escape mechanism itself is the limiting factor. Over this temperature range, hydrogen would diffuse into the exosphere from below during low-temperature periods and escape later when the temperature rose.
The best fit exosphere temperatures indicate a 2 order of magnitude decline in the escape rate of hydrogen from June to December of 2007. As shown in Figure 3, this decline is at least an order of magnitude, inde-pendent of assumptions made about the temperature. It is well correlated with the movement of Mars away from the Sun and with the decline in lower atmospheric dust opacity from the 2007 dust storm as mea-sured by Smith [2009] with the Thermal Emission Imaging System (THEMIS) on Mars Odyssey. Our escape rate variations are not correlated with fluctuations in the 10.7 cm radio flux, a solar activity proxy which we scale, and phase delay to Mars according to the procedures of Mitchell et al. [2001], or in the total solar spec-tral irradiance below 90 nm as measured by the Solar Extreme ultraviolet Explorer on NASA’s Thermosphere Ionosphere Mesosphere Energetics and Dynamics mission [Woods et al., 2005]. Because 90 nm is the ion-ization threshold for CO2, this total solar irradiance provides a proxy for solar energy input into the Martian thermosphere.
4. Discussion
Fitting an exponential decay model to our derived best fit escape fluxes, we obtain an integrated loss of ∼3 precipitable nm of water over the second half of 2007, as compared to previous estimates of 0.7 ± 0.3 precipitable nm per Earth year made by Chaufray et al. [2008]. If the mean level of loss over the course of our observations persisted throughout Martian history, the hydrogen equivalent of 27 m of water (spread evenly over the surface) would be lost from Mars, within the 4–80 m range of previous estimates of the total water loss to space over Martian history without including the effect of the active young Sun on atmo-spheric escape, which would likely greatly increase our estimate (for previous estimates see Krasnopolsky
and Feldman [2001] and Carr and Head [2003]). The range of escape fluxes we observe encompasses
pre-vious estimates for thermal escape of hydrogen from Mars, including those of Anderson and Hord [1971], made from Mariners 6 and 7 measurements at high solar activity; Zahnle et al. [2008], from a model of the maximum possible diffusion-limited escape flux given atmospheric molecular hydrogen abundances mea-sured by Krasnopolsky and Feldman [2001]; and Feldman et al. [2011], from measurements made during the Rosetta spacecraft flyby, which occurred earlier in the same Martian year as our measurements. These pre-vious flux estimates are indicated on Figure 3 with horizontal lines and labels Anderson ‘71, Zahnle ‘08, and Feldman ‘11, respectively.
Our observations demonstrate that escape of hydrogen from Mars is much more variable than previ-ously assumed. The trend of decreasing H Lyman-𝛼 emission and H density was first presented based on Hubble Space Telescope observations at the 2009 Division for Planetary Sciences meeting of the American Astronomical Society [Clarke et al., 2009]. The high escape rates early in our observations could be an annual seasonal phenomenon due to the perihelion passage of Mars, but this seems unlikely given the magnitude of the variation we observe. Instead, we speculate that these enhanced escape rates are an intermittent seasonal phenomenon due to lower atmospheric dust storms acting to warm the lower atmosphere. Dust storms increase lower atmospheric opacity, raising the temperature by up to 15 K in the near-surface atmosphere [Smith, 2009]. This increased temperature intensifies large-scale circulation and the associated Hadley circulation and may remove the cold trap at the tropopause. This would allow mix-ing of water vapor from the surface to thermospheric altitudes, providmix-ing a route for water breakdown and escape that bypasses the long-lived molecular hydrogen buffer. Indications that this may be
pos-Geophysical Research Letters
10.1002/2013GL058578
sible come from SPICAM observations of detached water vapor layers in excess of the saturation vapor pressure between 60 and 80 km altitude in the northern summer (Ls= 50 − 100◦), presented by Maltagliati
et al. [2011, 2013]. Also telling is the magnitude of the enhancement from equilibrium we observe, which is
similar to the ratio of mixing fractions of atmospheric water vapor to molecular hydrogen in the near-surface atmosphere [Nair et al., 1994]. If water is the culprit, our observations imply a much higher degree of super-saturation than has ever been directly observed: Even a factor of 10 enhancement in the equilibrium water vapor mixing ratio as computed by Nair et al. [1994] (implying an order of magnitude supersaturation throughout the atmosphere) does not lead to dominance of water over molecular hydrogen as the source of ionospheric atomic hydrogen. New models are required to explain our observed variation, perhaps time dependent and nonequilibrium.
Mounting evidence, including our results, indicates that the lower atmospheric dust cycle has a large effect on the upper atmosphere. Studies of the thermospheric mass density at 185 km using downgoing and upgoing electron pitch angle distributions by England and Lillis [2012] are consistent with a dust influence on the thermosphere, as are observations of locally produced photoelectrons on closed crustal field lines by
Liemohn et al. [2012]. Withers and Pratt [2013] demonstrate that large changes in thermospheric mass
den-sity can result from dust storms, with a characteristic “return-to-normal” timescale of 20–120◦Ls, consistent
with the results we present. Detailed consideration of the influence of these storms on Martian water loss processes has, to our knowledge, not yet been performed.
Depending on the recurrence timescale of the enhanced escape rates we report, periods of intermittent high escape could be responsible for the vast majority of Martian water loss. As part of NASA’s Mars Atmo-sphere and Volatile Evolution (MAVEN) mission, which arrives at Mars in 2014, further observations of the Lyman-𝛼 corona will be performed, with the goal of further constraining the time dependence of Martian hydrogen escape and addressing the question of whether episodic or steady state escape dominates.
References
Anderson, D. E., Jr. (1974), Mariner 6, 7, and 9 ultraviolet spectrometer experiment: Analysis of hydrogen Lyman alpha data, J. Geophys.
Res., 79, 1513–1518, doi:10.1029/JA079i010p01513.
Anderson, D. E., Jr., and C. W. Hord (1971), Mariner 6 and 7 ultraviolet spectrometer experiment: Analysis of hydrogen Lyman-alpha data,
J. Geophys. Res., 76, 6666–6673, doi:10.1029/JA076i028p06666.
Bertaux, J.-L., et al. (2000), The study of the Martian atmosphere from top to bottom with SPICAM light on Mars Express, Planet. Space
Sci., 48, 1303–1320, doi:10.1016/S0032-0633(00)00111-2.
Bertaux, J.-L., et al. (2006), SPICAM on Mars Express: Observing modes and overview of UV spectrometer data and scientific results,
J. Geophys. Res., 111, E10S90, doi:10.1029/2006JE002690.
Bush, B. C., and S. Chakrabarti (1995), A radiative transfer model using spherical geometry and partial frequency redistribution,
J. Geophys. Res., 100, 19,627–19,642, doi:10.1029/95JA01209.
Carr, M. H., and J. W. Head (2003), Oceans on Mars: An assessment of the observational evidence and possible fate, J. Geophys. Res.,
108(E5), 5042, doi:10.1029/2002JE001963.
Chamberlain, J. W. (1963), Planetary coronae and atmospheric evaporation, Planet. Space Sci., 11, 901–960, doi:10.1016/0032-0633(63)90122-3.
Chaufray, J. Y., J. L. Bertaux, F. Leblanc, and E. Quémerais (2008), Observation of the hydrogen corona with SPICAM on Mars Express,
Icarus, 195, 598–613, doi:10.1016/j.icarus.2008.01.009.
Clancy, R. T., A. W. Grossman, M. J. Wolff, P. B. James, D. J. Rudy, Y. N. Billawala, B. J. Sandor, S. W. Lee, and D. O. Muhleman (1996), Water vapor saturation at low altitudes around Mars aphelion: A key to Mars climate?, Icarus, 122, 36–62, doi:10.1006/icar.1996.0108. Clarke, J. T., J. Bertaux, J. Chaufray, R. Gladstone, E. Quemerais, and J. K. Wilson (2009), HST observations of the extended hydrogen
corona of Mars, in AAS/Division for Planetary Sciences Meeting Abstracts #41.
England, S. L., and R. J. Lillis (2012), On the nature of the variability of the Martian thermospheric mass density: Results from electron reflectometry with Mars Global Surveyor, J. Geophys. Res., 117, E02008, doi:10.1029/2011JE003998.
Feldman, P. D., et al. (2011), Rosetta-Alice observations of exospheric hydrogen and oxygen on Mars, Icarus, 214, 394–399, doi:10.1016/j.icarus.2011.06.013.
Forbes, J. M., F. G. Lemoine, S. L. Bruinsma, M. D. Smith, and X. Zhang (2008), Solar flux variability of Mars’ exosphere densities and temperatures, Geophys. Res. Lett., 35, L01201, doi:10.1029/2007GL031904.
Hunten, D. M. (1973), The escape of light gases from planetary atmospheres, J. Atmos. Sci., 30, 1481–1494, doi:10.1175/1520-0469(1973)030<1481:TEOLGF>2.0.CO;2.
Hunten, D. M., and M. B. McElroy (1970), Production and escape of hydrogen on Mars, J. Geophys. Res., 75, 5989–6001, doi:10.1029/ JA075i031p05989.
Jeans, J. (1925), The Dynamical Theory of Gases, Cambridge Univ. Press, England.
Krasnopolsky, V. A. (2002), Mars’ upper atmosphere and ionosphere at low, medium, and high solar activities: Implications for evolution of water, J. Geophys. Res., 107(E12), 5128, doi:10.1029/2001JE001809.
Krasnopolsky, V. A. (2010), Solar activity variations of thermospheric temperatures on Mars and a problem of CO in the lower atmosphere, Icarus, 207, 638–647, doi:10.1016/j.icarus.2009.12.036.
Krasnopolsky, V. A., and P. D. Feldman (2001), Detection of molecular hydrogen in the atmosphere of Mars, Science, 294, 1914–1917, doi:10.1126/science.1065569.
Acknowledgments
The authors wish to thank John Clarke, Justin Deighan, Roger Yelle, Dave Brain and two anonymous reviewers for valuable comments regarding the manuscript. This work was sup-ported by NASA Headquarters under the MAVEN mission and the NASA Earth and Space Science Fellowship Program—grant 11-Planet11F-0060. The Editor thanks two anonymous reviewers for their assistance in evaluating this paper.
Geophysical Research Letters
10.1002/2013GL058578
Lallement, R., J. L. Bertaux, and F. Dalaudier (1985), Interplanetary Lyman-alpha spectral profiles and intensities for both repulsive andattractive solar force fields: Predicted absorption pattern by a hydrogen cell, Astron. Astrophys., 150, 21–32.
Leblanc, F., J. Y. Chaufray, J. Lilensten, O. Witasse, and J.-L. Bertaux (2006), Martian dayglow as seen by the SPICAM UV spectrograph on Mars Express, J. Geophys. Res., 111, E09S11, doi:10.1029/2005JE002664.
Lichtenegger, H., H. Lammer, D. F. Vogl, and S. J. Bauer (2004), Possible temperature effects of energetic neutral hydrogen atoms on the Martian exosphere, Adv. Space Res., 33, 140–144, doi:10.1016/j.asr.2003.07.018.
Liemohn, M. W., A. Dupre, S. W. Bougher, M. Trantham, D. L. Mitchell, and M. D. Smith (2012), Time-history influence of global dust storms on the upper atmosphere at Mars, Geophys. Res. Lett., 39, L11201, doi:10.1029/2012GL051994.
Maltagliati, L., F. Montmessin, A. Fedorova, O. Korablev, F. Forget, and J.-L. Bertaux (2011), Evidence of water vapor in excess of saturation in the atmosphere of Mars, Science, 333, 1868–1871, doi:10.1126/science.1207957.
Maltagliati, L., F. Montmessin, O. Korablev, A. Fedorova, F. Forget, A. Määttänen, F. Lefèvre, and J.-L. Bertaux (2013), Annual survey of water vapor vertical distribution and water-aerosol coupling in the martian atmosphere observed by SPICAM/MEx solar occultations,
Icarus, 223, 942–962, doi:10.1016/j.icarus.2012.12.012.
McElroy, M. B., and T. M. Donahue (1972), Stability of the Martian atmosphere, Science, 177, 986–988, doi:10.1126/science.177.4053.986. Mitchell, D. L., R. P. Lin, C. Mazelle, H. Réme, P. A. Cloutier, J. E. P. Connerney, M. H. Acuña, and N. F. Ness (2001), Probing Mars’ crustal
mag-netic field and ionosphere with the MGS Electron Reflectometer, J. Geophys. Res., 106(E10), 23,419–23,427, doi:10.1029/2000JE001435. Nair, H., M. Allen, A. D. Anbar, Y. L. Yung, and R. T. Clancy (1994), A photochemical model of the Martian atmosphere, Icarus, 111, 124–150,
doi:10.1006/icar.1994.1137.
Parkinson, T. D., and D. M. Hunten (1972), Spectroscopy and acronomy of O2on Mars, J. Atmos. Sci., 29, 1380–1390, doi:10.1175/ 1520-0469(1972)029<1380:SAAOOO>2.0.CO;2.
Quémerais, E., V. Izmodenov, D. Koutroumpa, and Y. Malama (2008), Time dependent model of the interplanetary Lyman𝛼glow: Applications to the SWAN data, Astron. Astrophys., 488, 351–359, doi:10.1051/0004-6361:20078204.
Rottman, G. J., T. N. Woods, and W. McClintock (2006), SORCE solar UV irradiance results, Adv. Space Res., 37, 201–208, doi:10.1016/j.asr. 2005.02.072.
Smith, M. D. (2009), THEMIS observations of Mars aerosol optical depth from 2002–2008, Icarus, 202(2), 444–452, doi:10.1016/j.icarus. 2009.03.027.
Tucker, O. J., R. E. Johnson, J. I. Deighan, and A. N. Volkov (2013), Diffusion and thermal escape of H2from Titan’s atmosphere: Monte Carlo simulations, Icarus, 222, 149–158, doi:10.1016/j.icarus.2012.10.016.
Valeille, A., V. Tenishev, S. W. Bougher, M. R. Combi, and A. F. Nagy (2009), Three-dimensional study of Mars upper thermosphere/ ionosphere and hot oxygen corona: 1. General description and results at equinox for solar low conditions, J. Geophys. Res., 114, E11005, doi:10.1029/2009JE003388.
Withers, P., and R. Pratt (2013), An observational study of the response of the upper atmosphere of Mars to lower atmospheric dust storms, Icarus, 225, 378–389, doi:10.1016/j.icarus.2013.02.032.
Woods, T. N., F. G. Eparvier, S. M. Bailey, P. C. Chamberlin, J. Lean, G. J. Rottman, S. C. Solomon, W. K. Tobiska, and D. L. Woodraska (2005), Solar EUV Experiment (SEE): Mission overview and first results, J. Geophys. Res., 110, A01312, doi:10.1029/2004JA010765.
Zahnle, K., R. M. Haberle, D. C. Catling, and J. F. Kasting (2008), Photochemical instability of the ancient Martian atmosphere, J. Geophys.