HAL Id: hal-00304145
https://hal.archives-ouvertes.fr/hal-00304145
Submitted on 6 May 2008HAL is a multi-disciplinary open access
archive for the deposit and dissemination of sci-entific research documents, whether they are pub-lished or not. The documents may come from teaching and research institutions in France or abroad, or from public or private research centers.
L’archive ouverte pluridisciplinaire HAL, est destinée au dépôt et à la diffusion de documents scientifiques de niveau recherche, publiés ou non, émanant des établissements d’enseignement et de recherche français ou étrangers, des laboratoires publics ou privés.
Weekly patterns of México City’s surface concentrations
of CO, NOx, PM10 and O3 during 1986?2007
S. Stephens, S. Madronich, F. Wu, J. Olson, R. Ramos, A. Retama, R. Muñoz
To cite this version:
S. Stephens, S. Madronich, F. Wu, J. Olson, R. Ramos, et al.. Weekly patterns of México City’s surface concentrations of CO, NOx, PM10 and O3 during 1986?2007. Atmospheric Chemistry and Physics Discussions, European Geosciences Union, 2008, 8 (3), pp.8357-8384. �hal-00304145�
ACPD
8, 8357–8384, 2008Mexico City pollution weekend effect S. Stephens et al. Title Page Abstract Introduction Conclusions References Tables Figures ◭ ◮ ◭ ◮ Back Close
Full Screen / Esc
Printer-friendly Version
Interactive Discussion Atmos. Chem. Phys. Discuss., 8, 8357–8384, 2008
www.atmos-chem-phys-discuss.net/8/8357/2008/ © Author(s) 2008. This work is distributed under the Creative Commons Attribution 3.0 License.
Atmospheric Chemistry and Physics Discussions
Weekly patterns of M ´exico City’s surface
concentrations of CO, NO
x
, PM
10
and O
3
during 1986–2007
S. Stephens1, S. Madronich1, F. Wu1, J. Olson2, R. Ramos3, A. Retama4, and R. Mu ˜noz4
1
Atmospheric Chemistry Division, National Center for Atmospheric Research, Boulder, Colorado USA
2
TDA Research, Golden, Colorado USA
3
William J. Clinton Foundation, Clinton Climate Initiative, M ´exico D. F., M ´exico
4
Direcci ´on de Monitoreo Atmosf ´erico, Gobierno del Distrito Federal, M ´exico D. F., M ´exico Received: 28 March 2008 – Accepted: 2 April 2008 – Published: 6 May 2008
Correspondence to: S. Madronich ([email protected])
ACPD
8, 8357–8384, 2008Mexico City pollution weekend effect S. Stephens et al. Title Page Abstract Introduction Conclusions References Tables Figures ◭ ◮ ◭ ◮ Back Close
Full Screen / Esc
Printer-friendly Version
Interactive Discussion
Abstract
Surface pollutant concentrations in M ´exico City show a distinct pattern of weekly vari-ations similar to that observed in many other cities of the world. Measurements of the concentrations of carbon monoxide (CO), nitrogen oxides (NOx=NO+NO2), par-ticulate matter smaller than 10µm (PM10), and ozone (O3) collected hourly over 22
5
years (1986–2007) at 32 urban monitoring locations were analyzed. Morning concen-trations of CO, NOx, and PM10 are lower on Saturdays and even more so on Sundays, compared to workdays (Monday–Friday), while afternoon O3 concentrations change minimally and are occasionally even higher. This weekend effect is empirical evidence that photochemical O3production is NOx-inhibited, and to the extent that emissions of
10
CO are correlated with reactive volatile organic compounds (VOCs), it is VOC-limited, at least in the urban areas for which the monitoring stations are representative. The VOC-limitation has increased in the past decade, due to decreases in the concen-trations of CO (and presumably VOCs) and consequent decreases in the CO/NOxand VOC/NOxratios. Enhancements of photolysis frequencies resulting from smaller
week-15
end aerosol burdens are not negligible, but fall short of being an alternate explanation for the observed weekend effect. The strength of the weekend effect indicates that local radical termination occurs primarily via formation of nitric acid and other NOx-related compounds, some of which (e.g. peroxy acyl nitrates) can contribute to the regional NOxbudget. While VOC emission reductions would be most effective in reducing local
20
O3production, NOx emission reduction may be more important for controlling regional oxidants.
1 Introduction
The atmosphere of M ´exico City has received considerable scientific attention in recent years, foremost because of concerns about the potential health effects of air pollutants
25
represen-ACPD
8, 8357–8384, 2008Mexico City pollution weekend effect S. Stephens et al. Title Page Abstract Introduction Conclusions References Tables Figures ◭ ◮ ◭ ◮ Back Close
Full Screen / Esc
Printer-friendly Version
Interactive Discussion tative of current and future conditions in other megacities undergoing rapid economic
development. The city’s tropical high altitude location (19◦N, 2.2 km above sea level) is conducive to fast photochemistry forming secondary pollutants such as ozone (O3) and particulate matter (PM). Several intensive measurement campaigns have char-acterized the main aspects of the meteorology and chemical composition, including
5
MARI (LANL/IMP, 1994), IMADA/AVER (Doran et al., 1998), MCMA-2003 (Molina et al., 2007), and in 2006 MILAGRO (Molina et al., in preparation, 2008). An air qual-ity monitoring network was established in 1986, and has helped document long-term reductions of some pollutants following the institution of various emission-reduction programs (INE, 1998).
10
One of the issues most relevant to the design of emission reduction policies for urban areas is whether the formation of O3 is more sensitive to emissions of nitrogen oxides (NOx) or volatile organic compounds (VOCs). It is well known (e.g. Finlayson-Pitts and Pitts, 1986) that O3formation depends non-linearly on these emissions, and is maximal when VOC/NOx molar ratios are in the range of 5–15, the exact value depending on
15
various conditions. At higher VOC/NOxratios, O3production is limited by, and therefore sensitive to, the available NOx. At lower ratios it is limited by VOCs and, at sufficiently high NOx, even inhibited by any additional NOx(due to the reactions NO+O3→NO2+O2 and OH+NO2→HNO3). However, O3formation is also sensitive to other factors such as detailed VOC speciation and environmental conditions, so the direct measurement
20
of VOC/NOx ratios is insufficient to establish whether the chemical regime is VOC- or NOx-limited. Sillman (1995) proposed using several other concentration ratios as in-dicators of NOx or VOC sensitivity involving, in addition to O3, total reactive nitrogen (NOy), as well as photochemically-produced formaldehyde (CH2O), nitric acid (HNO3), and hydrogen peroxide (H2O2). Unfortunately these chemical species have not been
25
measured routinely in M ´exico City, and the few available measurements are too vari-able to assess spatially or temporally averaged sensitivities. Thus such assessments have been limited to modeling studies in which the emissions of VOCs and NOx were varied around central estimates and the response of O3concentrations was examined,
ACPD
8, 8357–8384, 2008Mexico City pollution weekend effect S. Stephens et al. Title Page Abstract Introduction Conclusions References Tables Figures ◭ ◮ ◭ ◮ Back Close
Full Screen / Esc
Printer-friendly Version
Interactive Discussion sometimes with conflicting results (West et al., 2004; Lei et al., 2007; Tie et al., 2007).
A more empirical assessment of the response of O3to emission changes is provided by the weekend-workday differences in the emissions of O3precursors, and the result-ing differences in O3concentrations. Generally, emissions of NOxand VOCs are lower on weekends, while in many locations (though not all) the weekend O3concentrations
5
are minimally lower, or even higher, than on workdays. Observations of this effect have been made at many locations throughout the world, e.g. for the US in New York and New Jersey (Cleveland et al., 1974; Bruntz et al., 1974), the Baltimore-Washington area (Lebron, 1975; Jacobson, 1975), Southern California (Blanchard and Tanenbaum, 2003; Fujita et al., 2003; Chinkin et al., 2003), Central California (Blanchard and Fairley,
10
2001; Marr and Harley, 2002; Murphy et al., 2007), Northern California (Altshuler et al., 1996), Atlanta, Chicago, and Philadelphia (Pun et al., 2003), and Phoenix (Atkinson-Palombo et al., 2006); in Canada near Vancouver (Pryor and Steyn, 1995) and Toronto (Beaney and Gough, 2002), Switzerland (Br ¨onnimann and Neu, 1997), France (Pont and Fontan, 2001), the UK (Jenkin et al., 2002), Greece (Riga-Karandinos et al., 2006),
15
and Nepal (Pudasainee et al., 2006). A weekend effect in the NO2column amount has also been detected by a satellite-based instrument over urban and industrial regions of the US, Europe, and Japan (Beirle et al., 2003). For M ´exico City, Mu ˜noz et al. (2007) have shown statistically significant variations in O3concentrations as a function of day of the week for the years 1990–2006.
20
Here, we examine for M ´exico City the weekly patterns over 22 years (1986–2007) of NOx, CO (as a proxy for VOCs), O3 and PM10 (since 1993) concentrations analyzed from surface measurements at 32 urban locations (see Sect. 2). The differences be-tween workdays (Monday-Friday) and weekends (Saturday and Sunday) are shown in Sect. 3, while Sect. 4 discusses possible reasons for these patterns in terms of our
25
understanding of the prevailing photochemical regime. The implications for urban and regional air quality are discussed in Sect. 5.
ACPD
8, 8357–8384, 2008Mexico City pollution weekend effect S. Stephens et al. Title Page Abstract Introduction Conclusions References Tables Figures ◭ ◮ ◭ ◮ Back Close
Full Screen / Esc
Printer-friendly Version
Interactive Discussion
2 Data availability and analysis
Continuous monitoring of air pollutants in M ´exico City began in 1986 with the establish-ment of several networks (INE, 1998), now numbering 39 stations, to measure surface concentrations of O3, NOx, NO2, CO, SO2, TSP, and PM10, and surface meteorology. Hourly data are archived by the Government of M ´exico City (SIMAT, 2007). The
perfor-5
mance of the air quality monitoring network has been reviewed periodically by the U.S. Environmental Protection Agency, and a recent report concluded that the monitoring system is overall accurate and well implemented (GDF, 2004). Here we use a subset of the data, specifically the concentrations of O3, NOx, CO, and PM10 from 32 stations (the other 7 had insufficient data records for our analysis). A data screening procedure
10
was implemented to eliminate possible values falling far outside realistic bounds. For NOx and O3, allowed values were between 2 ppb and 1 ppm, for CO between 10 ppb and 100 ppm, and for PM10 between 0.1 and 1000µg/m3. These wide ranges should not be construed as actual data ranges, but rather are merely additional steps to screen out possible artifacts.
15
The large record of surface measurements allows the analysis and interpretation of temporal patterns on many time scales, including daily, weekly, seasonal, and long-term variations. Some averaging was carried out to reduce the effects of temporal and spatial variability and thus to bring out the more persistent temporal patterns, as follows. Values from individual stations were averaged together by five city sectors (see SIMAT,
20
2007 for a map), specifically north-east (NE for stations ARA, CHA, LVI, NET, SAG, VIF, XAL), north-west (NW for ATI, AZC, CUI, EAC, IMP, TAC, TLA, TLI, VAL), south-west (SW for PED, PLA, SUR, TPN), south-east (SE for CES, COY, CHO, TAH, TAX, UIZ), and center (CT for BJU, CUA, HAN, LAG, MER, MIN). To represent each day by a single value, the average of the three highest values was taken, between 7 a.m. and
25
12 noon for CO, NOx, and PM10, and between 11 a.m. and 5 p.m. for O3. The intent of this averaging was to capture the bulk of the chemical precursors from the morning rush-hour and the resultant afternoon O3, rather than specific maxima or exceedances
ACPD
8, 8357–8384, 2008Mexico City pollution weekend effect S. Stephens et al. Title Page Abstract Introduction Conclusions References Tables Figures ◭ ◮ ◭ ◮ Back Close
Full Screen / Esc
Printer-friendly Version
Interactive Discussion of regulatory thresholds. For some considerations, values were also averaged over
three longer time periods, specifically 1986–1992, 1993–2000, and 2001–2007. In all cases, relative changes (percents) were calculated as the deviations between average absolute values, rather than as the average of relative changes between indi-vidual values. For example, the average difference (%) between Sunday and
Wednes-5
day O3values in 2007 was computed by calculating the 2007 average Wednesday O3, then the 2007 average Sunday O3, and finally computing the percent difference be-tween them (as opposed to computing the percent difference bebe-tween each Wednes-day and the previous or following SunWednes-day, and then averaging the percent differences over the entire year). This procedure reduces the influence of short-term fluctuations
10
in the weekend effect. Weekly patterns were also analyzed by Fourier multiple regres-sion with nine fitting coefficients (average plus sines and cosines with periods of 7, 7/2, 7/3, and 7/4 days). This yielded the amplitude (positive or negative) of the weekly pattern, and its relative size (percent) compared to the average. Standard deviations (1σ where shown) were estimated using bootstrap resampling with replacement (Efron
15
and Tibshirani, 1993).
3 Results
The diurnal cycles of CO, NOx, O3, and PM10 surface concentrations are shown in Fig. 1, averaged for all stations and all days over 2001–2007. For CO, NOx, and PM10 the maximum values occur during the morning rush hours, followed by a decrease in
20
the late morning due to lower emissions and the rapid growth of the planetary bound-ary layer (PBL) as recently reviewed by Shaw et al. (2007), a secondbound-ary maximum from the evening rush hours, and lower values at night due to decreased activity. The mid-day decreases are largest for NOxbecause of its short photochemical lifetime, and smallest for PM10, likely due to photochemical formation of secondary aerosols. The
25
weekend effect is evidenced by the smaller morning peaks on Saturday and Sunday, compared to workdays (Monday–Friday). Early afternoon values are similar on
work-ACPD
8, 8357–8384, 2008Mexico City pollution weekend effect S. Stephens et al. Title Page Abstract Introduction Conclusions References Tables Figures ◭ ◮ ◭ ◮ Back Close
Full Screen / Esc
Printer-friendly Version
Interactive Discussion days and Saturday but lower on Sundays. Increases in CO and NOx are seen in the
late evening on Friday and Saturday and persist into the early hours of the following day, as expected from increased weekend evening activities. Ozone shows a single maximum in the early afternoon stemming from its photochemical production, but a much smaller weekend effect, if any, with values on Saturday and Sunday as high as
5
those on workdays, and (as discussed below) occasionally even higher. The evenings of Friday and Saturday, and the early hours of the following day, are somewhat lower than on other nights, consistent with the higher NOxlevels and O3loss by the reaction NO+O3→NO2+O2. Also notable is the earlier rise in O3 concentrations on Sunday morning relative to other days, resulting from the earlier time that O3 concentrations
10
exceed those of NO, i.e. an earlier NO-O3cross-over as already seen in other studies, e.g., in Azusa, California (Lawson, 2003).
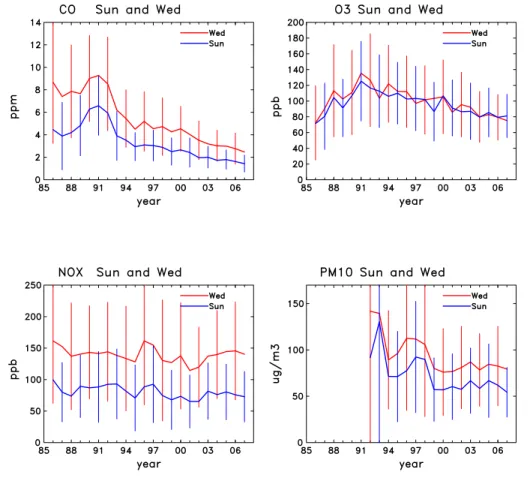
The long-term behavior is shown in Fig. 2, where the morning maxima in CO, NOx, and PM10, and the afternoon maximum in O3 are given for Wednesday and Sunday, averaged over all stations. Average CO values decreased sharply in the early 1990s
15
following the closing of a major industrial facility in the city, and continued to decline most likely due to reductions in traffic-related emissions (Molina and Molina, 2002). NOx and PM10 values have decreased some since the beginning of the record but show little or no change in the last decade. Ozone values peaked in the early 1990s and continue to decrease. Lower values are seen on Sunday relative to Wednesday
20
for CO, NOx, and PM10, but not for O3. Table 1 compares the workday averages with Saturday and Sunday values. For CO, NOx, and PM10, Saturday values generally fall between the workday and Sunday values, while for O3they are frequently highest (on 9 out of the 22 years). Workday O3 was higher than either on Saturday or Sunday for only 5 of the years, and not since 1994.
25
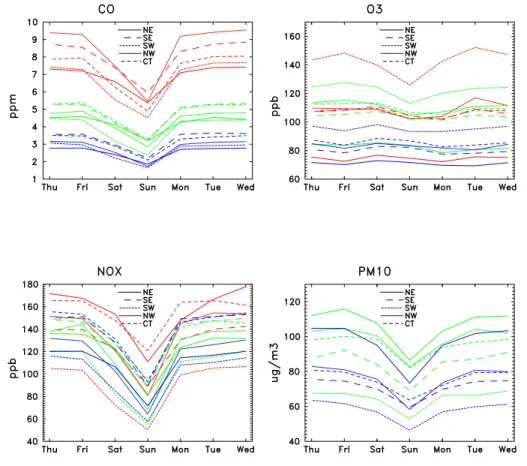
The detailed weekly patterns are shown in Fig. 3, averaged separately for each city sector (CT, NE, NW, SW, SE) over 1986–1992, 1993–2000, and 2001–2007. Consider-able variation is noted by sector, even for the same years. Nevertheless, values of CO, NOx, and PM10are consistently lower on Saturday and more so on Sunday, compared
ACPD
8, 8357–8384, 2008Mexico City pollution weekend effect S. Stephens et al. Title Page Abstract Introduction Conclusions References Tables Figures ◭ ◮ ◭ ◮ Back Close
Full Screen / Esc
Printer-friendly Version
Interactive Discussion to the other days of the week, while for O3 no such reductions are seen in the most
recent data, and only in the SW sector during the earlier years. Variations between workdays are much less prominent, with some indication of increases of CO, NOx, and PM10in the early part of the week (Monday to Thursday) but with considerable variabil-ity, in agreement with meteorological studies that indicated nearly complete ventilation
5
of the basin on a daily basis, with little day-to-day accumulation of pollutants (e.g., Fast and Zhong, 1998; deFoy et al., 2007).
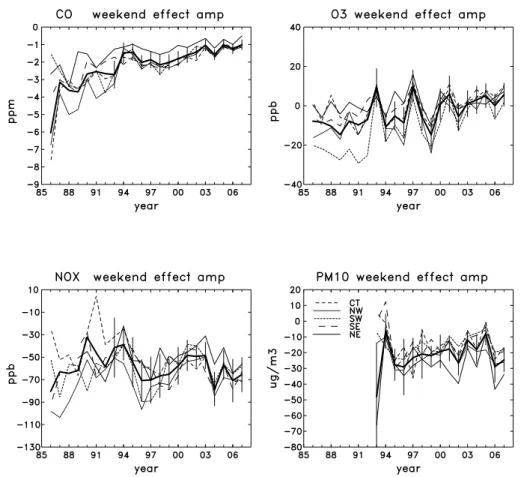
The amplitudes of the weekend effect, derived from the data shown in Fig. 3 using the harmonic regression described in Sect. 2, are shown in Figs. 4 and 5. For CO, the amplitude (ppm) has decreased in approximate proportion to the decrease in average
10
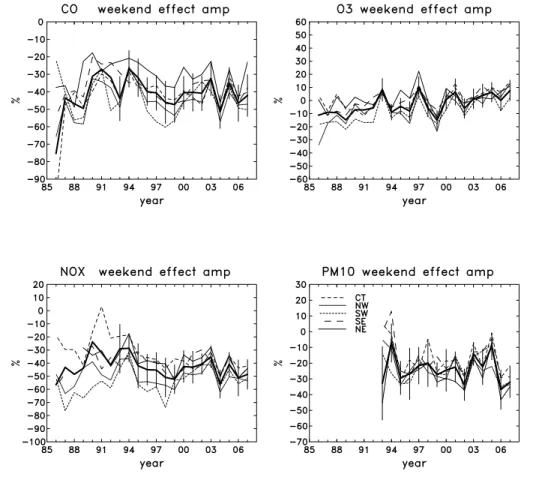
concentrations (see Fig. 2), so that on a relative basis (%) the weekend reductions have remained relatively constant at 40–50%. Relative reductions in NOx have also remained relatively constant, ranging between 40 and 60% in the last decade, while the PM10 weekend effect amplitude is variable between 10 and 40%. In contrast, the O3 weekend effect amplitude shows a positive trend, with values in the –20 to 0%
15
range in the late 1980s, increasing to 0 to +10% in the last few years. This long-term positive trend for O3, coupled with the relative constancy of NOx, CO, and PM10relative weekend effect, has important implications for understanding the VOC-NOx-UV regime of M ´exico City’s photochemistry, as will be discussed below. Some variations between the different urban sectors are seen in Figs. 4 and 5 but the qualitative features of the
20
weekend effect are present in all sectors and are quantitatively more similar in recent years.
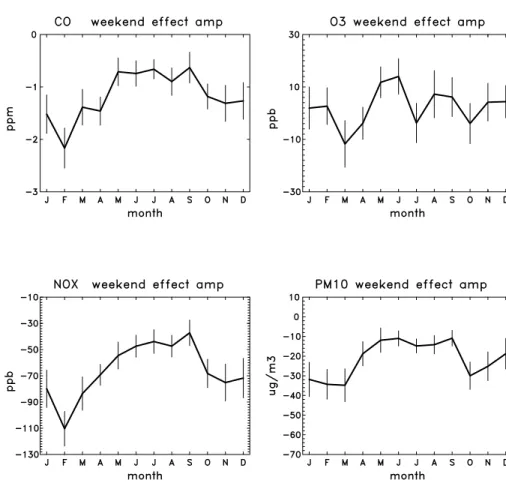
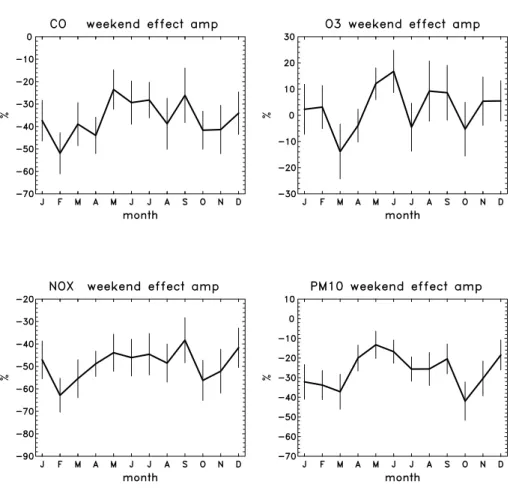
The seasonal behavior of the weekend effect amplitudes is shown in Figs. 6–7. For CO, NOx, and PM10 the amplitudes are more negative during the dry season (November–March) with the exception of December which is likely influenced by
hol-25
iday activities. The less negative absolute amplitudes during the wet season (May– September) are easily understood in terms of convective ventilation and wet removal leading to generally lower levels of pollutants, but the reasons for reductions in rela-tive (%) amplitudes are less clear. The O3 concentrations show no obvious seasonal
ACPD
8, 8357–8384, 2008Mexico City pollution weekend effect S. Stephens et al. Title Page Abstract Introduction Conclusions References Tables Figures ◭ ◮ ◭ ◮ Back Close
Full Screen / Esc
Printer-friendly Version
Interactive Discussion patterns in either absolute or relative amplitudes.
4 Discussion
M ´exico City’s surface observations show a definite pattern over weekly periods: CO, NOx, and PM10morning concentrations are smaller on weekends relative to workdays, by ca. 40–50%, 40–60%, and 10–40%, respectively; O3afternoon weekend
concentra-5
tions are not much smaller, and are sometimes even larger, than the workday values, with differences increasing from –20 to 0% in the late 1980s, to 0 to +10% in the past decade. These observations of the weekend effect offer the opportunity to better un-derstand the chemical regime responsible for the formation of O3. The central issue is to explain why O3concentrations remain relatively unchanged on weekends, relative to
10
workdays, when precursor emissions are considerably lower. Lawson (2003) summa-rized the possible reasons in terms of six hypotheses: (1) Lower weekend NOx emis-sions, leading to less NOx inhibition of O3 formation if under VOC-limited conditions, (2) later timing of NOxemissions on weekends, (3) carryover of previous day pollutants at the surface, (4) carryover of previous day pollutants aloft, (5) higher weekend VOC
15
emissions, and (6) higher weekend photolysis frequencies due to less aerosol.
The first hypothesis, that workday O3 production in M ´exico City is VOC-limited and NOx-inhibited, appears to be the most plausible explanation for the observed weekend effect. It is important to note that direct VOC measurements were not used in our analysis. Such measurements for M ´exico City are relatively sparse and from only a
20
few locations (e.g. Blake and Rowland, 1995; Velasco et al., 2007). The spatial and temporal variability of the weekend effect is rather large even within the much more comprehensive CO data set (e.g. Fig. 3), and would be much more difficult to quantify with the limited available VOC record. On the other hand, VOCs are several times more reactive (with respect to OH radicals) than CO in M ´exico City (see, for example, Fig. 3
25
of Madronich, 2006), so an open issue is whether variations in CO can be used as a proxy for variations in VOC reactivity. Some support for this comes from observations of robust CO vs. VOC correlations during the MILAGRO field campaign (deGouw et al., in
ACPD
8, 8357–8384, 2008Mexico City pollution weekend effect S. Stephens et al. Title Page Abstract Introduction Conclusions References Tables Figures ◭ ◮ ◭ ◮ Back Close
Full Screen / Esc
Printer-friendly Version
Interactive Discussion prep., 2008), as well as measurements in Southern California showing similar relative
workday to Sunday reductions by 16–30% for VOCs and 12–32% for CO (Lawson, 2003). Thus, it is highly likely that the observed weekend CO reduction in M ´exico City was accompanied by roughly proportional reductions in VOC reactivity. The sensitivity of O3 production to VOC changes is always positive (albeit small at low NOx), while
5
it can be either positive or negative with respect to NOx changes, the negative values representing NOxinhibition of O3production in the VOC-limited regime (e.g. Kleinman, 2005). In this regime, hypothetical reductions in only VOC emissions would lead to lower O3, while equally hypothetical reductions in only NOx emissions would lead to higher O3. The near equality of workday and weekend O3then most likely arises from
10
the simultaneous decreases in VOC and NOx emissions and their opposing effects on the O3 production rates. For this reason, it can be concluded that workday O3 production in M ´exico City appears to be VOC-limited.
The other hypotheses (2–6) for explaining the weekend effect are not supported by the observations. Timing of the NOx emissions (hypothesis 2) is not very different on
15
weekend mornings than on workdays (see Fig. 1). Similarly, Marr and Harley (2002) showed that change in timing of emissions is only a minor contributor to the weekend effect in Central California. Carryover of pollutants from the previous day (hypotheses 3 and 4) is small, as can be seen in Fig. 3, consistently with meteorological studies suggesting nearly complete daily ventilation of the basin (e.g. deFoy et al., 2007). The
20
possibility of higher weekend VOC emissions (hypothesis 5) has been examined for California where outdoor cooking and lawn mowing are common weekend activities, but even there it was not supported by detailed emissions inventories (Chinkin et al., 2003); it seems equally unlikely for M ´exico City given the large weekend decrease in CO. The workday to weekend increase in photolysis frequencies (hypothesis 6), owing
25
to the heavier workday aerosol loading, merits some consideration. Castro et al. (2001) showed that surface NO2 photolysis frequencies (JNO2) were reduced in M ´exico City by 20–30% compared to outside the city, and more recent measurements during the MILAGRO campaign show comparable reductions in actinic fluxes at ultraviolet
wave-ACPD
8, 8357–8384, 2008Mexico City pollution weekend effect S. Stephens et al. Title Page Abstract Introduction Conclusions References Tables Figures ◭ ◮ ◭ ◮ Back Close
Full Screen / Esc
Printer-friendly Version
Interactive Discussion lengths (Madronich et al., in prep., 2008). Weekend reductions in PM10 are seen to
be in the range 10–40% (Fig. 3), which if applied to theJNO2 reductions found by Cas-tro et al. give an outside range of weekend enhancement of photolysis rates between 2% and 12% at the surface. Vertically averaged values in the PBL would be expected to be somewhat smaller, so that the resulting enhancement in O3 production is small
5
although not negligible.
We consider briefly whether the observed weekend changes in CO, NOx, and O3 are consistent with current photochemical understanding. Kleinman (2005) has shown that the instantaneous O3 production rate, PO3, is related to instantaneous NOx and reactivity weighted hydrocarbon (or VOC) concentrations and the radical production
10
rateQ by:
dl nPO3/dl n[NOx] = [1 − (3/2)LN/Q]/[1 − (LN/Q)/2] (1)
dl nPO3/dl n[VOC] = [(1/2)LN/Q]/[1 − (LN/Q)/2] (2)
dl nPO3/dl n Q = (1/2)/[1 − (LN/Q)/2] (3)
where LN is the radical loss due to NOx chemistry (e.g. OH+NO2→HNO3, and
re-15
actions of organic peroxy radicals with NO to form organic nitrates) rather than other processes (e.g. formation of peroxides at low NOx). Because radical lifetimes are short, the radical production rateQ is essentially equal to the total radical loss, so that the ratio LN/Q is the fraction of the radical loss that occurs via NOxchemistry, with values larger than 0.5 for VOC-limited conditions, and smaller than 0.5 for NOx-limited conditions.
20
Furthermore, the radical production rateQ is proportional to photolysis frequencies J
(e.g.,JNO2), as these initiate photochemistry by fragmenting relatively stable molecules into highly reactive fragments. With the simplified notation
δX ≡ dl n[X ] = relative (percent) change in X (e.g. X = [O3], [NOx], [CO], Q) (4) the change in O3concentration can be expanded as:
ACPD
8, 8357–8384, 2008Mexico City pollution weekend effect S. Stephens et al. Title Page Abstract Introduction Conclusions References Tables Figures ◭ ◮ ◭ ◮ Back Close
Full Screen / Esc
Printer-friendly Version
Interactive Discussion
δPO3 ∼ (δPO3/δNOx)δNOx+ (δPO3/δVOC)δVOC + (δPO3/δQ)δQ
∼ [(2 − 3LN/Q) δNOx+ (LN/Q) δVOC + δQ]/[2 − (LN/Q)] (5)
where in the last equation Eqs. 1–3 for the sensitivity to NO, VOCs, andQ were used.
This equation can be solved forLN/Q:
LN/Q = (2δPO3− 2δNOx− δQ)/(δPO3 + δVOC − 3δNOx) (6)
5
The terms on the right hand side can be estimated from the weekend effect with some additional approximations. First, we assume that the weekend effect for the instantaneous O3 production, δPO3, is reflected to first order in the build-up of the afternoon O3 concentrations considered here, so that δPO3∼δO3. Second, and as already discussed above, we assume that the weekend effect for VOC reactivity is
10
similar to that for CO,δVOC∼δCO. Finally, we assume that the change in the radical
production rate is due mostly to changes in photolysis frequencies, so thatδQ∼δJ. On
this last point, we note thatδQ also depends on the availability of photo-labile species,
such as O3, CH2O, and HONO, which however are not likely to be larger on weekends, so δJ is probably an upper limit to δ Q. With these approximations, Eq. (6) can be
15
rewritten as:
LN/Q = (2δO3− 2δNOx− δJ )/(δO3+ δCO − 3δNOx) (7) The algebraic form of Eq. (7) permits any negative or positive value of LN/Q (from
–∞ to +∞) for independently selected combinations of δCO, δNOx, δJ, and δO3. However, the photochemical interpretation ofLN/Q, as the fraction of radical
termina-20
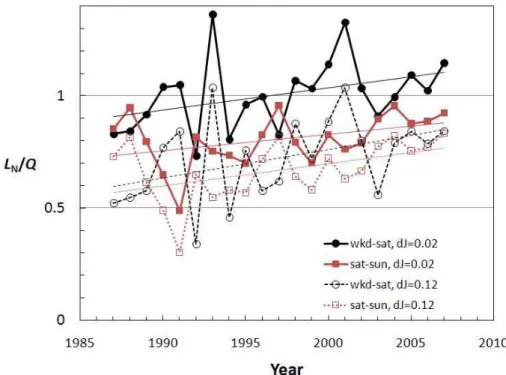
tion effected by NOxchemistry, limits its possible values to the range 0–1. The question then is whether the observed weekend effect values of δCO, δNOx,δJ, and δO3 are consistent with this chemical interpretation. Figure 8 shows the LN/Q values
calcu-lated from the observed CO, NOx, and O3 (taken from Table 1) for workday-Saturday (circles) and Saturday–Sunday (squares), with assumed values for δJ of 0.02 (filled
ACPD
8, 8357–8384, 2008Mexico City pollution weekend effect S. Stephens et al. Title Page Abstract Introduction Conclusions References Tables Figures ◭ ◮ ◭ ◮ Back Close
Full Screen / Esc
Printer-friendly Version
Interactive Discussion symbols) or 0.12 (open symbols) to bracket the weekend enhancement of photolysis
rates estimated from PM10 changes, as discussed above. The values are rather scat-tered but clearly fall near or within the chemically permissible range (except for 1986, not shown in the figure, where values as high as ∼2.7 were obtained, probably be-cause of relatively few data in the first year of the network). Moreover, theLN/Q values
5
are generally between 0.5 and 1.0 as expected for a VOC-limited regime; the workday-Saturday values are somewhat higher that workday-Saturday-Sunday values as expected from more intense NOx inhibition on workdays; and a slight upward trend inLN/Q is seen,
especially for the last decade, as expected from the decreasing trend in concentrations of CO (and presumably VOCs). However, such temporal variations should be viewed
10
with caution, because the uncertainty in LN/Q is about ±30%, as estimated by error
propagation in quadrature through Eq. (7) of the standard deviations in δCO, δNOx, andδO3(ca. 10%, 10%, and 7%, respectively, from Fig. 5).
The effect of photolysis frequencies on LN/Q is also shown in Fig. 8. The net
pro-duction of O3 is photon-limited in all but the most pristine parts of the troposphere.
15
Weekend enhancements inJ-values can provide a partial explanation for the
persis-tence of high O3values, as less change in NOx inhibition of O3 production is needed to explain the observations, leading to smaller values of LN/Q as seen in the figure.
The values ofLN/Q do remain mostly in the VOC-limited regime (>0.5) even with the
maximum estimated enhancement inJ-values (12% workdays to Saturday, plus 12%
20
Saturday to Sunday). However, the sensitivity to changes inJ-values is seen to be
significant, and emphasizes the need for accurate long-term observations of the urban ultraviolet environment.
Overall, the analysis of the weekend effect provides observation-based evidence that the production of O3 in M ´exico City is VOC-limited and NOx-inhibited. This is
25
particularly clear for workdays, as reflected in high LN/Q values for the
workday-to-Saturday changes. Whether the NOxinhibition also persists on Sundays is less clear, and we note that early afternoon NOx values are significantly lower on Sundays (see Fig. 1), but not on Saturdays, relative to workdays. Since early afternoon NOxis mostly
ACPD
8, 8357–8384, 2008Mexico City pollution weekend effect S. Stephens et al. Title Page Abstract Introduction Conclusions References Tables Figures ◭ ◮ ◭ ◮ Back Close
Full Screen / Esc
Printer-friendly Version
Interactive Discussion NO2, the Sunday reductions in NOx imply that total Ox (=O3+NO2) is lower than on
workdays and Saturdays, even with O3 relatively unchanged. Therefore Sunday’s Ox concentrations may be both VOC and NOx-sensitive.
One possible confounding factor is that NOx and VOC emissions in one part of the city may be transported over a few hours by urban scale circulations to produce high O3
5
concentrations in other parts of the city, under some specific meteorological conditions as noted by de Foy et al. (2005). Our use of city-wide averages evidently smoothes over such spatial variations, and in any case the weekend effect was noted to be qualita-tively similar in all city sectors (see Figs. 3 and 4), so it is unlikely that such circulations would alter our conclusion about VOC-limitation. Another interesting result is the
de-10
tection of a long-term positive trend in the O3 weekend effect, while the CO and NOx weekend fractional reductions have remained essentially constant (see Fig. 4 for con-centrations, or Fig. 8 forLN/Q). This is associated with the long-term decrease in CO
concentrations, presumably correlated with decreases in VOC concentrations, while NOx concentrations have remained largely unchanged. A decrease in the VOC/NOx
15
ratio implies a shift toward more VOC-limited conditions over the decades examined here. Earlier modeling studies using three-dimensional chemistry-transport models (CTMs) suggested a NOx-limited regime (Molina and Molina, 2002; West et al., 2004), while more recent CTM studies indicated a VOC-limited regime (Tie et al., 2007; Lei et al., 2007). It has been so far unclear whether this discrepancy is due to improvements
20
in the models, or to changes in the actual emissions. Our observation of a long term positive trend in the O3 weekend effect provide at least a partial explanation for the different modeling results, suggesting a more VOC-limited regime for the recent years. It should be cautioned, however, that our use of CO as a proxy for VOC reactivity may be less valid over very long time periods, because of possible long-term changes in the
25
ACPD
8, 8357–8384, 2008Mexico City pollution weekend effect S. Stephens et al. Title Page Abstract Introduction Conclusions References Tables Figures ◭ ◮ ◭ ◮ Back Close
Full Screen / Esc
Printer-friendly Version
Interactive Discussion
5 Conclusions
M ´exico City experiences a weekend effect in its air quality similar to that found in many cities around the world: Although concentrations of O3precursors NOx, CO, and (pre-sumably) VOCs are significantly lower on Saturday and even more so on Sunday com-pared to workdays, the concentrations of O3change only minimally, and in some cases
5
are even larger. This effect has become more pronounced in recent years because of significant emission reductions of CO and VOCs but relatively steady NOx emissions. The observed weekend effect is consistent with a VOC-limited, NOx-inhibited chemical regime for O3 production during workdays. In this regime, any magnitude of reduc-tion in VOC emissions would contribute to lowering ambient O3 concentrations, while
10
only large reductions in NOx emissions would prove effective, with smaller incremen-tal reductions being ineffective and possibly even detrimenincremen-tal by increasing local O3 production, depending on specific location and time.
There are of course many other reasons for reducing NOx emissions. NO2 is per se an important pollutant, and many nitrogen-containing compounds formed in the
at-15
mosphere are noxious, e.g. nitric acid, peroxy acyl nitrates (PANs), and nitro-cresols. Furthermore, the NOxinhibition of O3production is likely temporary, and by slowing the oxidative reactivity it allows more yet-to-be-reacted O3precursors to be exported from the city to the regional scale, including slower-reacting hydrocarbons and partly oxy-genated VOCs. Many organic nitrogen species (e.g., alkyl nitrates and PANs) formed
20
in the urban atmosphere have relatively long lifetimes and can, through later thermal or photolytic decomposition, be an important source of NOx to the regional and global atmosphere where O3production is generally NOx-limited.
This analysis was confined to the urban network of monitoring stations for which long term measurements are available, and is therefore only valid for the geographic area
25
which these stations represent. Over the past two decades, urban expansion beyond the monitored area and suburban development make it important to understand at which point the chemical regime transitions from VOC-limited to NOx-limited. While
ACPD
8, 8357–8384, 2008Mexico City pollution weekend effect S. Stephens et al. Title Page Abstract Introduction Conclusions References Tables Figures ◭ ◮ ◭ ◮ Back Close
Full Screen / Esc
Printer-friendly Version
Interactive Discussion this can be achieved by expansion of the long-term monitoring network, it can also be
addressed by improved numerical models that have been evaluated with observations in both urban and regional chemical regimes.
Acknowledgements. We thank J. Orlando, G. Pfister, and R. Volkamer for useful comments.
The National Center for Atmospheric Research is operated by the University Corporation for
5
Atmospheric Research under sponsorship from the National Science Foundation.
References
Altshuler, S. L., Arcado, T. D., and Lawson, D. R.: Weekday versus weekend ambient ozone concentrations: Discussion and hypotheses with focus on Northern California, J. Air and Waste Manage. Assoc., 45, 967–972, 1995.
10
Atkinson-Palombo C. M., Miller, J. A., and Balling, Jr., R. C.: Quantifying the ozone “weekend effect” at various locations in Phoenix, Arizona, Atmos. Environ., 40(39), 7644–7658, 2006. Beaney, G. and Gough, W. A.: The influence of tropospheric ozone on the air temperature of
the city of Toronto, Ontario, Canada, Atmos. Environ., 36, 2319–2325, 2002.
Beirle, S., Platt, U., Wenig, M., and Wagner, T.: Weekly cycle of NO2by GOME measurements:
15
a signature of anthropogenic sources, Atmos. Chem. Phys., 3, 2225–2232, 2003,
http://www.atmos-chem-phys.net/3/2225/2003/.
Blake, D. and Rowland, S.: Urban leakage of liquefied petroleum gas and its impact on M ´exico City air quality, Science, 269, 953–956, 1995.
Blanchard, C. L. and Fairley, D.: Spatial mapping of VOC and NOx-limitation of ozone formation
20
in central California, Atmos. Environ., 35, 3861–3873, 2001.
Blanchard, C. L. and Tanenbaum, S. J.: Differences between weekday and weekend air pollu-tant levels in Southern California, J. Air and Waste Manage. Assoc., 53, 816–828, 2003. Br ¨onnimann, S. and Neu, U.: Weekend-weekday differences of near-surface ozone
concentra-tions in Switzerland for different meteorological condiconcentra-tions, Atmos. Environ., 31, 1127–1135,
25
1997.
Bruntz, S. M., Cleveland, W. S., Graedel, T. E., Kleiner, B., and Warner, J. L.: Ozone concen-trations in New Jersey and New York: statistical association with related variables, Science, 186, 257–259, 1974.
ACPD
8, 8357–8384, 2008Mexico City pollution weekend effect S. Stephens et al. Title Page Abstract Introduction Conclusions References Tables Figures ◭ ◮ ◭ ◮ Back Close
Full Screen / Esc
Printer-friendly Version
Interactive Discussion
Chinkin, L. R., Coe, D. L., Funk, T. H., Hafner, H. H., Roberts, P. T., Ryan, P. A., and Lawson, D. R.: Weekday versus weekend activity patterns for ozone precursor emissions in California’s South Coast Air Basin, J. Air & Waste Manage. Assoc., 53, 829–843, 2003.
Cleveland, W. S., Graedel, T. E., Kleiner, B., and Warner, J. L.: Sunday and workday variations in photochemical air pollutants in New Jersey and New York, Science, 186, 1037–1038,
5
1974.
de Foy, B., Caetano, E., Maga ˜na, V., Zit ´acuaro, A., C ´ardenas, B., Retama, A., Ramos, R., Molina, L. T., and Molina, M. J.: Mexico City basin wind circulation during the MCMA-2003 field campaign, Atmos. Chem. Phys., 5, 2267–2288, 2005.
de Foy, B., Fast, J. D., Paech, S. J., Phillips, D., Walters, J. T., Coulter, R. L., Martin, T. J.,
10
Pekour, M. S., Shaw, W. J., Kastendeuch, P. P., Marley, N. A., Retama, A., and Molina, L. T.: Basin-scale wind transport during the MILAGRO field campaign and comparison to climatology using cluster analysis, Atmos. Chem. Phys. Discuss., 7, 13035–13076, 2007. Doran, J. C., Abbott, S., Archuleta, J., Bian, X., Chow, J., Coulter, R. L., de Wekker, S. F. J.,
Edgerton, S., Elliott, S., Fernandez, A., Fast, J. D., Hubbe, J. M., King, C., Langley, D., Leach,
15
J., Lee, J. T., Martin, T. J., Martinez, D., Martinez, J. L., Mercado, G., Mora, V., Mulhearn, M., Pena, J. L., Petty, R., Porch, W., Russell, C., Salas, R., Shannon, J. D., Shaw, W. J., Sosa, G., Tellier, L., Templeman, B., Watson, J. G., White, R., Whiteman, C. D., and Wolfe, D.: The IMADA-AVER boundary layer experiment in the Mexico City area, B. Am. Meteor. Soc., 79, 2497–2508, 1998.
20
Efron, B. and Tibshirani, R. J.: An Introduction to the Bootstrap, Chapman & Hall, New York, 1993.
Fast, J. D. and Zhong, S. Y.: Meteorological factors associated with inhomogeneous ozone concentrations within the M ´exico City basin, J. Geophys. Res., 103, 18927–18946, 1998. Finlayson-Pitts, B. and Pitts, Jr., J. N.: Atmospheric Chemistry, Wiley-Interscience, New York,
25
1986.
Fujita, E. M., Stockwell, W. R.,Campbell, D. E., Keislar, R. E., and Lawson, D. R.: Evolution of the magnitude and spatial extent of the weekend ozone effect in California’s South Coast Air Basin, 1981–2000, J. Air and Waste Manage. Assoc., 53, 802–815, 2003.
GDF: Gobierno del Distrito Federal, Report from the Performance Audit of the Mexico City
30
Ambient Air Monitoring Network (English version), M ´exico City, March 2004.
INE (Instituto Nacional de Ecologia): Segundo Informe sobre la Calidad del Aire en Ciudades Mexicanas – 1997, M ´exico City, 1998.
ACPD
8, 8357–8384, 2008Mexico City pollution weekend effect S. Stephens et al. Title Page Abstract Introduction Conclusions References Tables Figures ◭ ◮ ◭ ◮ Back Close
Full Screen / Esc
Printer-friendly Version
Interactive Discussion
Jacobson, J. S.: Comparison of weekend-weekday ozone and hydrocarbon concentrations in Baltimore-Washington metropolitan area, Atmos. Environ., 9, 1040–1040, 1975.
Jenkin, M. W., Davies, T. J., and Stedman, J. R.: The origin and day-of-week dependence of photochemical ozone episodes in the UK, Atmos. Environ., 36, 999–1012, 2002.
Kleinman, L. I.: The dependence of tropospheric ozone production rate on ozone precursors,
5
Atmos. Environ., 39, 575–586, 2005.
Lawson, D. R.: The weekend ozone effect – the weekly ambient emissions control experiment, Environ. Management, 17–25 July, 2003.
Lebron, F.: A comparison of weekend-weekday ozone and hydrocarbon concentrations in the Baltimore-Washington metropolitan area, Atmos. Environ., 9, 861–863, 1975.
10
Lei, W., de Foy, B., Zavala, M., Volkamer, R., and Molina, L. T.: Characterizing ozone production in the M ´exico City Metropolitan Area: a case study using a chemical transport model, Atmos. Chem. Phys., 7, 1347–1366, 2007,http://www.atmos-chem-phys.net/7/1347/2007/.
Madronich, S.: Chemical evolution of gaseous air pollutants down-wind of tropical megacities: M ´exico City case study, Atmos. Environ., 40, 6012–6018, 2006.
15
Marr, L. C. and Harley, R. A.: Modeling the effect of weekday-weekend differences in motor vehicle emissions on photochemical air pollution in Central California, Environ. Sci. Technol. 36, 4099–4106, 2002.
Molina, L. T. and Molina, M. J.: Air Quality the M ´exico Megacity: An Integrated Assessment, Kluwer, Boston, pp. 384, 2002.
20
Molina, L. T., Kolb, C. E., de Foy, B., Lamb, B. K., Brune, W. H., Jimenez, J. L., Ramos-Villegas, R., Sarmiento, J., Paramo-Figueroa, V. H., Cardenas, B., Gutierrez-Avedoy, V., and Molina, M. J.: Air quality in North America’s most populous city – overview of the MCMA-2003 campaign, Atmos. Chem. Phys., 7, 2447–2473, 2007.
Mu ˜noz, R., Granados, M., and del Carmen, M.: Analisis del comportamiento semanal del
25
ozono en la zona metropolitana del Valle de M ´exico en el periodo 1990–2006, Serie de An ´alisis del Sistema de Monitoreo Atmosf ´erico de la Ciudad de M ´exico, Secretar´ıa del Medio Ambiente, M ´exico City, May 2007 (http://www.sma.df.gob.mx/simat).
Murphy, J. G., Day, D. A., Cleary, P. A., Woolridge, P. J., Millet, D. B., Goldstein, A. H., and Co-hen, R. C.: The weekend effect within and downwind of Sacramento - Part 1: Observations
30
of ozone, nitrogen oxides, and VOC reactivity, Atmos. Chem. Phys., 7, 5327–5339, 2007,
http://www.atmos-chem-phys.net/7/5327/2007/.
ACPD
8, 8357–8384, 2008Mexico City pollution weekend effect S. Stephens et al. Title Page Abstract Introduction Conclusions References Tables Figures ◭ ◮ ◭ ◮ Back Close
Full Screen / Esc
Printer-friendly Version
Interactive Discussion
large cities in France, Atmos. Environ., 35, 1527–1535, 2001.
Pryor, S. C. and Steyn, D. G.: Hebdomadal and diurnal cycles in ozone time series from the Lower Fraser Valley, B.C., Atmos. Environ., 29, 1007–1019, 1995.
Pudasainee, D., Sapkota, B., Shrestha, M. L., Kaga, A., Kondo, A., and Inoue, Y.: Ground level ozone concentrations and its association with NOx and meteorological parameters in
5
Kathmandu valley, Nepal, Atmos. Environ., 40, 8081–8087, 2006.
Pun, B. K., Seigneur, C., and White, W.: Day-of-the-week behavior of atmospheric ozone in three US cities; J. Air and Waste Manage. Assoc., 53, 789–801, 2003.
Riga-Karandinos, A. N., Saitanis, C., and Arapis, G.: Study of the weekday-weekend variation of air pollutants in a typical Mediterranean coastal town, Int. J. of Environ. and Poll., 27,
10
300–312, 2006.
Shaw, W. J., Pekour, M. S., Coulter, R. L., Martin, T. J., and Walters, J. T.: The daytime mix-ing layer observed by radiosonde, profiler, and lidar durmix-ing MILAGRO, Atmos. Chem. Phys. Discuss., 7, 15025–15065, 2007,http://www.atmos-chem-phys-discuss.net/7/15025/2007/. Sillman, S.: The use of NOy, H2O2, and HNO3as indicators for ozone-NOx-hydrocarbon
sensi-15
tivity in urban locations, J. Geophys. Res., 100, 14175–14188, 1995.
SIMAT: Sistema de Monitoreo Atmosf ´erico de la Ciudad de M ´exico,http://www.sma.df.gob.mx/, data downloaded in January 2008.
Tie, X., Madronich, S., Li, G., Ying, Z., Zhang, R., Garcia, A., Lee-Taylor, J. and Liu, Y.: Charac-terization of chemical oxidants in M ´exico City: A regional chemical dynamical model
(WRF-20
Chem) study, Atmos. Environ., 41, 1989–2008, 2007.
Velasco, E., Lamb, B., Westberg, H., Allwine, E., Sosa, G., Arriaga-Colina, J. L., Jobson, B. T., Alexander, M. L., Prazeller, P., Knighton, W. B., Rogers, T. M., Grutter, M., Herndon, S. C., Kolb, C. E., Zavala, M., de Foy, B., Volkamer, R., Molina, L. T., and Molina, M. J.: Distribution, magnitudes, reactivities, ratios and diurnal patterns of volatile organic compounds in the
25
Valley of M ´exico during the MCMA 2002 and 2003 field campaigns, Atmos. Chem. Phys., 7, 329–353, 2007.
West, J. J., Zavala, M. A., Molina, L. T., Molina, M. J., San Martini, F., McRae, G. J., Sosa-Iglesias, G., and Arriaga-Colina, J. L., Modeling ozone photochemistry and evaluation of hydrocarbon emissions in the M ´exico City metropolitan area, J. Geophys. Res., 109, D19312,
30
ACPD
8, 8357–8384, 2008Mexico City pollution weekend effect S. Stephens et al. Title Page Abstract Introduction Conclusions References Tables Figures ◭ ◮ ◭ ◮ Back Close
Full Screen / Esc
Printer-friendly Version
Interactive Discussion
Table 1. Concentrations of CO, O3, NOx, and PM10in M ´exico City on workdays (M-F), Saturday (Sat), and Sunday (Sun); 3-h daily maximaaaveraged over all stations and days of year.
Year CO ppm O3ppb NOxppb PM10mg m−3
M-F Sat Sun M-F Sat Sun M-F Sat Sun M-F Sat Sun 1986 8.2 6.2 4.5 72 82 71 151 136 99 1987 7.3 5.3 3.9 91 82 80 149 116 79 1988 7.8 6.2 4.2 112 106 104 133 108 73 1989 7.5 6.0 4.8 99 95 91 141 117 89 1990 8.7 7.5 6.3 110 115 106 136 116 86 1991 9.3 7.9 6.6 135 145 125 143 118 88 1992 8.4 7.2 5.9 124 118 116 141 121 92 131 125 91 1993 6.2 5.0 3.9 113 121 112 142 122 93 143 144 130 1994 5.5 4.7 3.5 121 117 106 135 115 81 89 92 71 1995 4.5 3.7 2.9 116 119 109 126 101 70 94 82 71 1996 5.1 4.4 3.1 107 107 102 157 138 88 108 106 77 1997 4.6 3.9 3.0 100 99 103 157 126 92 107 107 92 1998 4.7 3.8 2.9 101 108 102 129 103 74 104 104 89 1999 4.3 3.5 2.5 98 98 86 124 104 67 80 72 57 2000 4.5 3.7 2.7 103 109 106 135 113 73 75 78 56 2001 4.0 3.2 2.4 91 98 91 112 95 65 78 76 60 2002 3.5 2.8 2.0 91 93 86 121 98 65 79 68 57 2003 3.2 2.8 2.0 87 87 86 138 120 81 85 82 66 2004 3.1 2.3 1.7 78 77 79 140 107 76 80 68 58 2005 2.9 2.4 1.8 81 85 85 139 116 80 84 86 66 2006 2.7 2.2 1.6 77 79 79 137 112 75 78 70 61 2007 2.4 2.2 1.4 74 81 81 135 121 72 76 74 54 Average of each day’s three highest values between 7 a.m. and noon for CO, NOx, and PM10, and between 11 a.m. and 5 p.m. for O3.
ACPD
8, 8357–8384, 2008Mexico City pollution weekend effect S. Stephens et al. Title Page Abstract Introduction Conclusions References Tables Figures ◭ ◮ ◭ ◮ Back Close
Full Screen / Esc
Printer-friendly Version
Interactive Discussion
Fig. 1. Diurnal cycle of CO, NOx, O3, and PM10in M ´exico City, averaged for all stations over 2001–2007.
ACPD
8, 8357–8384, 2008Mexico City pollution weekend effect S. Stephens et al. Title Page Abstract Introduction Conclusions References Tables Figures ◭ ◮ ◭ ◮ Back Close
Full Screen / Esc
Printer-friendly Version
Interactive Discussion
Fig. 2. Long term trends in the concentrations of CO, NOx, and PM10in the morning (average of the three highest concentrations between 7 a.m. and 12 noon) and O3 in the afternoon (average of the three highest concentrations between 11 a.m. and 5 p.m.) averaged over all stations for Wednesdays (red) and Sundays (blue).
ACPD
8, 8357–8384, 2008Mexico City pollution weekend effect S. Stephens et al. Title Page Abstract Introduction Conclusions References Tables Figures ◭ ◮ ◭ ◮ Back Close
Full Screen / Esc
Printer-friendly Version
Interactive Discussion
Fig. 3. Weekly patters of the concentrations of CO, NOx, and PM10 in the morning (average of the three highest concentrations between 7 a.m. and 12 noon) and O3 in the afternoon (average of the three highest concentrations between 11 a.m. and 5 p.m.), by city sector (see legend). Averages are given for the time periods 1986–1992 (red), 1993–2000 (green), and 2001–2007 (blue).
ACPD
8, 8357–8384, 2008Mexico City pollution weekend effect S. Stephens et al. Title Page Abstract Introduction Conclusions References Tables Figures ◭ ◮ ◭ ◮ Back Close
Full Screen / Esc
Printer-friendly Version
Interactive Discussion
Fig. 4. Amplitude (absolute concentration) of the weekend effect for CO, NOx, PM10, and O3. Thick line is the average of all stations, while individual thin lines (legend in lower right panel) give results by sector.
ACPD
8, 8357–8384, 2008Mexico City pollution weekend effect S. Stephens et al. Title Page Abstract Introduction Conclusions References Tables Figures ◭ ◮ ◭ ◮ Back Close
Full Screen / Esc
Printer-friendly Version
Interactive Discussion
Fig. 5. Amplitude (relative %) of the weekend effect for CO, NOx, PM10, and O3. Thick line is the average of all stations, while individual thin lines (legend in lower right panel) give results by sector.
ACPD
8, 8357–8384, 2008Mexico City pollution weekend effect S. Stephens et al. Title Page Abstract Introduction Conclusions References Tables Figures ◭ ◮ ◭ ◮ Back Close
Full Screen / Esc
Printer-friendly Version
Interactive Discussion
ACPD
8, 8357–8384, 2008Mexico City pollution weekend effect S. Stephens et al. Title Page Abstract Introduction Conclusions References Tables Figures ◭ ◮ ◭ ◮ Back Close
Full Screen / Esc
Printer-friendly Version
Interactive Discussion
ACPD
8, 8357–8384, 2008Mexico City pollution weekend effect S. Stephens et al. Title Page Abstract Introduction Conclusions References Tables Figures ◭ ◮ ◭ ◮ Back Close
Full Screen / Esc
Printer-friendly Version
Interactive Discussion
Fig. 8. Fraction of radical loss by NOxchemistry relative to total radical loss (LN/Q) derived from
the observed weekend changes in CO, NOx, and O3 concentrations. Circles are for workday (Monday–Friday) to Saturday changes, while squares are for Saturday to Sunday changes, for assumed 2% (solid symbols) and 12% (open symbols) enhancements in photolysis rates (J-values). Unweighted least square linear fits are shown for visual guidance.