HAL Id: hal-00329137
https://hal.archives-ouvertes.fr/hal-00329137
Submitted on 1 Jan 1999
HAL is a multi-disciplinary open access
archive for the deposit and dissemination of sci-entific research documents, whether they are pub-lished or not. The documents may come from teaching and research institutions in France or abroad, or from public or private research centers.
L’archive ouverte pluridisciplinaire HAL, est destinée au dépôt et à la diffusion de documents scientifiques de niveau recherche, publiés ou non, émanant des établissements d’enseignement et de recherche français ou étrangers, des laboratoires publics ou privés.
Long-term changes of the upper stratosphere as seen by
Japanese rocketsondes at Ryori (39°N, 141°E)
Philippe Keckhut, K. Kodera
To cite this version:
Philippe Keckhut, K. Kodera. Long-term changes of the upper stratosphere as seen by Japanese rocketsondes at Ryori (39°N, 141°E). Annales Geophysicae, European Geosciences Union, 1999, 17 (9), pp.1210-1217. �hal-00329137�
Long-term changes of the upper stratosphere as seen by Japanese
rocketsondes at Ryori (39°N, 141°E)
P. Keckhut1and K. Kodera2
1Institut Pierre Simon Laplace, Service d'AeÂronomie du CNRS, VerrieÁres-le-Buisson, France 2Meteorological Research Institute, Nagamine, Tsukuba, Ibaraki 305, Japan
Received: 16 October 1998 / Revised: 21 April 1999 / Accepted: 4 May 1999
Abstract. Wind and temperature pro®les measured routinely by rockets at Ryori (Japan) since 1970 are analysed to quantify interannual changes that occur in the upper stratosphere. The analysis involved using a least square ®tting of the data with a multiparametric adaptative model composed of a linear combination of some functions that represent the main expected climate forcing responses of the stratosphere. These functions are seasonal cycles, solar activity changes, stratospheric optical depth induced by volcanic aerosols, equatorial wind oscillations and a possible linear trend. Step functions are also included in the analyses to take into account instrumental changes. Results reveal a small change for wind data series above 45 km when new corrections were introduced to take into account instrumental changes. However, no signi®cant change of the mean is noted for temperature even after sondes were improved. While wind series reveal no signi®cant trends, a signi®cant cooling of 2.0 to 2.5 K/decade is observed in the mid upper stratosphere using this analysis method. This cooling is more than double the cooling predicted by models by a factor of more than two. In winter, it may be noted that the amplitude of the atmospheric response is enhanced. This is probably caused by the larger ozone depletion and/or by some dynamical feedback eects. In winter, cooling tends to be smaller around 40±45 km (in fact a warming trend is observed in December) as already observed in other data sets and simulated by models. Although the winter response to volcanic aerosols is in good agreement with numerical simulations, the solar signature is of the opposite sign to that expected. This is not understood, but it has already been observed with other data sets. Key words. Atmospheric composition and structure (evolution of one atmosphere; pressure, density, and temperature) á Meteorology and atmospheric dynamics (middle atmosphere dynamics)
1 Introduction
Long-term observations of the physical parameters of the stratosphere are crucial to monitor possible climate changes. Anthropogenic temperature changes induced by increases in CO2or decreases in ozone has led to a
number of modelling studies. If most of the models predict a global cooling of the stratosphere, the expected magnitude and the spatial distribution of such cooling is still being debated since the spatial and seasonal distribution of ozone trends is still uncertain. Also many feedback mechanisms, such as dynamical pro-cesses, can be expected to modify the long-term atmospheric changes. Analysis studies of the US and Soviet rocket data bases all con®rm such a cooling. While recent quanti®cations of such trends in the stratosphere over the tropical and subtropical regions reveal a larger cooling than those estimated by numer-ical simulations (Angell, 1987; Keckhut et al., 1999; Dunkerton et al., 1998), mid-latitude estimations pres-ent smaller amplitudes (Kokin et al., 1994; Keckhut et al., 1995). This is probably due to a dynamical contribution that is expected to be larger in this area (Rind et al., 1990). Also, while the atmospheric response to solar changes is well represented by photochemical model simulations in tropical regions (Hood et al., 1993; Dunkerton et al., 1998), mid-latitude responses in winter (Kokin et al., 1994; Keckhut et al., 1995) are not understood. Several studies have suggested a dynamical origin through feedback eects without any clear proposed mechanism. The propagation of plane-tary waves generated in the troposphere is aected by stratospheric circulation and in some conditions cannot propagate into the stratosphere. Also the stratosphere can determine, to some extent, its own wave driving. The upward transmissivity of wave activity as a function of temperature and wind structure have been empha-sised by many investigators (Karoly and Hoskins, 1982; Chen and Robinson, 1992).
Correspondence to: P. Keckhut e-mail: [email protected]
Observations of wind and temperature by rockets at Ryori (Japan) can provide a supplementary source to quantify long-term changes of the stratosphere at mid-latitudes. A previous analysis was made with tempera-ture data extending up to 1989 (Komuro, 1989). Here we propose to update this study with a longer data set including data extended to 1995 and to add a wind analysis to the temperature. The previous analysis is improved in taking into account natural variability in using a multi-function regression model.
The Ryori site (39°N, 141°E) is especially useful regarding the global stratospheric circulation compared to the other subtropical rocket sites because it is located close to an anticyclone centred over the Aleutian Islands in the North Paci®c Ocean at 55°N, 175°W. Maximum geopotential heights are found in the lower stratosphere over this area. This phenomenon has come to be known as the Aleutian High. A variety of observational studies have explored its structure and behaviour (Harvey and Hitchman, 1996). Quasi-stationary continental-scale circulation plays a major role in the annual cycle of the subtropical stratosphere that aects the southern winter ¯ow. Stratospheric anticyclones have been found to be an essential aspect for air mixing and for the advection from the tropics to higher latitudes (McIntyre and Palmer, 1983; Randel et al., 1993) but also for planetary wave propagation and breaking (Dunkerton and Delisi, 1986; O'Neill et al., 1994). In this study a particular emphasis is placed on winter data when North Pole ozone depletion is observed and when planetary waves can propagate into the stratosphere and may contribute signi®cantly to interannual changes and climate feedback. It is not possible to draw ®rm conclusions using data from a single location. However, in the stratosphere (and mostly in the upper strato-sphere) few continuous data bases are available on a long-term basis for studying interannual variability and many of them require speci®c analysis to clean-up data pollution by instrumental eects. Also, comparisons with published multi-dimensional simulations permit interpretation of some of the observed features. This study is proposed to continue the global eorts of documenting interannual change using existing long data series as a basis for comparison with models and for theoretical interpretation.
2 Data analysis procedure
Meteorological rocket sounding has been in use for routine measurements of wind and temperature in the upper stratosphere at Ryori (39°N, 142°E) for many years. The instruments consist of a nose cone containing a parachute, and a temperature sensor with its trans-mitter, that is separated from the rocket motor at the apogee. The payload known as ``Echosonde'' is a pulse-position-modulation system containing a nickel-iron wire as the temperature sensing device. Temperature is measured during descent under a slink parachute while telemetering information to ground. The altitude of the sonde and the wind measurements is deduced from the
position of the sonde determined by a ground tracking radar. These rockets reach a maximum height of 62 km while the sensor is deployed at 60 km limiting measure-ments to the upper stratosphere, a lower altitude range compared to US and Soviet vehicles. Those measure-ments have been carried out and archived by the Japan Meteorological Agency. Rockets have been launched at 2 UT with no deviation larger than 30 min. This is a guarantee against any interference with atmospheric tides (Keckhut et al., 1996) or diurnal instrumental heating (Hoxit and Henry, 1973) which may exist in the US rocket data base (Keckhut et al., 1999). The rocketsonde vehicle, is a MT-135 rocket, a solid-propellant single stage rocket that has not been changed since July 1970. Data have been corrected for aerody-namic, solar radiation, and Joule heating, and in a lesser extent for long wave radiation and lag errors (Yata, 1970). The total temperature correction at 60 km is approximately 22°. While the sensor type has not been changed since 1970, the thermistor mount was modi®ed in 1977. The rocketsonde ES89P actually in operation has replaced the ES-64B sonde previously used. The change concerns mainly the wire frame size. Since April 1975, wind data are also corrected for fall velocity and ballistic motion eects. Such changes are probably minor and smaller than instrumental noise. However they may have induced some changes of the mean which need to be considered for long-term data analysis. Two to four launches per month were made systematically since 1971 providing a total number of vertical temper-ature and wind pro®les of 794. The con®dence for trend estimates depends on the correlation between successive measurements, the atmospheric variability, and the sampling. Usually, in the stratosphere the lowest uncertainty is obtained for data averaged over 15 to 30 days. In this study, it was decided to use monthly means. The number of monthly means obtained with the whole data set of Ryori is 277. The soundings are uniformly distributed as a function of time and the number of monthly means is around 69±70 for data partitioning within any of the three month intervals and 23±24 when any single month analysis is selected.
The data analysis for trend detection used a least square ®tting of the data with a multiparametric adaptative model that has been developed to take into account simultaneously natural variability and possible trend. The AMOUNTS (adaptative model for unam-biguous trend survey) regression analysis has already been used and described in previous lidar (Hauchecorne et al., 1991; Keckhut et al., 1996) and rocket (Keckhut et al., 1999) trend studies. The regression model used here includes a seasonal trend, a seasonal linear function related to solar activity (10.7 cm solar ¯ux), a seasonal function of the quasi biennial oscillation, a seasonal function of the optical depth induced by volcanic stratospheric aerosols (Sato et al., 1993), and the seasonal components (annual and semi-annual). This model also includes step functions at some speci®c dates when sensor mount or correction applied have been changed (as mentioned previously). The largest bias detected occurs for wind above 45 km when new
corrections were introduced in the data analysis (Fig. 1b). On the other hand, no signi®cant change of the mean is noted for temperature (Fig. 1a) after the sondes were improved.
3 Results of long-term changes 3.1 Volcanic eruptions
Volcanic eruptions may have a signi®cant impact on the mean atmospheric temperature. Direct eects in the
lower stratosphere and troposphere over tropical re-gions are unambiguously detected after major volcanic events such as the last Mount Pinatubo eruption (Labitzke and McCormick, 1992; Angell, 1997). Indirect eects, caused by the vertical radiative balance and eects on the global circulation, may occur elsewhere, even far from the region of the direct forcing (Rind et al., 1992). Depending on the occurrence of such events in the data series, trend analysis may be in¯uenced and miss-estimated. During the period ana-lysed here, three major eruptions have injected particles into the stratosphere. If it is assumed that volcanic aerosols induce climatic perturbations linearly related to the optical depth, the computed mean annual response to stratospheric volcanic aerosols found over Ryori is not highly signi®cant and is between 1 and 2 K for temperature for a mean optical depth of 0.1 (Fig. 2a). This result is in agreement with estimations made after the El Chichon eruption by Angell (1997) from US rocketsonde. The amplitude of the temperature response in the upper stratosphere is predicted to be minimum at mid-latitudes by some model simulations of the forcing of an uniform stratospheric aerosols loading performed with the GISS (Goddard Institute for Space Studies) global climate model (Rind et al., 1992). A larger mean annual response is estimated here. Winter response presents an enhanced warming (3±4 K) in good agree-ment with the signature reported above the Observatory of Haute-Provence in France (Keckhut et al., 1995). At high latitude, in the upper stratosphere and lower mesosphere, simulations show that temperatures warm in winter, with a magnitude from one to four times the model's natural variability. This arises due to changes in dynamics, in particular the altered residual circulation. A similar warming is observed using a spectral three-dimensional model of the stratosphere (Pitari, 1992) revealing a zonal mean warming of 2 K extended down to 45° induced by the modi®cation of the propagation
Fig. 1a, b. Amplitude of step functions (dashed lines) as a function of altitude in a the temperature and b wind data series computed with the regression model respectively in January 1977 and April 1975. Dotted lines are the 2r con®dence intervals. Changes are shown for temperatures in K and in ms)1for wind
Fig. 2a±c. Vertical response in a temperature, b zonal wind and c meridional wind series (in K and in ms)1) to a mean optical depth change of 0.1, induced by stratospheric aerosols. Dashed lines are the analyses of all the data, while dotted lines are the 2r con®dence intervals. Results for winter month (December-Janu-ary-February) analyses are shown by crosses. Horizontal lines are associated with con®dence intervals
and the energy generation in the troposphere of planetary waves through changes of the vertical static stability at low latitudes. However, the response is not uniform with longitude and a region of maximum is expected over eastern Asia and to a lesser extent over North America (Pitari, 1992). Models and observations both present a maximum zonal wind change around the stratopause (Fig. 2b). Zonal wind changes in the model are smaller (8 ms)1) than the ones reported here
(20 ms)1) but may also be associated to the regional
warming. A nearly signi®cant meridional anomaly is also observed around the stratopause (Fig. 2c).
3.2 Solar activity
Temperature and ozone are expected to be correlated with solar activity with a maximum around the strato-pause following the line of zero zenith angle. This direct radiative and photochemical eect is calculated selecting all the six summer months of data from April to September (Fig. 3). The temperature response is quite uniform from 30 km to the top (55 km) and is equal to around 1 K, from solar minimum to solar maximum conditions, just above the con®dence limit (95%). Wind responses are less signi®cant. Zonal wind exhibits a maximum of 0.8 ms)1 at 45 km with a uncertainty
of 1.5 ms)1 (95%). Temperature and wind responses,
observed in this 25-y monthly rocketsonde data, to solar activity changes, are small. However, amplitude of changes for both temperature and wind associated with solar change activity, deduced from the multi-function regression analysis applied here on Japanese rockets-onde series are in good agreement with the numerical simulations of Garcia et al. (1984). Temperatures are expected to be correlated with solar activity with a
maximum of 2 K per solar cycle in tropical regions around 45 km. At higher latitudes simulations show that the temperature response is reduced with a ¯at response over a larger altitude range. Zonal winds should vary with an amplitude of 1±2 ms±1 around the
mid-latitude stratopause from solar minimum to solar maximum conditions. More recent simulations (Huang and Brasseur, 1993) including more realistic solar forcing, gave a slightly smaller response. Observed solar eects on ozone in the latitude band beween 30 to 50°N (Miller et al., 1996) are maximum at 35±40 km with a magnitude of around 4±5% changes from solar maxi-mum to solar minimaxi-mum conditions in good agreement with the solar eects expected from theory. The magni-tude of the observed temperature and wind response can be considered in as good agreement with theory.
During winter season, an enhanced eect, nearly signi®cant, can be observed around 40 km on both wind (6.5 10 m/s) and temperature changes ()2.5 2.6 K) having an opposite sign (Fig. 4b, c). The analysis of December zonal wind at Ryori made by Kodera and Yamazaki (1990), using a shorter data set, reveals even larger amplitude (20 m/s). This unpredicted response which can not be understood with radiative and photochemistry processes alone was already observed at mid-latitude with lidar (Hauchecorne et al., 1991; Keckhut et al., 1995) and with Soviet rocketsonde data series (Kokin et al., 1994). This seems to imply that some feedback mechanisms may be involved. Several authors have suggested an indirect role through the dynamics of the middle atmosphere and planetary waves are highly suspected (Geller and Alpert, 1980; Hines, 1974). However, some investigations (Kodera et al., 1990; Balachandra and Rind, 1995) have shown that a very large and unrealistic change of the solar heating rate in the stratosphere is required to produce such a
Fig. 3a±c. Response to solar activity changes from solar maximum to solar minimum conditions on a temperature, b zonal wind and c meridional wind series (in K and in ms)1). Dashed lines are analyses of the data obtained from April to September, while dotted lines are the
2r con®dence intervals. Results for winter month (December-January-February) analyses are shown by crosses. Results for January monthly analyses are noted by circles. Horizontal lines are con®dence intervals
change. Simulations with a two-dimensional model including an interactive calculation of the dynamic (Huang and Brasseur, 1993), shows that feedback eects due to wave-mean ¯ow interactions by gravity and planetary waves, seem to have small impacts on temper-ature and tend to reduce wind perturbations rather than to amplify it. However, 2 D model are not well adapted to study the dynamical feedback in a realistic manner. Moreover, tropical dynamics, responsible for the QBO and semi-annual oscillation (SAO), are not included in these models, and possible feedback due to small-scale dynamics is not yet fully understood and quanti®ed.
For January, a very dierent correlation between solar activity and upper stratospheric wind is observed (Fig. 3). This can be due to the anticyclonic cell (the Aleutian High) developed over North Paci®c which usually becomes very intense in January. If the intensity of the cell is modulated according to changes of solar activity, which induce small changes in radiative forcing, the wind speed can be modulated too. Since Japan is located not far from the northwest side of the cell, one can understand the large negative correlation between solar activity and both components of the wind (Fig. 5). However, this needs to be speci®cally tested with a three-dimensional model.
3.3 Trends
Taking into account some of the components of the natural variability described previously, a signi®cant cooling of 2.0 1.9 to 2.5 1.1 K/decade is comput-ed (Fig. 6), while wind series reveal no signi®cant change. Zonal and meridional wind changes are
respec-tively smaller than 0.6 1 ms)1 and 0.1 0.5 ms)1/
decade. This study con®rms the general cooling (Fig. 4a) of the upper stratosphere already observed with other data bases and with models. While very similar ampli-tudes are obtained in the upper stratosphere with the preliminary analysis done by Komuro (1989), a larger amplitude by a factor of 3 can be noted around 20± 30 km. Trend results are in good agreement with recent rocket analyses (Keckhut et al., 1999; Dunkerton et al., 1998) that have reported a cooling around 1.8 K per decade in the altitude range between 35 to 50 km, for stations located mostly at low latitudes. However, trends in the lower stratosphere are twice those observed in tropical and subtropical regions. Also, one can note, that a lidar at a mid-latitude site in the south of France (44°N) has observed a non-signi®cant and smaller cooling in the mid-upper stratosphere (Keckhut et al., 1995) and a slight warming in winter (Hauchecorne et al., 1991).
There are still some uncertainties about the spatial distribution of the ozone decrease in the lower strato-sphere. Several Dobson spectrometers have been oper-ated in Japan since 1958. These measurements seem to reveal smaller and not signi®cant ozone decreases compared with the ones observed over Europe and North America over the last decades (WMO, 1988; Reinsel et al., 1994; SPARC, 1998). Moreover, these instruments operating since the seventies in the Umkehr mode provide one of the longest record of stratospheric ozone vertical distributions. These measurements in the lower stratosphere are polluted by volcanic aerosols that require corrections (Newchurch and Cunnold, 1994) limiting the length of the data set. Also the Japanese instruments have known several interventions which reduce the con®dence in the vertical pro®le of trend
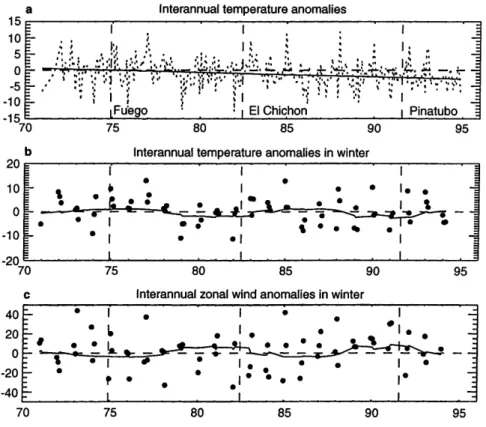
Fig. 4. Data series of the anomalies (data minus seasonal changes) at 40 km over Ryori for temperature a for all the data, b for winter temperature only and c for winter zonal wind. Solid lines in b show linear trend or b, c solar cycle response computed by the regression model
estimates mainly in the lower stratosphere. In the latitude band between 30 to 50°N mean trend coe-cients present two maxima of 7% at 45 km and 15 km. There are more uncertainties at this last altitude due to the presence of stratospheric aerosols and the atmo-spheric variability. Using a radiative transfer model including such an estimated ozone change and CO2
increase on the period between 1970 and 1986 (WMO, 1989). Miller et al. (1992) have reported a cooling of 0.4 K/decade around 30 km to 1.1 K/decade at 45 km. Observations at Ryori reveal larger cooling by factors of 2 in the upper stratosphere to 4 in the mid and lower stratosphere.
Seasonal components of computed trends at Ryori are mainly caused by winter season behaviour. The winter temperature trend pro®le (Fig. 6a) appears to be signi®cantly dierent compared to other seasons; en-hanced below 35 km and above 50 km and reduced around 40±45 km. A signi®cant enhancement in the lower stratosphere in winter (3.1 2.1 K/decade) is expected as the largest ozone decline occurs in the winter-spring season as already observed (SPARC/IOC/ GAW, 1998) and simulated (Ramaswamy et al., 1996). This last study reports an associated cooling of 1.5 K at mid-latitude which is half the one observed here. A coupled analysis of TOMS (total ozone mapping
spec-Fig. 5a, b. Climatology of the geopotential height at 1 hPa (1980±1994) for a early De-cember and b late January. Units are in decameters
Fig. 6a±c. As Fig. 2 except for trend. In this case, circles are associated with December monthly analyses
trometer) and MSU (microwave sounding unit) satellite data (Randel and Cobb, 1994) in winter (January-February) reveals some coherent horizontal patterns of ozone and temperature changes. Trend maps show a pronounced zonal wave 1 pattern, with large negative ozone and temperature trends over eastern Asia. Trends of )30 DU/decade and )2 K/decade are estimated in this area in quite good agreement with our results. Although no seasonal changes of trends have been reported on the recent rocket analyses at low latitudes in the upper stratosphere, the vertical winter trend pattern observed over Ryori has been already observed from other data sets at mid-latitudes from Soviet rockets (Kokin et al., 1994) and from lidar (Hauchecorne et al., 1991); even warming can be noted during winter period in these data sets. This signature is expected from 3 D models covering the whole middle atmosphere up to the upper mesosphere (Rind et al., 1990). This is also the case for winter months over Ryori and more visible in December when a nearly signi®cant warming of 5 K/decade can be noted. During this month the largest zonal wind amplitude is usually observed. Some feedback mecha-nisms through the dynamical processes can be expected. In this study no signi®cant zonal wind changes (Fig. 6b) have been noted for December, while an enhanced wind trend is observed in winter months of 5.6 8 ms)1/
decade. Expected trends on stratospheric zonal wind are smaller than 1 ms)1 per decade for a doubling of CO
2
concentration (Rind et al., 1990) and predict a zero line of wind change in the vicinity of 40° latitude. However, published simulations of long-term stratospheric wind changes are not numerous and uncertain and few estimations of stratospheric zonal wind changes have been computed for other climate forcing such as the one associated with a non-uniform ozone decrease.
4 Summary and conclusion
Temperature and wind data series obtained by succes-sive rocketsonde launches from Japan, have been analysed to quantify possible anthropogenic trends while taking account of natural variability and possible eects of instrumental changes. While a bias is detected in the wind data series mainly above 45 km probably induced by corrections introduced in the data analysis, no changes associated with instrumental changes are found for temperature. Annual mean atmospheric responses to natural variability such as volcanic erup-tions and the solar cycle are small and in quite good agreement with models. Although the winter response to volcanic aerosols is in agreement with numerical simu-lations, the solar signature is of the opposite sign compared to that expected. This signature was already observed with other data sets (Mohanakumar, 1985; Hauchecorne et al., 1991) and is not yet fully under-stood. The signi®cant cooling of 2.0 to 2.5 K/decade obtained in this study is larger than the one predicted by models suggesting the contribution of some feedback or some other climatic forcing. The winter cooling tends to be minimum around 40±45 km (it even tends to warm
for December period) as already observed in other data sets and simulated by models. However, the wind series does not reveal very signi®cant changes. Longer data series are required and the natural variability needs to be smaller. This can be achieved by obtaining more frequent measurements or providing a better ®tting function of the variability. In winter, it may be noted that the amplitude of the atmospheric response is enhanced in the lower stratosphere, probably because the largest ozone depletions occur during this season. The warming eect in the upper stratosphere in winter is probably due to some dynamical feedback eects.
Acknowledgements. Rocket data were provided by the Japan Meteorological Agency. We are grateful to Seiji Miyauchi for data information and FrancËoise Pinsard for data manipulations. The QBO data were kindly provided by B. Naujokat (Institut fuer Meteorologie/Berlin), and total aerosol optical depth was provided by M. Sato (NASA/GISS). The authors would like to thank Celine Phillips and Alain Hauchecorne for useful discussions.
Topical Editor F. Vial thanks A.J. Miller and another referee for their help in evaluating this paper.
References
Angell, J. K., Rocketsonde for a stratospheric temperature decrease in the western hemisphere during 1973±85, Mon. Weather Rev., 115, 2569±2577, 1987.
Angell, J. K., Stratospheric warming due to Agung, El Chichon, and Pinatubo taking into account the quasi-biennial oscilla-tion, J. Geophys. Res., 102, 9479±9485, 1997.
Balachandra, N., and D. Rind, Modeling the eect of solar variability and the QBO on the troposphere/stratosphere system, I, The middle atmosphere, J. Clim., 8, 2058±2079, 1995. Chen, P., and W. A. Robinson, Propagation of planetary waves between the troposphere and stratosphere, J. Atmos. Sci., 49, 2533±2545, 1992.
Dunkerton, T. J., and D. P. Delisi, Evolution of potential vorticity in the winter stratosphere of January-february 1979, Geophys. Res. Lett., 91, 1119±1208, 1986.
Dunkerton, T. J., D. P. Delisi, and M. Baldwin, Middle atmosphere cooling trend in historical rockesonde data, Geophys. Res. Lett., 25, 3371±3374, 1998.
Garcia, R., S. Solomon, R. G. Roble, and D. W. Rusch, Anumerical response of the middle atmosphere to the 11-year solar cycle, Planet. Space Sci., 32, 411±423, 1984.
Geller, M. A., and J. C. Alpert, Planetary wave coupling between the troposphere and the middle atmosphere as a possible sun-weather mechanism, J. Atmos. Sci., 37, 1197±1214, 1980. Harvey, V. L., and M. H. Hitchman, A climatology of the Aleutian
High, J. Atmos. Sci., 53, 2088±2101, 1996.
Hauchecorne, A., M. L. Chanin, and P. Keckhut, Climatology of the middle atmospheric temperature (30±90 km) and trends as seen by Rayleigh lidar above south of France, J. Geophys. Res., 96, 15 297±15 309, 1991.
Hines, C. O., A possible mechanism for the production of sun-weather correlations, J. Atmos. Sci., 31, 589±591, 1974. Hood, L. L., J. L. Jirikowic, and J. P. McCormack, Quasi-decadal
variability of the stratosphere: In¯uence of long term solar ultraviolet variations, J. Atmos. Sci., 50, 3941±3958, 1993. Hoxit, L. R. and Henry, R. M., Diurnal and annual temperature
variations in the 30±60 km region as indicated by statistical analysis of rocketsonde temperature data, J. Atmos. Sci., 30, 922±933, 1973.
Huang, T. Y. W, and G. P. Brasseur, Eect of long-term variability in a two-dimensional interactive model of the middle atmo-sphere, J. Geophys. Res., 98, 20 413±20 427, 1993.
Karoly, D. J., and B. J. Hoskins, Three-dimensional propagation of planetary waves, J. meteor. Soc. Japan, 60, 109±122, 1982. Keckhut, P., A. Hauchecorne, and M. L. Chanin, Midlatitude
long-term variability of the middle atmosphere: trends and cyclic and episodic changes, J. Geophys. Res., 100, 18 887±18 897, 1995. Keckhut, P., M. E. Gelman, J. D. Wild, F. Tissot, A. J. Miller, A.
Hauchecorne, M. L. Chanin, E. F. Fshbein, J. Gille, J. M. Russell III, and F. W. Taylor, Semi-diurnal and diurnal temperature tides (30±55 km): climatology and eect on UARS-lidar data comparisons, J. Geophys. Res., 101, 10 299±10 310, 1996. Keckhut, P., F. J. Schmidlin, A. Hauchecorne, and M. L. Chanin,
Trend estimates from US rocketsondes at low latitude stations (8°S-34°N), taking into account instrumental changes and natural variability, submitted to J. Atmos. Terr. Phys., 61, 447±459, 1999.
Kodera, K., and K. Yamazaki, Long-term variations of upper stratospheric circulation in the northern hemisphere in Decem-ber, J. Meteorol. Soc. Jap., 68, 101±105, 1990.
Kodera, K., K. Yamazaki, M. Chiba, and K. Shibata, Downward propagation of upper stratospheric mean zonal wind perturba-tion to the troposphere, Geophys. Res. Lett., 17, 1263±1266, 1990. Komuro, H., Long-term cooling in the stratosphere observed by aerological rockets at Ryori, Japan, J. Meteorol. Soc. Jap., 68, 1081±1082, 1989.
Kokin, G. A., and E. V. Lysenko, On temperature trends of the atmosphere from rocket and radiosonde data, J. Atmos. Terr. Phys., 56, 1035±1040, 1994.
Labitzke, K., and M. P. McCormick, Stratospheric temperature increases due to Pinatubo aerosols, Geophys. Res. Lett., 19, 207± 210, 1992.
McIntyre, M. E., and T. N. Palmer, Breaking planetary waves in the stratosphere, Nature, 305, 593±599, 1983.
Miller, A. J., R. M. Nagatani, G. C. Tia, X. F. Niu, G. C. Reinsel, D. Wuebbles and K. Grant, Comparisons of observed ozone and temperature trends in the lower stratosphere, Geophys. Res. Lett., 19, 929±932, 1992.
Miller, A. J., S. M. Hollandsworth, L. E. Flynn, G. C. Tiao, G. C. Reinsel, L. Bishop, R. D. McPeters, W. G. Planet, J. J. DeLuisi, C. L. Mateer, D. Wuebbles, J. Kerr, and R. M. Nagatani, Comparisons of observed ozone trends and solar eects in the stratosphere through examination of ground-based Umkehr and combined solar backscattered ultraviolet (SBUV) and SBUV2 satellite data, J. Geophys. Res., 101, 9017±9021, 1996. Mohanakumar, K., An investigation on the in¯uence of solar cycle on mesospheric temperature, Planet. Space Sci., 33, 745±805, 1985.
Newchurch, M. J., and D. M. Cunnold, Aerosol eect on Umkehr ozone pro®les using stratospheric aerosol and gas experiment II measurements, J. Geophys. Res., 99, 1383±1388, 1994. Pitari, G., A numerical study of the possible perturbation of
stratospheric dynamics due to Pinatubo aerosols: implications for tracer transport, J. Atmos. Sci., 50, 2443±2461, 1993. O'Neill, A., W. L. Grose, V. D. Pope, H. Maclean, and R.
Swinbank, Evolution of the stratosphere during northern winter 1991/92 as diagnosed from U.K. meterological oce analyses, J. Atmos. Sci., 51, 2800±2817, 1994.
Ramaswamy, V., M. D. Schwarzkopf, and J. Randel, Fingerprint of ozone depletion in the spatial and temporal pattern of recent lower-stratospheric cooling, Nature, 382, 616±618, 1996. Randel, W. J., J. C. Gille, A. E. Roche, J. B. Kumer, J. L.
Mergenthaler, J. W. Waters, E. F. Fishbein, and W. A. Lahoz, Stratospheric transport from the tropics to middle latitudes by planetary-wave mixing, Nature, 365, 533±535, 1993.
Randel, W. J., and J. B. Cobb, Coherent variations of monthly mean total ozone and lower stratospheric temperature, J. Geophys. Res., 99, 5433±5447, 1994.
Reinsel, G. C., G. C. Tiao, D. J. Wuebbles, J. B. Kerr, A. J. Miller, R. M. Nagatani, L. Bishop, and L. H. Ying, Seasonal trend analysis of published ground-based and TOMS total ozone data through 1991, J. Geophys. Res., 99, 5449±5464, 1994. Rind, D., R. Suozzo, N. K. Balachandra, and M. J. Prather, Climate
change and the middle atmosphere. Part II: the impact of volcanic aerosols, J. Clim., 5, 189±207, 1992.
Rind, D., N. K. Balachandra, and R. Suozzo, Climate change and the middle atmosphere. Part I: the doubled CO2 climate, J. Atmos. Sci., 47, 475±494, 1990.
Sato, M., J. E. Hansen, M. P. McCormick, and J. B. Pollack, Stratospheric aerosol optical depth, 1850±1990, J. Geophys. Res., 98, 22 987±22 994, 1993.
Stratospheric processes and their role in climate/international ozone commission/global atmospheric watch (SPARC/IOC/ GAW), Assessment of trends in the vertical distribution of ozone, SPARC Rep. 1, WMO Rep. 43, Eds. N. Harris, R. Hudson and C. Phillips, May 1998.
Yata, A., Correction for temperature data obtained by MT-135 system, Geophys. Mag., 35, 99±121, 1970.
World Meteorological Organization (WMO), Report of the inter-national ozone trends panel 1988, global ozone research and monitoring project, 18, Geneva, 1988.
World Meteorological Organization, Scienti®c assessment of strato-spheric ozone: 1989, global ozone research and monitoring project, 20, Geneva, 1989.