HAL Id: hal-02062447
https://hal.univ-lorraine.fr/hal-02062447
Submitted on 8 Mar 2019HAL is a multi-disciplinary open access archive for the deposit and dissemination of sci-entific research documents, whether they are pub-lished or not. The documents may come from teaching and research institutions in France or abroad, or from public or private research centers.
L’archive ouverte pluridisciplinaire HAL, est destinée au dépôt et à la diffusion de documents scientifiques de niveau recherche, publiés ou non, émanant des établissements d’enseignement et de recherche français ou étrangers, des laboratoires publics ou privés.
A comparative study of some kaolinites surface
properties
J.A. Mbey, F. Thomas, A. Razafitianamaharavo, C. Caillet, F. Villiéras
To cite this version:
J.A. Mbey, F. Thomas, A. Razafitianamaharavo, C. Caillet, F. Villiéras. A comparative study of some kaolinites surface properties. Applied Clay Science, Elsevier, 2019, 172, pp.135-145. �10.1016/j.clay.2019.03.005�. �hal-02062447�
1 A comparative study of some kaolinites surface properties
1
J.A. Mbey 1, 2*, F. Thomas 2, 3, A.Razafitianamaharavo 2, 3, 2
C. Caillet 2, and F.Villieras 2, 3 3
1
University of Yaounde I, Department of Inorganic Chemistry, P.O. BOX 812 Yaoundé 4
2
Université de Lorraine, Laboratoire Interdisciplinaire des Environnements Continentaux, 5
UMR 7360, 15 Avenue du Charmois, B.P. 40. F-54501, Vandœuvre-lès-Nancy Cedex 6
3
CNRS, Laboratoire Interdisciplinaire des Environnements Continentaux, UMR 7360, 15 7
Avenue du Charmois, B.P. 40. F-54501, Vandœuvre-lès-Nancy Cedex 8
*
e-mail: [email protected] ; [email protected] 9
ABSTRACT: The surface properties of five kaolinites of various origins were analyzed using 10
potentiometric titration, electrokinetic measurements and low-pressure gas adsorption 11
associated to derivative isotherm summation (DIS) modeling. The data show that sample 12
structure is important in determining the surface properties. The combined analytical results 13
clearly shows the existence of a permanent negative layer charge for all the samples. The 14
general features that could be observed for the five kaolinites are: the titration curves are 15
shifted to lower pH with increasing ionic strength due to the layer charge; the amount of 16
consumed proton is influenced by the permanent layer charge; although low, the permanent 17
charge determines the electrokinetic behavior. The shape anisotropy and the charge 18
distribution on the basal and edge surfaces are crucial parameters to understand the behavior 19
of kaolinite particles in aqueous media. The Cameroonian sample of the set exhibits a 20
significant permanent charge together with large specific surface area associated to fine 21
particle size and considerable shape anisotropy. 22
Keywords: Kaolinite; Electrokinetic; Potentiometric titration; Surface; DIS Modeling 23
24
*Revised manuscript with no changes marked
2 1. INTRODUCTION
25
Clays are raw materials of importance in various domains such as agriculture, material 26
engineering, health and environmental issues. Amongst clays, kaolin occurrences are 27
common. Primary kaolin deposits are of hydrothermal or residual origin (or mixed 28
hydrothermal and residual); secondary deposits are sedimentary (Murray, 2000; Bergaya et 29
al., 2006; Menezes et al., 2017). The most common clay mineral within the kaolin group is 30
kaolinite (kaol). Each kaol layer is formed by the superposition of one aluminium hydroxide 31
octahedral sheet and one silica tetrahedral sheet. Thus, a kaol layer has asymmetrical basal 32
planes: siloxane and hydroxylated alumina. Basal planes of kaol carry a small permanent 33
negative charge due to isomorphous substitution in both octahedral and tetrahedral sheets, 34
whereas the edge surfaces carry a pH-dependant variable charge due to the 35
protonation/deprotonation of edge hydroxyl groups from broken bonds (Schofield and 36
Samson, 1954; Williams and Williams, 1978; Bolland et al., 1980; Herrington and al., 1992). 37
However, as far as the permanent charge is concerned, cation substitutions in the lattice of 38
kaol are scarce, and the resulting small deviations from stoichiometry are difficult to detect by 39
direct chemical analysis. However, even a small surface charge may influence the surface 40
properties of kaol. In addition, the anisotropic and platy structure of kaol layers also 41
influences its surface properties. Ma and Eggleton (1999b) have shown, using high-resolution 42
transmission electron microscopy, that three types of surface layers may exist on a natural 43
kaol crystal. Type 1 has the expected 0.7 nm surface layer as termination. Type 2 has one 1 44
nm pyrophyllite-like (or low beidellite-like) layer as the surface layer on one side of a kaol 45
particle (ie. TOTOTO…TOTOT, where T and O stand respectively for the tetrahedral and the 46
octahedral sheet). The spacing between the TOT (1 nm thick) and the TO (0.7 nm thick) is 47
non-expandable due to hydrogen bonds. Type 3 has one or several 1 nm collapsed smectite-48
like layers at one or both side of a stack forming a special kind of kaol-smectite 49
3 interstratification. The latter type was observed by these authors only on some poorly ordered 50
kaol. 51
Primarily, the kaol surface charge was investigated through cation exchange capacity (CEC) 52
and potentiometric titration. Ma and Eggleton (1999a), show that the CEC is mainly due to 53
the edges and to basal hydroxyl surface of the mineral. They also conclude that permanent 54
negative charge due to isomorphous substitution is significant. Angove and al., (1997), 55
studied the adsorption of cadmium on kaol. They were able to fit the adsorption data to a 56
simple Langmuir model at pH 5.5. However at pH 7.5, a better fit was obtained with a two-57
site Langmuir model. In the same work, titration experiments allowed for a close fit by a 58
constant capacitance surface complex model that incorporates two bidentate surface 59
complexes. The results from their experiments were consistent with the view that Cd(II) 60
adsorbs to kaol by two distinct processes : ion-exchange at the permanently charged sites on 61
the silanol face and surface complexation to aluminol and silanol groups occurring at the 62
crystal edges. In a comparative study of transition metals adsorption on kaol, Ikhasan et al., 63
(1999) came to the same conclusion. Zhou and Gunter (1992), examined the kaol surface 64
charge in the light of surface charge density and showed, through kaol CEC variation with 65
pH, that the ionization of the basal surface also takes place in aqueous solution. Nevertheless, 66
this contribution of basal faces seems not to be significant enough according to Brady and al., 67
(1996), who explain pH-dependent surface charges in kaol by proton donor–acceptor 68
reactions. Based on the measured proton adsorption isotherms and molecular modeling of 69
proton-relaxed kaol structure, the authors show that edge sites contribute more to kaol charge 70
development, and point out that edge surfaces represent 10 to 50% of the total area, showing 71
that usual estimation of 20% maximum could be an underestimation. Huertas et al., (1998) 72
used a multi-site model to compute the surface properties of kaol and reported that the surface 73
charge of kaol in an inert electrolyte solution involves three different surface sites: external 74
4 hydroxo-aluminium in the octahedral layer, weak Al acidic site, and silanol groups at the 75
crystal edges. Protonation-deprotonation of these groups depending on the pH determines the 76
surface charge. 77
In recent years, potentiometric titration and electrokinetic measurement techniques were 78
commonly used to explore the surface charge of clay minerals (Schroth and Sposito, 1997; 79
Thomas et al., 2002; Appel et al., 2003; Avena et al., 2003; Duc et al., 2006; Tertre et al., 80
2006; Tombácz and Szekeres, 2006; Chassagne et al., 2009; Zhu et al., 2016). Kraepiel et al. 81
(1998) described the acid-base behavior of permanently charged minerals by applying a 82
surface complexation model to montmorillonite and kaol. For kaol, protonation-deprotonation 83
reactions were supposed to take place both on the edges (Al-OH groups) and on the gibbsite 84
basal planes (Al-O-Al groups). The above authors quoted that kaol does not correspond 85
exactly to the model solid, given that the permanent and variable charge distributions are not 86
uniform on the clay surface. In addition, two different surfaces, basal planes and edges, are 87
involved in the acid-base chemistry of clay, which is far from a representation of the interface 88
as an infinite plane. The evaluation of the dissociable charge is still challenging as reported by 89
Duc et al., (2005a). These authors reported, in their review, that the discrepancies amongst the 90
titration data in the literature are due to the experimental procedures for the preparation of the 91
clays and for the quantification of the charge. In two subsequent experimental papers, the 92
same authors found evidences for the origin of this dependency and arouse some critical 93
points for the best experimental conditions: wet storage of the clay, inert gas atmosphere for 94
titration to avoid carbonation, and short interval time between successive titrant increments to 95
minimize side reactions. They also established that continuous titration is more reliable than 96
batch titration for quantifying the surface charge of clays (Duc et al., 2005b, 2006). 97
The discrepancies of surface charge data of clays are also due to the anisotropic nature of the 98
platelets, and to the non-uniform distribution of their surface charge on the basal and edge 99
5 faces. Electrokinetic studies mostly deal with the measurements of the electrophoretic 100
mobility. For kaol, many studies can be found (Williams and Williams, 1978; Rowlands and 101
O’brien, 1995; Kosmulski and Dahlsten, 2006; Tombácz and Szekeres, 2006; Chassagne et 102
al., 2009; Zhu et al., 2016). Many of these studies are consistent with each other, but there is a 103
great variability for the positioning of the iso-electric point (IEP), which is the pH of zero 104
mobility. As pointed out by some authors, this variability can be attributed to differences in 105
chemical composition of the studied samples, to the preparation of the samples, and their 106
history (Tombácz and Szekeres, 2006; Chassagne et al., 2009). 107
Low pressure gas adsorption investigations based on the Derivative Isotherm Summation 108
(DIS) method described by Villiéras et al., (1992) is a versatile tool to quantify the surface 109
heterogeneity distribution of minerals, and especially on kaol. Also the clay particles 110
anisotropy can be accessed through DIS. A correlation between the edge surface area from 111
DIS and the experimental CEC makes it possible to establish the origin of the CEC and to 112
conclude on the existence of isomorphous substitution and presence of minor amounts of 113
smectite (Cases et al., 2000; Villieras et al., 2002; Sayed Hassan et al., 2005). More recently, 114
atomic force microscopy (AFM) was used by Gupta and Miller (2010) to specifically 115
characterize the alumina and the silica layer of the kaol sheet. 116
The purpose of the present study was to investigate the effect of very low layer substitution in 117
kaol on their surface charge properties in aqueous salt solution. Therefore, four “reference” 118
samples were selected for their different origins, and for their low (but not zero) amount of 119
crystal layer substitutions. A sample from Cameroon was included in the study, since it 120
already showed interesting ability for industrial applications, and more precisely as 121
reinforcing phase in composite materials made of cassava starch (Mbey et al., 2012, 2015; 122
Mbey and Thomas, 2015). A consistent analysis of the surface properties of the Mayouom 123
sample may be useful to impulse or ameliorate its potential use in composites making. 124
6 The five samples underwent a broad set of analyses in order to draw an extensive picture of 125
their crystallo-chemical, textural and surface properties at the solid-gas and solid-electrolyte 126
interface. From the literature investigation carry out for this work, no similar work was found. 127
More particularly, the use of the DIS method for such comparative study is a premiere. 128
2. MATERIALS AND METHODS 129
2.1. Kaol samples sources and Na-kaol preparation 130
The sources of the five studied samples are given in table I. The samples were collected 131
through wet sieving over a 40 µm mesh. The cakes obtained after sedimentation were dried in 132
an oven for 24 hours at 70°C prior to use. The particle size distribution of the collected 133
fractions was analysed using a Sympatec laser diffraction granulometer equipped with the 134
HELOS optical system and the WINDOX software for data collection. 135
Sodium exchanged samples (Na-kaol) were prepared by two successive exchanges of 5 g of 136
kaol in 125 mL of 1 M NaCl solution. For the first exchange, the clay sample was stirred in 1 137
M NaCl solution for two hours and the dispersion was centrifuged at 9000 rpm during 10 min. 138
The kaol cake was further dispersed in 1 M NaCl solution and stirred overnight. The clay cake 139
recovered by centrifugation then underwent four washing cycles in deionised water for 140
chloride and excess cations elimination, by alternating dispersion in water and centrifugation 141
at 9000 rpm during 10 min. The elimination of chloride ions from the supernatant was tested 142
using a 0.1 M solution of AgNO3. The final clay cake was oven dried at 50°C during 24 hours 143
and stored in polyethylene bottle prior to subsequent use. 144
2.2. Chemical analysis 145
Chemical analysis for major elements was obtained by inductive coupled plasma by atomic 146
emission spectrometry (ICP-AES) at the Service d’Analyse des Roches et des Minéraux 147
(SARM, Nancy, France). The samples were fused in lithium metaborate (LiBO2) and 148
dissolved in nitric acid prior to analysis. 149
7 2.3. X-ray diffraction
150
Powder X-Ray diffraction patterns on bulk samples were recorded using a D8 Advance 151
Bruker diffractometer equipped with a Co K• radiation (l = 1.7890 Å) operating at 35 kV and 152
45 mA. The diffraction patterns were obtained from 1.5° to 32° at a scanning rate of 1° min-1. 153
For the oriented clay mounts, samples are dispersed in water and left to settle for about 30 154
min in order to select the < 2 µm fraction in the supernatant, according to the Stokes' law. 155
Oriented clay mounts were obtained by depositing drops of supernatant on a glass slide and 156
drying, prior to special treatments including glycolation and firing at 550°C. The XRD 157
patterns of the oriented and treated samples were recorded from 1º to 20º (q). 158
The coherent scattering domain (D) was calculated from X-ray patterns using the full width at 159
maximum half height of the d001 reflection and the Scherrer equation. 160
2.4. Fourier Transform Infrared (FTIR) Spectroscopy. 161
Infrared spectra were recorded in diffuse reflectance mode using a Bruker Fourier Transform 162
Interferometer IFS 55. The spectra, recorded from 4000 cm-1 to 600 cm-1 with a resolution of 163
4 cm-1, are obtained by accumulation of 200 scans. Potassium bromide (KBr) pellets 164
containing ~15% of the powder clay were obtained by pressing (10 tons/cm²) manually 165
ground mixtures of the clay and oven dried potassium bromide. 166
2.5. Electron Microscopy. 167
Transmission electron microscopy coupled with energy dispersive X-Ray spectroscopy 168
(TEM-EDX) was performed on a Philips CM20 microscope operating at 200 kV. 169
2.6. Cation exchange capacity (CEC). 170
The CEC was obtained by saturation of 3 g of clay with hexaaminecobalt(III) ions 171
([Co(NH3)6]3+). The amount of hexaaminecolbalt(III) ions adsorbed by the solid phase, was 172
obtained after evaluation of the remaining Cobalt in the supernatant through colorimetric 173
titration at 472 nm using UV-vis spectroscopy. 174
8 2.7. Nitrogen and Argon adsorption at 77 K.
175
Conventional nitrogen adsorption-desorption isotherms at 77 K were recorded on a step-by-176
step automatic home-built set-up. Pressures were measured using 0-1000 Pa and 0-100,000 Pa 177
Baratron-type pressure sensors provided by Edwards. The nitrogen saturation pressure was 178
recorded in situ using an independent 0-100,000 Pa Baratron-type pressure sensor provided by 179
Edwards. Prior to adsorption, the samples were outgassed overnight at 110°C and under a 180
residual pressure of 0.01 Pa. Nitrogen N55 (purity > 99.9995%) used for experiments was 181
provided by ALPHAGAZ (France). Specific surface areas (SSA) were determined from 182
adsorption data by applying the Brunauer-Emmet-Teller (BET) equation and using 16.3 Å2 183
for the cross sectional area of nitrogen. In the present study, the error in the determination of 184
the SSA was estimated as +/- 1 m2 /g. 185
Low-pressure argon adsorption isotherms of Argon at 77 K were recorded on a home-made 186
automatic quasi-equilibrium volumetric set up (Villiérias et al. 1992, 1997; Bardot et al., 187
1998). The Na-kaol sample was outgassed overnight at 110°C under a residual pressure of 10 -188
4
Pa. High purity Argon (>99.9996%) provided by ALPHAGAZ (France) was used as an 189
adsorbate and introduced continuously through a micro leak. Pressure measurements are 190
performed using two differential pressure gauges (Datametrics) in the 0-10 Torr and 0-1000 191
Torr ranges and 0.1% accuracy. The quasi equilibrium pressures are recorded as a function of 192
time to obtain the adsorption isotherm. More than 2000 data points are collected during the 193
adsorption of the first layer and are plotted as the first derivative of the adsorbed quantity as a 194
function of the logarithm of the relative pressure ln(P/P0), which corresponds to an energy 195
scale (T). The data are analyzed using the theoretical derivative adsorption isotherm 196
summation (DIS), described by Villiéras et al. (1992), to examine surface heterogeneity of the 197
samples. In this method, a heterogeneous surface is assumed to be formed of patch-wise 198
distribution of discrete energetic domains that can be considered locally homogeneous. Thus, 199
9 the total derivative adsorption isotherm can be simulated by the sum of local theoretical 200
derivative adsorption isotherms on each domain (equation 1). 201
!t = "Xi!it (1) 202
where !t is the total adsorption isotherm; !it is the adsorption isotherms on the different 203
energetic domains of the surface; Xi is its fractional contribution to !it. 204
The experimental derivative curve is then fitted using theoretical local isotherms derived from 205
one layer and/or multilayer adsorption formalisms (BET formalism in the case of this study). 206
The total specific surface area is the sum of the monolayer capacities of the various domains, 207
taking into account the cross sectional area of Argon (13.8 Å). 208
2.8. Potentiometric titration. 209
The titration was done after the method proposed by Duc et al., (2006). Typically, the proton 210
surface excess of each Na-kaol was quantified by continuous titration at 25 ± 1°C (the 211
temperature control is ensured by the use of a thermocryostat) using a Titrando 809 titration 212
device equipped with two dosing units (Dosino 800) and a combined pH electrode. The 213
system is driven automatically by the software Tiamo (version 1.2.1 light). All the 214
experiments are conducted under magnetic stirring and under an Argon flow to prevent 215
carbonation. The pH electrode is calibrated with five buffers at the beginning of each test to 216
check the nernstian response. An average of 1g of kaol is mixed with 50 mL of NaNO3 217
electrolyte solution of concentration 10-3 M, 10-2 M and 10-1 M. At first, the pH is increased 218
from natural pH to 9 by addition of NaOH (0.1 M) aliquots, and subsequently decreased to pH 219
3 by addition of HNO3 (0.1 M). The NaOH and HNO3 aliquots addition is controlled by the 220
software between 10 µl and 200 µL (100 µL in the direction of increasing pH). The delay 221
between two consecutive titrant additions is set between 50 s and 600 s for both increasing 222
and decreasing pH pathways. This delay time, after which the pH value is considered as 223
stable, is controlled by the pH drift limit set at 0.5 mV/min in the decreasing direction from 224
10 pH 9 to 3. The data recorded in this range were used to calculate the surface excess curves. A 225
slightly larger pH drift of 1 mV/min is used in the alkaline direction to reach the starting pH 226
of 9. The pH range 3 to 9 was chosen to limit dissolution of the samples. 227
The actual surface excess is calculated as the difference between the amount of H+ or OH -228
consumed by the blank electrolyte and by the suspension at each titration point. A positive 229
sign was attributed to an excess consumption in H+ and a negative sign was attributed to an 230
excess consumption in OH-. The intersection point between the blank and the suspension 231
curves is the point of zero net proton consumption (PZNPC). 232
2.9. Electrophoretic mobility measurement. 233
Electrophoretic mobility of the Na-kaol was measured by micro-electrophoresis. In this 234
technique, a dispersion of particles is placed in a capillary cell and submitted to an electric 235
field. The migration rate of particle due to the electric force is then measured. The 236
measurements were done using a Zetaphoremeter V (CAD Instrumentation). The capillary 237
cell is placed on a microscope and lighted up at 90° by a laser. The dispersion in the cell is 238
submitted to an electric field of 80 V/cm and a CCD camera is used to capture the particle 239
displacement in the cell. The mobility was measured in NaNO3 background (10-3 M, 10-2 M 240
and 10-1 M). Dilute kaol dispersions were prepared by mixing 3 mg to 8 mg of Na-kaol with 241
300 mL of electrolyte solution and stirred overnight. Each dispersion was sonicated for 2 min, 242
large aggregates were left to settle (10 minutes), and the supernatant was used for 243
measurements. The pH was adjusted by adding aliquots of 0.1 M of NaOH or HNO3 before 244
introducing the dispersion in the capillary cell. 245
3. RESULTS AND DISCUSSION 246
3.1. Mineralogy and chemical composition 247
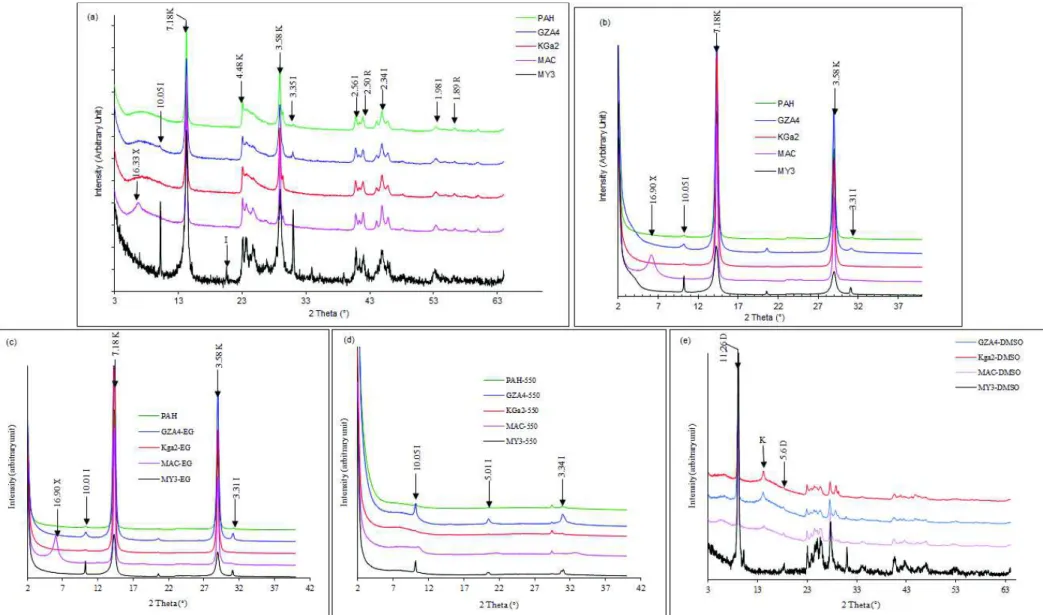
From X-ray diffraction (figure 1), kaol is the dominant mineral in all the samples, together 248
with small amounts of illite/muscovite and titanium oxide. The identification was confirmed 249
11 on the oriented samples (figure 1b), the glycolation (figure 1c) and the thermal treatment at 250
550°C (figure 1c). The reflection at 16.33 Å in the MAC sample, denoted X, was assigned to 251
a possible illite-kaol mixed layer mineral. This conclusion was drawn from glycolation (figure 252
1c), heating at 550°C (figure 1d) and DMSO intercalation (figure 1e) experiments. After 253
glycolation (figure 1c), this reflection is not shifted, which excludes the presence of isolated 254
or interstratified swelling clay sheets. After heating (Figure 1d), the previous conclusion is 255
reinforced due to the absence of the usual collapse of smectite at 10 Å. The DMSO 256
intercalation lead to the formation of characteristic reflection of DMSO-kaol intercalate at 257
11.26 Å and no supplementary mineral phase was observed. All of the previous are in line 258
with the proposed interstratification of illite-kaol at 16.90 Å on the oriented clay mount 259
(figure 1d). This kaol mixed layer is formed of kaol including very small amounts of illite (or 260
even swelling 2:1) as also proposed by Shakarov et al. (1999) in a study on kaol-illite-261
vermiculite mixed layer. Such mixed structure is also proposed by Hong et al. (2015) with 262
d001 value around 13 Å. Such mixed layer are viewed as intermediates phase formed during 263
transformation of illite to smectite, vermiculite and kaol (Hong et al, 2015). 264
The infrared spectra (Figure 2) are typical of kaol. The characteristic bands at 3697, 3666, 265
3651 and 3620 cm#1 (figure 2a) are the stretching bands of O$H bonds in the kaol structure. 266
The band at 3697 cm#1 is assigned to surface O$H, in-phase stretching vibration. The bands 267
at 3666 and 3651 cm#1 are attributed to the surface O$H, out of phase stretching vibration 268
and the band at 3620 cm#1 is known as the inner O-H stretching vibration (Farmer, 1974; 269
Cases et al., 1982; Frost and Johansson, 1998; Frost et al., 2001; Balan, 2010; Mbey et al., 270
2013). These bands are sensitive to cation substitution and planar defects. In the present case, 271
they are reasonably well defined, although less than what can be observed in well-ordered 272
kaol such as GB1 from the St. Austell deposit (Great Britain) (Cases et al., 1982, Balan et al., 273
2010). Thus, the five samples display a relatively well-ordered structure, although partly 274
12 disordered by planar defects such as substitutions, or by intercalation of clay sheets of 275
different nature. The kaol silica Si$O stretching are observed at 1115 cm#1 and the symmetric 276
stretching of Si$O$Si appear at 1016 cm#1. The aluminol bonds of the gibbsite clay sheet are 277
revealed through the bending vibration of Al$OH at 917 cm#1 and the $OH (of Al$OH) 278
translational vibration at 786. The stretching bands of Si$O in quartz (free silica) are also 279
observable at 748 cm#1 and 694 cm#1 (Qtaitat et al., 2005; Al-Trawneh, 2005). The IR spectra 280
of the Na-kaol samples (not presented) exhibit the same characteristic bands. 281
TEM-EDX confirms the kaol-rich nature of all the samples (figure 3) as shown by the Si/Al 282
ratio from EDX which is close to 1 for all samples. Also the shape of the particles is clearly 283
hexagonal as expected for kaol, although less straightforward in MY3, where the particles are 284
significantly smaller than in the other samples, and form cluster aggregates. 285
The chemical analysis (table I) corresponds well to kaol minerals. In particular for the Kga2 286
sample, the data are comparable to that provided in the study by Mermut and Cano (2001). 287
Other elements (P2O5 and TiO2) that are generally associated to kaol are also present. The 288
magnesium content, which could be due to traces of 2:1 clay minerals such as smectite, illite 289
or muscovite, is of interest (taking into account the detection limit of 0.02%) in MAC 290
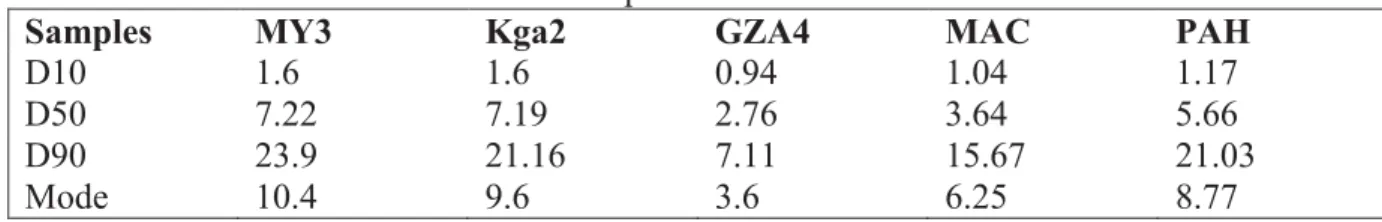
(0.27%), MY3 (0.24%) and GZA4 (0.11%). Particle size analysis (table II), yielded for all 291
samples a D50 below 8 µm and a D90 below 25 µm. The value of D50 indicated relatively 292
high fine kaol fraction content in for all the samples. Using the chemical composition, the 293
structural formula of the kaol phase in each sample was approximated (table III). One should 294
note that, due to the impurities always associated to clay minerals, it is not possible to 295
accurately calculate the structural formulae, hence the proposed formulae are approximates. 296
The calculation procedure is based on the ideal hydroxyl composition and a total of 28 297
negative charges in the crystalline cell structure (Karathanasis, 2008). From the approximate 298
formulae, the presence of stoichiometric defaults are evidence. Coupling the structural 299
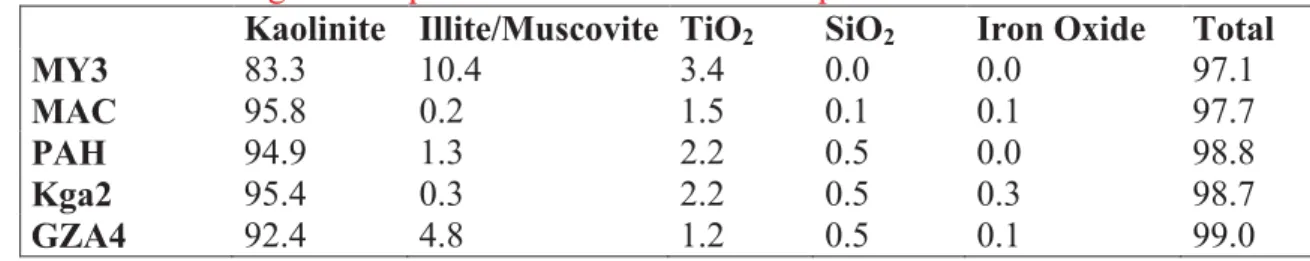
13 formula of the kaol in each sample and the elemental chemical composition, a mineralogical 300
quantification was done assuming the following: TiO2 is a pure phase; K2O is only due to 301
interlayer K in illite/muscovite. The results of the quantification (table IV) indicate that all the 302
samples have a kaol content higher than 80%. Illite content is especially significant in MY3 303
(10.4%) and GZA4 (4.8%). 304
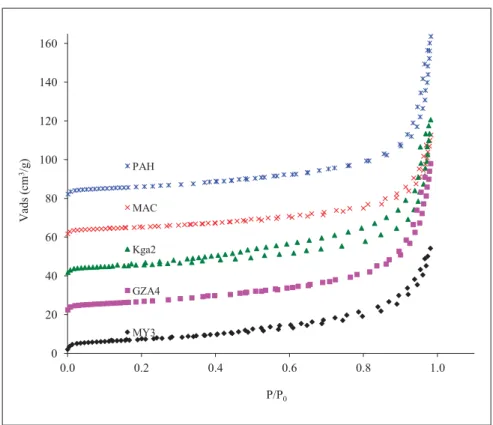
3.2. Texture from Nitrogen adsorption/desorption isotherms 305
The Nitrogen adsorption/desorption isotherms (figure 4) can be classified of type IV 306
according to the IUPAC recommendations (Sing et al., 1985). They exhibit a narrow 307
hysteresis between the adsorption and desorption branch, which is a usual feature for kaol, 308
assigned to beveled shaped mesopores (Sayed Hassan et al., 2005; Delineau, 1994). 309
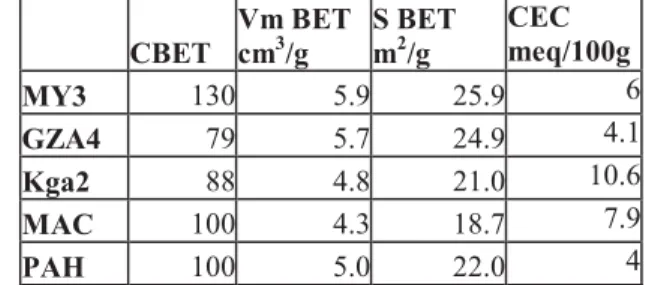
The values of the BET specific surface area (SSA) (table V) indicate absence of significant 310
amount of micropores as suggested by the overall shape of the isotherms. Since the MgO 311
content is assumed here to be related to the presence of traces of swelling 2:1 clay, the SSA of 312
which is generally above 100 m².g-1, one may expect an increase of the SSA with the MgO 313
content. This trend is indeed observed, except for the MAC sample. This exception is not a 314
contradiction, given that the difference may arise also from the crystalline disorder, the size, 315
the shape or the distortion within the clay platelets in each sample. The SSA of MAC also 316
agrees with the absence of swelling clay as previously mentioned from X-Ray analysis. 317
3.3. Surface energetic heterogeneity from DIS analysis of Argon adsorption isotherms. 318
The experimental derivative adsorption isotherms (figure 5) display the feature usually 319
observed for phyllosilicates (Villiéras et al;, 1992; Bardot et al., 1998; Sayed Hassan et al., 320
2005). A major peak is observed at medium adsorption energy (-6 to -1 Ln P/Po), 321
corresponding to the adsorption on basal faces. The broad shoulder at higher energy (< -6 Ln 322
P/Po) corresponds to the adsorption on edge faces. Using DIS, the isotherms were 323
successfully modelled with a sum of six to seven local derivatives (table VI). For all the 324
14 samples, the edge faces were modelled with domains 1 to 3, and the basal faces with domains 325
4 to 6 (table VI). Only MAC and MY3 fall out of this trend, since an additional basal domain 326
(domain 7) was needed. As discussed in previous works (Sayed Hassan et al., 2005; Bardot et 327
al., 1998), domains 1-2 are assigned to high energy adsorption sites of edge faces while 328
domain 3 is characteristic of charged edge faces. The charge heterogeneity of the edge surface 329
is evidenced by these three energy domains. The interactions of cations with basal faces is 330
evidenced by domain 4 (average Ln P/P0 = 4.3) and, from the work by Michot and Villiéras 331
(2002) on synthetic saponite, it can be assumed that the cation density on these sites is less 332
than 1 per 140 Å2. Domain 6 (average Ln P/P0 = 2.4) is assigned to adsorption on basal low 333
energy sites observed for all phyllosilicates. Domain 5 parameters are characteristic for the 334
adsorbed cations and agree (as well as the parameters of domain 4 and 3) with the reported 335
value for Na-kaol in a previous study (Sayed Hassan et al., 2005). The additional domain 7 336
(Ln P/P0 = -4.6) for MAC and MY3 is probably due to the surface charge of associated sheets 337
of smectite or illite-like clay mineral (Sayed Hassan et al., 2005). Given that the MgO 338
contents of these two samples were the highest compared to the other three samples, smectite 339
clay layers are the most likely to be considered. 340
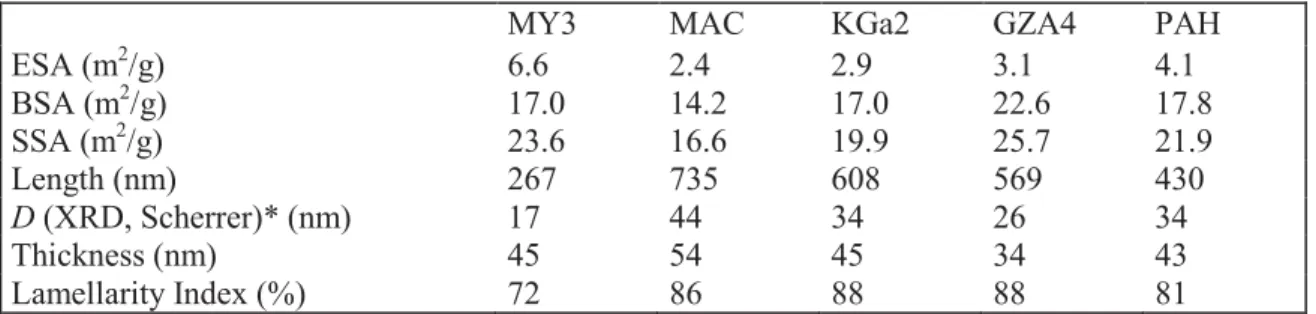
The geometrical and structural information drawn from the measured basal and edge surface 341
areas (BSA and ESA) are reported in table VII. The SSAs calculated from DIS are in the 342
same order of magnitude as the classical N2 BET SSA (average difference +1.3 m2/g for the 343
classical N2 BET SSA). The fact that the N2 BET SSAs are larger is often observed given that 344
N2 exhibits stronger interactions than Ar with adsorption sites (Bardot et al., 1998; Michot et 345
Villiéras, 2002). As reported by Sayed Hassan et al. (2005), the basal surface area is not 346
influenced by the nature of the cation and thus the cation density on this surface is probably 347
low. Hence, one may assume that the difference in edge surface area is likely to be an 348
15 indication for the edge surface charge available for each sample, which should be supported 349
by the titration results. 350
The thickness and diameter of particles are calculated using geometrical equations reported by 351
Sayed Hassan et al. (2005). The edge surface area (ESA) and the basal surface (BSA) are used 352
to compute, respectively, the length and the thickness. Although the coherent scattering 353
domain and the thickness of the particles are different concepts, they can be identical in size 354
for true nano-crystalline powder were each grain represent a coherent domain. That is why the 355
grain size is usually larger than the coherent scattering domain. Comparing the calculated 356
thickness values with the coherent scattering domain (D, in table VII) shows that the largest 357
difference is 28 nm for the sample MY3, whereas it remains less that 10 nm for the other 358
samples. From kinematical theory, this differences indicates that the crystallites are strain free 359
for all the samples (Ungar et al., 2005). In addition, the fact that the size of the coherent 360
domains follows the same trends as the particle size is a proof of the reliability of the DIS 361
modeling. The lamellarity index which corresponds to the percentage of BSA, is lowest for 362
the MY3 samples. The higher ESA observed for this sample may arise from two sources: (i) 363
the illite contribution to ESA or (ii) the more anisotropic shape of this sample particles. If a 364
contribution from illite is assumed, then the ESA of GZA4 would be expected to be the 365
following higher value, but this is not the case. It is then believed that the kaolinite particles 366
anisotropy could be a better cause. According to TEM observation, the anisotropy is higher 367
for MY3 (figure 3) and this may be an a priori evidence for the previous assumption. 368
3.4. Electrokinetics. 369
Assuming that protonation-deprotonation on edge hydroxyls is the dominant origin of surface 370
charge in kaol implies that, as for simple oxides, their electrophoretic mobility should depend 371
on the pH and on the ionic-strength (lowest mobility at highest ionic strength), and the 372
mobility curves should cross at a common point close to zero mobility. However, from the 373
16 results in figure 6 (left column for the raw kaol and right column for the corresponding Na-374
kaol), only for PAH-Na a common intersection point may be fairly proposed, close to pH 4. 375
For the other samples, the observed trend is not consistent with the expected one, in particular 376
for the MAC, GZA4 and MY3 samples, for which the mobility curves are almost parallel to 377
the pH axis. Such a behavior is close to that observed for permanently charged clay minerals 378
such as smectites (Thomas et al., 1999). Indeed, a permanent charge originating from 379
isomorphic substitutions was evidenced from the calculated structural formula of all the 380
studied samples (see table IV). As reported by other authors (Tombácz and Szekeres, 2006), 381
the permanent charge dominates the electrokinetic behavior. In the case of MY3, GZA4 and 382
MAC, the more marked permanent charge behavior is consistent with the presence of 383
associated smectite layers as shown from the chemical analysis (table II) where significant 384
amounts of MgO and CaO (associated to exchangeable Calcium in smectites) were measured. 385
The domain 7 from DIS analysis (table VII) is in line with the proposed presence of few 386
smectite layers in MAC and MY3. 387
3.5. Charge on amphoteric surface sites. 388
The surface excess values yielded by acid-base titration was normalized to the edge surface 389
area (ESA) obtained from DIS (figure 7). Although a clear separation between the protolytic 390
reactions at edge and basal sites and the ion exchange on permanent negative sites is not 391
strictly possible, normalization to ESA is still pertinent for comparison, since it is assumed 392
that protolytic edge reactions are well evidenced by titration. In the absence of permanent 393
charge, and by analogy with common (hydro)oxides, the titration curves are expected to 394
display dependence on the pH and on the ionic strength (highest surface excess at lowest ionic 395
strength), and a common intersection point indicating the Point of Zero Charge (PZC). Such 396
behavior was observed only for PAH-Na which exhibited a common intersection point at pH 397
close to 3.5 (figure 7e). The titration curves of the four other samples were shifted towards 398
17 higher pH according to decreasing ionic strength, as observed by Duc et al., (2006) and 399
modelled by Delhorme et al., (2010) for smectite and illite. An explanation for such 400
differences cannot be derived from the geometrical parameters (table VII) obtained using DIS 401
model, but rather from the structural differences between the samples. The permanent charge 402
electrostatically affects the dissociation of the edge sites by increasing the affinity for the 403
protons (Avena et al., 2003; Kraepiel et al., 1999; Delhorme et al., 2010), the amount of 404
titrated charge is likely to decrease with increasing permanent layer charge. The samples 405
MY3 (figure 7a), MAC (figure 7b) and GZA4 (figure 7c) have values for surface charge 406
ranging between 7 and 8 µmol/m2 which may be of same range within experimental error and 407
indicative of significant permanent charge as also observed from their electrokinetic feature 408
(figure 6) which is similar to that of permanently charged minerals. Sample PAH with surface 409
excess from titration of 10 µmol/m2 may be the least permanently charged as shown by its 410
mobility feature which depends on pH. The Kga2 sample is intermediate with a titration 411
charge of about 9 µmol/m2. For all the samples, the values of surface excess range in a narrow 412
interval from 7 to 10µmol/m2 and are associated to the kaol nature of the samples. The 413
difference amongst the samples may arise from the basal surface contribution which is 414
probably in line with the layer charge. 415
A low dependency of the titration curves to ionic strength is observed trough the slight split of 416
the curves upon ionic strength increase. This dependency is coherent with the existence of a 417
permanent negative charge as reported for 2:1 clay minerals (Duc et al., 2005b, 2006; 418
Tombácz and Szekeres, 2006). The point of zero salt effect (PZSE), which is reached as the 419
common intersection of the curves at different ionic strength, is only observed for the PAH 420
sample at pH~3.5. The trends of the curves for the other samples indicates a PZSE beyond pH 421
3. The point of zero net proton charge (PZNPC), which is the point at which the proton charge 422
goes to zero, is not unique, but rather ionic strength dependent, for all the samples. In 423
18 theoretical studies (Avena et al., 2003; Kraepiel et al., 1999), the absence of a PZNPC is 424
shown to be due to the effect of the structural charge on dissociable edge sites. For ionic 425
strength 0.01 M and 0.001 M, a common intersection for zero net proton charge exist for all 426
the samples except for PAH within the pH interval (3.8 to 6.4). As reported by Chorover and 427
Sposito (1995), because the PZNPC within our samples is ionic strength dependent (decreases 428
to lower pH as the ionic strength increases) then this is an evidence for a permanent negative 429
charge within these kaol. Because of the existence of this net permanent charge, no 430
coincidence between the PZNPC and the PZSE is observed. This is also agreeing with the 431
absence of PZC (in the studied pH range) (see figure 7) which is assumed to exist when 432
PZNPC = PZSE (Sposito, 1989). 433
4. CONCLUSION 434
Examination of a broad set of properties on five kaol samples yields valuable information on 435
the relationships between the crystal-chemical defects and the surface charge in electrolyte 436
dispersion. The combination of these results allows the build-up of a consistent image of the 437
morphological, structural, textural and surface properties of the studied kaol. Although most 438
of the evidences are indirect and dispersed, some conclusions can be proposed: 439
- The permanent layer charge, resulting from non-negligible rates of substitution and 440
stoichiometric defaults cause the titration curves to shift to lower pH with increasing ionic 441
strength (MY3, MAC or GZA4 in particular); the proton consumption (due to pH-dependent, 442
or variable charge) is influenced electrostatically by the layer charge which (even if low) and 443
dominates the electrokinetic behavior; 444
- The DIS modeling was useful to probe presence of associated smectite-like minerals in 445
samples MY3 and MAC. The presence of few 2:1 layers at the surface, after milling and 446
dispersion of the sample, may affect the electrokinetic properties (MAC and MY3 samples); 447
19 - Modeling parameters derived from DIS are consistent with reported parameters for 448
phyllosilicates. However, a clear link between the electrophoretic mobility and/or protolytic 449
charge data and the geometrical parameters from DIS was not evidenced; 450
- In interfacial processes, the reactivity of kaol is controlled by its permanent charge. The 451
negative electrophoretic mobility indicates that colloids stability will be controlled 452
electrostatically by cations, hence given the low measured charges, delamination of kaol for 453
particle size reduction may be useful to improve colloid stability. 454
The Cameroonian sample (MY3) is found to be a very fine kaol material with large specific 455
surface area and high shape anisotropy, associated with significant layer charge. These factors 456
may influence the particle orientation and particle-particle interaction in a composite material, 457
depending on the charge feature of the associated compound. 458
A final remark can be that the purity of natural kaol can hardly be improved for analytical 459
purposes because, unlike smectites, their particle size and shape prevent effective separation 460
by centrifugation. 461
20 Acknowledgements
463
The first author is grateful to the French Ministry of Research and Higher Education for 464
awarding a PhD grant. He acknowledges Odile Barrès, Renaud Gley, Lise Salsi, and Yves 465
Waldvogel for training and technical assistance in FTIR, XRD and electrophoretic 466
measurements. 467
Laurent Michot is acknowledged for fruitful remarks and discussions during the preparation 468
of the manuscript. 469
21 References
471
Angove M.J., Johnson B.B. & Wells J.D. (1997) Adsorption of cadmium(II) on kaolinite. 472
Colloids and Surfaces A: Physicochemical and Engineering Aspects, 126,137-147 473
Angove M.J., Johnson B.B. & Wells J.D. (1998) The Influence of Temperature on the 474
Adsorption of Cadmium (II) and Cobalt (II) on Kaolinite. Journal of Colloid and Interface 475
Science, 204, 93–103. 476
Appel C., Ma L. Q. & Rhue R.D. (2003) Point of zero charge determination in soil and 477
minerals via traditional methods and detection of electroacoustic mobility. Geoderma, 113, 478
77-93. 479
Avena, M.J., Mariscal, M.M. & De Pauli, C.P. (2003) Proton binding at clay surfaces in
480
water. Applied Clay Science, 24, 3–9.
481
Balan E., Delattre S., Guillaumet M. & Salje E. K.H. (2010) Low-temperature infrared 482
spectroscopic study of OH-stretching modes in kaolinite and dickite. American 483
Mineralogist, 95, 1257–1266. 484
Bardot F., Villiéras F., Michot L.J., François M., Gérard G. & Cases J.M. (1998) High 485
resolution gas adsorption study on illites permuted with various cations assessment of 486
surface energetic properties. Journal of dispersion science and technology, 19 (6-7), 739-487
759. 488
Bergaya, F., Theng, B.K.G. & Lagaly, G. (2006) Clays in Industry. Pp 499-621 in: Handbook 489
of Clay Science (F.Bergaya, B.K.G. Theng, G. Lagaly, editors), Elsevier, Amtersdam. 490
Bolland M.D.A., Posner A.M. & Quirk J.P., (1980) PH-independent and pH-dependent 491
surface charges on kaolinite. Clays and Clay Minerals, 28, 412-418. 492
Brady, P.V., Cygan, R.T. & Nagy, K.L. (1996) Molecular controls on kaolinite surface
493
charge. Journal of Colloid Interface Science, 183, 356–364.
22 Cases J.M., Lietard O, Yvon J. & Delon J.F. (1982) Etude des propriétés cristallochimiques, 495
morphologiques, superficielles de kaolinites désordonnées. Bulletin de Mineralogie, 105, 496
439-455. 497
Cases J.M., Villiéras F. & Michot L.J., (2000) Les phénomènes d’adsorption, d’échange ou de 498
rétension à l’interface solide-solution aqueuse. C.R. Acad. Sci. Paris, Sciences de la terre et 499
des planets, 763-773. 500
Chassagne C., Mietta F. & Winterwerp J.C. (2009). Electrokinetic study of kaolinite 501
suspensions. Journal of colloid and interface science, 336, 352-359. 502
Chorover J. and Sposito G. (1995) Surface charge characteristics of kaolinitics tropical soils. 503
Geochimica et Cosmochimica Acta, 59, 875-884. 504
Delhorme M., Labbez C., Caillet C. & Thomas F. (2010) Modelling acid-base properties of 505
2:1 clays. The role of electrostatics. Langmuir, 26, 240-9249. 506
Delineau T. (1994) Les argyles kaoliniques du bassin de charentes (France): Analyses 507
typologiques, cristallochimique, speciation du fer et applications. Thèse de Dotorat, INPL-508
Nancy (France), 627p. 509
Dubreuilh J., Marchadour P. & Thiry M., (1984) Cadre geologique et mineralogy des argiles 510
des charentes, France. Clay Minerals, 19, 29-41. 511
Duc M., Thomas F. & Gaboriaud F. (2005a) Sensitivity of the acid-base properties of clays to 512
the methods of preparation and measurement 1. Literature review. Journal of Colloid and 513
Interface Science, 289, 139-147. 514
Duc M., Thomas F. & Gaboriaud F. (2005b) Sensitivity of the acid-base properties of clays to 515
the methods of preparation and measurement 2. Evidence from continuous potentiometric 516
titrations. Journal of Colloid and Interface Science, 289, 148-156. 517
23 Duc M., Thomas F. & Gaboriaud F., (2006) Coupled chemical processes at clay/electrolyte 518
interface: A batch titration study of Na-montmorillonites. Journal of Colloid and Interface 519
Science, 300, 616-625. 520
Farmer V.C., (1974). The layer silicates in: The Infrared spectra of minerals (Farmer VC, 521
editor). London: Mineralogical Society, 331-363. 522
Frost R. & Johansson U. (1998) Combination of bands in the infrared spectroscopy of kaolins. 523
A DRIFT spectroscopic study. Clays and Clay Minerals, 46, 466-477. 524
Frost R.L., Makó É., Kristóf J., Horváth E. & Kloprogge J.T. (2001) Modi•cation of kaolinite 525
surfaces by mechanochemical treatment. Langmuir, 17, 4731–4738. 526
Gupta V. & Miller J. D. (2010) Surface force measurements at the basal planes of ordered 527
kaolinite particles. Journal of Colloid and Interface Science, 344, 362-371. 528
Herrington T.M., Clarke A.Q. & Watts J.C. (1992) The surface charge of kaolin. Colloids and 529
surfaces, 68, 161-169. 530
Hong H., Cheng F. Yin K. Churchman G. J. and Wang C. (2015). Three-component mixed-531
layer illite-smectite-kaolinite (I/S/K) minerals in hydromorphic soils, south China. American 532
Mineralogist, 100 (8-9), 1883-1891. 533
Huertas F.J., Chou L. & Wollast R. (1998) Mechanism of kaolinite dissolution at room 534
temperature and pressure: Part1. Surface speciation. Geochimica et Cosmochimica acta, 62, 535
417-431. 536
Ikhsan J., Johnson B.B. & Wells J.D. (1999) A Comparative study of the adsorption of 537
transition metals on kaolinite. Journal of Colloid and Interface Science, 217, 403-410. 538
Karathanasis A.D. (2008) Structural allocation of clay mineral elemental components. Pp
539
465-483 in Methods of Soil analysis. Part 5. Mineralogical methods (A. L. Ulery & L. R.
540
Drees editors), SSSA Book Series No 5, USA.
24
Kraepiel, A.M.L., Keller, K. & Morel, F.M.M. (1998) On the acid–base chemistry of
542
permanently charged minerals. Environmental Science and Technology, 32, 2829–2838.
543
Kraepiel A.M.L., Keller K., & Morel F.M.M. (1999) A Model for Metal Adsorption on 544
Montmorillonite. Journal of Colloid and Interface Science, 210, 43-54. 545
Kosmulski M. & Dahlsten P. (2006) High ionic strength electrokinetics of clay minerals. 546
Journal of Colloid and Interface Science, 291, 212-218. 547
Ma C. & Eggleton R.A. (1999a) Cation exchange capacity of kaolinite. Clays and Clay 548
Minerals, 47, 181-191. 549
Ma C. & Eggleton R.A (1999b) Surface layer type of kaolinite: A high-resolution 550
transmission electron microscope study. Clays and Clay Minerals, 47, 181-191. 551
Mbey J.A., Thomas F., Ngally Sabouang C.J., Liboum & Njopwouo D. (2013) An insight on 552
the weakening of the interlayer bonds in a Cameroonian kaolinite through DMSO 553
intercalation. Applied Clay Science, 83-84, 327–335. 554
Mbey J. A., Hoppe S. & Thomas F. (2015) Cassava starch-kaolinite composite films. Thermal 555
and mechanical properties related to filler-matrix interactions. Polymer Composites, 36, 184-556
191. 557
Mbey J. A. & Thomas F. (2015) Components interactions controlling starch-kaolinite 558
composite films properties. Carbohydrate Polymers, 117, 739-745. 559
Mbey J. A., Hoppe S. & Thomas F. (2012) Cassava starch-kaolinite composite film. Effect of 560
clay content and clay modification on film properties. Carbohydrate Polymers, 88, 213-22. 561
Menezes R.A., Paz S.P.A., Angélica R.S.A., Neves R.F., Neumann R., Faulstich F.R.L. & 562
Pergher S.B.C. (2017) Synthesis of ultramarine pigments from Na-A zeolite derived from 563
kaolin waste from the Amazon. Clay Minerals, 52, 83 – 95. 564
Mermut A.R. and Cano A. G. (2001) Baseline studies of the clay minerals society source 565
clays: chemical analyses of major elements. Clays and Clay Minerals, 49(5), 381–386. 566
25 Michot L.J. & Villiéras F. (2002) Assessment of surface energetic heterogeneity of synthetic 567
Na-saponites. The role of layer charge. Clay Minerals, 37, 39-57. 568
Moll W.F. Jr. (2001) Baseline studies of the clay minerals society source clays: geological 569
origin. Clays and Clay minerals, 49, 374-380. 570
Murray H. H., (1988) Kaolin Minerals: their genesis and occurrences. Pp. 67-89 in Hydrous 571
Phyllosilicates (S.W. Bailey, editor), Mineralogical Society of America. 572
Njoya A., Nkoumbou C., Grosbois C., Njopwouo D., Njoya D., Courtin-Nomade A., Yvon J., 573
and Martin F. (2006). Genesis of Mayouom kaolin deposit (western Cameroon). Applied 574
Clay Science, 32, 125-140. 575
Qtaitat M.A. & Al-Trawneh I.N. (2005) Characterization of kaolinite of the Baten El-Ghoul 576
region/south Jordan by infrared spectroscopy. Spectrochimica Acta Part A: Molecular and 577
Biomolecular Spectroscopy, 61, 1519–1523. 578
Rowlands W.N. & O’brien R.W. (1995) The Dynamic Mobility and Dielectric Response of 579
Kaolinite Particles. Journal of Colloid and Interface Science, 175, 190-200. 580
Sakharov B. A., Lindgreen H., Salyn A. L., and Drits V. A., (1999) Mixed-layer kaolinite-581
illite-vermiculite in North Sea shales. Clay minerals, 34, 333-344. 582
Sayed Hassan M., Villiéras F., Razafitianamaharavo A. & Michot L.J. (2005) Role of 583
exchangeable cations on geometrical and energetic surface heterogeneity of kaolinites. 584
Langmuir, 21, 12283-12289. 585
Schofield R. K. & Samson H. R. (1954) Flocculation of kaolinite due to the attraction of 586
oppositely charged crystal faces. Discussion of the Faraday Society, 18, 135-145. 587
Schroeder P.A. & Shiflet J. (2000) Ti-bearing phases in the Huber formation, an east gorgia 588
kaolin deposit. Clays and Clay minerals, 48, 151-158. 589
Schroth B.K. & Sposito B. (1997) Surface charge properties of kaolinite. Clays and Clay 590
mineral, 45, 85-91. 591
26 Sing K.S.W., Everett D.H., Haul R.A.W., Moscou L., Pierotti R.A., Rouquérol J. & 592
Siemieniewska T. (1985) Reporting physisorption data for gas/solid systems with special 593
reference to the determination of surface area and porosity. Pure and Applied Chemistry, 57, 594
603-619. 595
Sposito G. (1989) Surface reaction in natural aqueous colloidal system. Chimica, 43, 169-176. 596
Tertre E., Castet S., Berger G., Loubet M. & Giffaut E. (2006) Surface chemistry of kaolinite 597
and Na-montmorillonite in aqueous electrolyte solution at 25 and 60°C: Experimental and 598
modelling study. Geochimica et Cosmochimica acta, 70, 4579-4599. 599
Thomas F., Michot L.J., Vantelon D., Montargès E., Prélot B., Cruchaudet M. & Delon J.F. 600
(1999) Layer charge and electrophoretic mobility of smectites. Colloids and Surfaces, 159, 601
351-358. 602
Thomas F., Prélot B., Villiéras F. & Cases J.M. (2002) Electrochemical properties at the 603
aqueous-solid interface and heterogeneity of surface. C.R. Geoscience, 334, 633-648. 604
Tombácz E. & Szekeres M. (2006). Surface charge heterogeneity of kaolinite in aqueous
605
suspension in comparison with montmorillonite. Applied Clay Science, 34, 105-124.
606
Ungár, T., Tichy, G., Gubicza, J. and Hellmig, R. J. (2005). Correlation between subgrains 607
and coherently scattering domains. Powder Diffraction, 20(4), 366-375. DOI: 608
10.1154/1.2135313 609
Villieras F., Case J.M., François M., Michot L.J. & Thomas F. (1992) Texture and surface 610
energetic heterogeneity of solids from modelling of low pressure gas adsorption isotherms. 611
Langmuir, 8, 1789-1795. 612
27 Villieras F., Michot L.J., Bardot F., Cases J.M., François M., and Rudzinski W., (1997). An 613
improved derivative isotherm summation method to study surface heterogeneity of clay 614
minerals. Langmuir, 13, 1104-1117. 615
Villieras F., Michot L.J., Bardot F., Chamerois M., Eypert-Blaison C., François M., Gérard G. 616
and Cases J.M., (2002). Surface heterogeneity of minerals. C.R. Geoscience, 334, 597-609. 617
Williams D. J. A. & Williams K. P., (1978) Electrophoresis and zeta potential of kaolinite. 618
Journal of Colloid and Interface science, 65, 79-87. 619
Zhou Z. & Gunter W.D. (1992) The nature of the surface charge of kaolinite. Clays and Clay 620
Minerals, 40, 365-368. 621
Zhu X., Zhu Z., Lei X., Yan C. (2016) Defects in structure as the sources of the surface 622
charges of kaolinite, Applied Clay Science, 124–125, 127–136. 623
Surface properties of five natural kaolinite samples are analyzed > Deviation from stoichiometric defaults and some substitutions are evidenced from chemical analyses > The permanent charge electrostatically influence the proton consumption during acid-base titration > Electrokinetic behavior is dominate by the permanent charge > From the DIS modeling the presence of trace 2:1 clay layer on some samples was probe.
Table II: Size distribution of the kaol samples
Samples MY3 Kga2 GZA4 MAC PAH
D10 1.6 1.6 0.94 1.04 1.17
D50 7.22 7.19 2.76 3.64 5.66
D90 23.9 21.16 7.11 15.67 21.03
Mode 10.4 9.6 3.6 6.25 8.77
Table 2
Table III: Structural formulae of the studied kaolinites, calculated from chemical analysis
Average structural formula
MY3 (Al1.94 Fe0.06)(Si1.98 Fe0.02)O5(OH)4Ca0.002 Mg0.02 MAC (Al1.94Si0.02Fe0.01Mg0.02Ca0.01)(Si2O5)(OH)4 PAH (Al1.98Fe0.02)(Si1.98 Fe0.02)O5(OH)4
Kga2 (Al1.98Fe0.02)(Si1.99 Fe0.01)O5(OH)4 (Fe0.01) GZA4 (Al1.95Fe0.04Ca0.01)(Si1.99 Mg0.01)O5(OH)4
Table 3
Table IV: Mineralogical composition of the kaolinite samples
Kaolinite Illite/Muscovite TiO2 SiO2 Iron Oxide Total
MY3 83.3 10.4 3.4 0.0 0.0 97.1 MAC 95.8 0.2 1.5 0.1 0.1 97.7 PAH 94.9 1.3 2.2 0.5 0.0 98.8 Kga2 95.4 0.3 2.2 0.5 0.3 98.7 GZA4 92.4 4.8 1.2 0.5 0.1 99.0 Table 4
Table V: Specific Surface Area (±1 m2/g ) and CEC of the kaol samples CBET Vm BET cm3/g S BET m2/g CEC meq/100g MY3 130 5.9 25.9 6 GZA4 79 5.7 24.9 4.1 Kga2 88 4.8 21.0 10.6 MAC 100 4.3 18.7 7.9 PAH 100 5.0 22.0 4
Vm : monolayer volume from BET modeling; CBET: BET constant Table 5
Table VI: Main parameters derived from the application of the DIS method to argon adsorption at 77 K on Na-exchanged kaolinites.
MY3 MAC Kga2 GZA4 PAH
Domain 1 ln(P/P0) -13.3 -12.6 -12.7 -12.0 -13.1 Vm 0.16 0.06 0.04 0.06 0.10 w/kt 1.2 0.4 0.0 0.0 0.0 Domain 2 ln(P/P0) -10.3 -10.3 -10.5 -10.6 -10.5 Vm 0.52 0.11 0.13 0.11 0.18 w/kt -0.7 0.2 0.0 0.0 0.0 Domain 3 ln(P/P0) -6.9 -7.0 -6.8 -6.9 -6.9 Vm 1.10 0.47 0.60 0.68 0.82 -0.2 -0.10 -0.8 -0.8 -0.8 Domain 4 ln(P/P0) -4.2 -4.2 -4.3 -4.4 -4.3 Vm 1.87 0.69 2.58 3.65 2.54 w/kt 1.5 1.8 1.5 2 1.5 Domain 5 ln(P/P0) -3.6 -3.6 -3.6 -3.5 -3.6 Vm 0.35 0.07 0.76 1.24 0.85 w/kt 1.5 1.8 1.5 1.5 1.5 Domain 6 ln(P/P0) -2.4 -2.4 -2.4 -2.3 -2.4 Vm 1.29 1.29 1.24 1.21 1.39 w/kt 0.0 0.0 0.0 0.0 0.0 Domain 7 ln(P/P0) -4.5 -4.6 Vm 1.07 1.77 w/kt 1.5 1.8 Table 6
Table VII: Geometrical and structural parameters deducted from application of DIS to Argon adsorption at 77 K on Na-kaolinites. The thickness obtained by the Scherrer equation from X-ray diffraction of the powder is given for comparison.
* D is the Scattering Coherent Domain calculated from X-ray pattern using the full width at maximum half-height of the d001 diffraction peak and the Scherrer equation.
MY3 MAC KGa2 GZA4 PAH
ESA (m2/g) 6.6 2.4 2.9 3.1 4.1 BSA (m2/g) 17.0 14.2 17.0 22.6 17.8 SSA (m2/g) 23.6 16.6 19.9 25.7 21.9 Length (nm) 267 735 608 569 430 D (XRD, Scherrer)* (nm) 17 44 34 26 34 Thickness (nm) 45 54 45 34 43 Lamellarity Index (%) 72 86 88 88 81 Table 7
Table I: Sources and chemical composition (percentages of oxides of the major elements) of the kaolinite samples
Samples MY3 GZA4 Kga2 MAC PAH
Sources Cameroon (Mayouom) Njoya et al., 2006 France (Charentes) Dubreuilh et al., 1984 USA (Georgia) Moll, 2001 USA (Macon, Georgia) Schroeder and Shiflet, 2000 USA (Georgia) Schroeder and Shiflet, 2000 Chemical Composition SiO2 44.28 45.47 43.89 45.20 44.33 Al2O3 34.21 36.66 37.37 36.65 37.34 Fe2O3 1.97 1.27 1.17 0.44 1.13 MnO 0.01 0.00 0.00 0.00 0.00 MgO 0.24 0.11 0.03 0.27 0.05 CaO 0.04 0.18 < L.D 0.26 < L.D Na2O < L.D 0.04 < L.D < L.D < L.D K2O 1.23 0.57 0.04 0.02 0.15 TiO2 3.39 1.21 2.17 1.50 2.18 P2O5 0.26 0.06 0.05 < L.D 0.05 LOI 13.70 14.01 14.29 14.67 14.40 Total 99.33 99.59 99.01 99.01 99.63
L.D: detection limit; LOI: loss on ignition Table 1
Figure 1: DRX pattern of the raw kaolinite samples: (a) bulk sample (< 40 µm) (b) oriented samples (< 2 µm) (c) Ethylene glycol solvated samples (d) Heated samples at 550 °C (e) DMSO intercalated samples
Figure 1
Figure 2: FTIR spectra of the kaolinite samples (a) the entire spectra (b) zooming in the OH elongation vibration domain.
600 1100 1600 2100 2600 3100 3600 wavenumber (cm-1) PAH GZA4 KGa2 MAC MY3 3 4 2 7 OH (Kaolinite) 1 9 1 5 1 8 1 6 1 6 2 5 1 0 1 6 1 1 1 1 9 1 7 7 8 6 69 4 7 4 8 3550 3600 3650 3700 3750 3 6 2 0 3 6 5 1 3 6 6 6 3 6 9 7 (a) (b) Figure 2
Fig. 3: TEM-EDX showing and Si/Al ratio of almost 1 for all the samples. Figure 3
Curves shifted of 20 cm3/g
Fig. 4: N2 Adsorption isotherms at 77 K on the kaolinite samples 0 20 40 60 80 100 120 140 160 0.0 0.2 0.4 0.6 0.8 1.0 V ad s (c m 3/g ) P/P0 PAH MAC Kga2 GZA4 MY3 Figure 4
Fig. 5: Experimental derivative argon adsorption isotherms at 77 K of the Na-kaolinites Figure 5
Figure 6
Fig. 6: Electrophoretic mobility versus pH on raw (left) and Na-Kaolinite (right) in NaNO3 background
Figure 7: Apparent surface charge of the Na-exchanged kaolinite samples in NaNO3 background, normalised to the edge surface area obtained from DIS modeling
(e)
Figure 7