HAL Id: hal-02351306
https://hal.archives-ouvertes.fr/hal-02351306
Submitted on 17 Nov 2020
HAL is a multi-disciplinary open access
archive for the deposit and dissemination of
sci-entific research documents, whether they are
pub-lished or not. The documents may come from
teaching and research institutions in France or
abroad, or from public or private research centers.
L’archive ouverte pluridisciplinaire HAL, est
destinée au dépôt et à la diffusion de documents
scientifiques de niveau recherche, publiés ou non,
émanant des établissements d’enseignement et de
recherche français ou étrangers, des laboratoires
publics ou privés.
Impact of clumping on core-collapse supernova radiation
L. Dessart, D. Hillier, K. Wilk
To cite this version:
L. Dessart, D. Hillier, K. Wilk. Impact of clumping on core-collapse supernova radiation. Astronomy
and Astrophysics - A&A, EDP Sciences, 2018, 619, pp.A30. �10.1051/0004-6361/201833278�.
�hal-02351306�
Astronomy
&
Astrophysics
https://doi.org/10.1051/0004-6361/201833278
© ESO 2018
Impact of clumping on core-collapse supernova radiation
L. Dessart
1, D. J. Hillier
2and K. D. Wilk
21Unidad Mixta Internacional Franco-Chilena de Astronomía (CNRS, UMI 3386), Departamento de Astronomía, Universidad de Chile, Camino El Observatorio 1515, Las Condes, Santiago, Chile
e-mail: [email protected]
2Department of Physics and Astronomy & Pittsburgh Particle Physics, Astrophysics, and Cosmology Center (PITT PACC), University of Pittsburgh, 3941 O’Hara Street, Pittsburgh, PA 15260, USA
Received 22 April 2018 / Accepted 07 August 2018
ABSTRACT
There is both observational and theoretical evidence that the ejecta of core-collapse supernovae (SNe) are structured. Rather than being smooth and homogeneous, the material is made of over-dense and under-dense regions of distinct composition. Here, we have explored the effect of clumping on the SN radiation during the photospheric phase using 1D non-local thermodynamic equilibrium radiative transfer and an ejecta model arising from a blue-supergiant explosion (yielding a Type II-peculiar SN). Neglecting chemical segregation, we adopted a velocity-dependent volume-filling factor approach that assumes that the clumps are small but does not change the column density along any sightline. We find that clumping boosts the recombination rate in the photospheric layers, leading to a faster recession of the photosphere, an increase in bolometric luminosity, and a reddening of the SN colors through enhanced blanketing. The SN bolometric light curve peaks earlier and transitions faster to the nebular phase. On the rise to maximum, the strongest luminosity contrast between our clumped and smooth models is obtained at the epoch when the photosphere has receded to ejecta layers where the clumping factor is only 0.5 – this clumping factor may be larger in nature. Clumping is seen to have a similar influence in a Type II-Plateau SN model. As we neglected both porosity and chemical segregation, our models underestimate the true impact of clumping. These results warrant further study of the influence of clumping on the observables of other SN types during the photospheric phase.
Key words. radiative transfer – radiation: dynamics – supernovae: general – supernova: individual: SN 1987A
1. Introduction
The diversity of core-collapse supernova (SN) light curves arises from variations in the properties of the shocked progenitor enve-lope, and the subsequent balance between heating (radioactive decay and recombination) and cooling (expansion and radia-tion) processes (e.g., Falk & Arnett 1977). In the explosion of red-supergiant (RSG) stars which lead to Type II-Plateau SNe, the escaping radiation is dominated for several months by the release of the original shock-deposited energy, which is modestly degraded by expansion cooling. In the explosion of the more compact blue-supergiant (BSG) stars, which lead to Type II-peculiar SNe, the stronger expansion cooling produces a fainter SN at early times. The timescale and rate at which the SN subse-quently brightens bears critical information about the mass and extent of the hydrogen envelope, the amount and distribution of 56Ni, ejecta symmetries, and other progenitor and explosion properties (e.g.,Arnett et al. 1989;Wongwathanarat et al. 2015). Because of the massive and more extended H-rich envelope, this information is harder to decipher in Type II-Plateau SNe, although some information can be gleaned from polarization studies (e.g.,Leonard et al. 2006).
There is both observational and theoretical evidence that the ejecta of core-collapse SNe, and SN 1987A in particular, is structured on both large and small scales. Current radio observations of CO and SiO molecular line emission from the innermost regions of SN 1987A reveal a clumpy asymmetric structure (Abellán et al. 2017). Nebular phase spectra require significant macroscopic mixing, often combined with a clumpy structure (Fransson & Chevalier 1989; Spyromilio et al. 1990;
Li et al. 1993;Jerkstrand et al. 2011,2012). A clumpy structure is also suggested by the observed fine-structure in the Hα line profile at early times (Hanuschik et al. 1988). This “Bochum” event is further supported by the direction-dependent spectra of SN 1987A observed via light echoes (Sinnott et al. 2013). Inte-gral field spectroscopy applied to a selection of near-infrared lines also suggests a large-scale asymmetry of the SN 1987A ejecta (Kjær et al. 2010). The smooth rising optical brightness and the high-energy radiation observed after about 200 days in SN 1987A suggest the mixing of56Ni out to 3000–4000 km s−1 (e.g.,Arnett et al. 1989). Numerical simulations of core-collapse SN explosions suggest a strong breaking of spherical symmetry on small and large scales, both from the intrinsic multidimen-sional nature of the explosion mechanism and the shock wave propagation in a stratified massive star progenitor (Mueller et al. 1991;Kifonidis et al. 2000;Blondin et al. 2003;Wongwathanarat et al. 2015).
Despite the widespread knowledge that core-collapse SN ejecta are clumpy, light curve and spectral calculations during the photospheric phase generally assume a smooth ejecta. It is therefore interesting to investigate the impact of clumping on SN observables during the photospheric phase, particularly since multiple effects may produce similar changes in the light curve and spectra.
In the next section, we present our numerical approach. In Sect. 3, we discuss the treatment of clumping in our radiative transfer calculations, the relevant clumping scales for continuum and line radiation, as well as the limitations of our approach. In Sect.4, we compare the smooth and clumped models Bsm and Bcl, including the differences in bolometric light curve, color,
A&A 619, A30 (2018) and spectral evolution. A comparison of the models with
obser-vation is made in Sect.5. In this section, we also argue that the early rise in SN 1987A may be in part driven by ejecta clumping, rather than56Ni mixing alone as generally stated. Clumping can thus modulate the rate of energy release from Type II SN ejecta, impacting the photospheric phase duration and brightness. In Sect. 6, we summarize our results and discuss how clumping might alter current inferences of ejecta properties across SN types and how this alteration might impact our model of the progenitor stars.
2. Numerical approach
In this work, we discuss our results for a BSG progenitor. This model corresponds to a zero-age main sequence star of 15 M evolved withMESA(Paxton et al. 2015) at a metallicity of 10−7. With this very low metallicity the massive star model reaches core collapse as a BSG star without the need for any tinkering of convection parameters etc. We simulated the explosion with V1D (Livne 1993). The explosion is triggered by depositing a total of 1.6 × 1051erg at a constant rate for 0.5 s and over a region of 0.05 M above a Lagrangian mass of 1.55 M . We applied a strong chemical mixing of all elements. This mixing brings core metals to the metal-poor outer ejecta, and thus largely erases the original low metallicity of the progenitor star (Fig. 1). At 1 day, this model is remapped intoCMFGEN(Hillier & Dessart 2012) and followed until the onset of the nebular phase using the standard procedure (Dessart et al. 2013). Metals such as Ba, not included in MESA nor in V1D are given a constant mass fraction equal to the corresponding LMC metallicity value. Met-als between Ne and Ni that are included in MESAandV1Dare given a minimum mass fraction equal to the corresponding LMC metallicity value (this applies to the most abundant stable isotope for each element). The LMC value was adopted here since it is the metallicity relevant for SN 1987A, to which our model will be compared. Furthermore, SN 1987A is the prototypical Type II-peculiar SN, and such BSG explosions seem to occur at LMC-like metallicities (Taddia et al. 2013). This initialCMFGENmodel has a mass of 13.22 M , a kinetic energy of 1.26 × 1051erg, and an initial56Ni mass of 0.084 M .
3. Clumping
3.1. Numerical treatment of clumping
To treat clumping we assume that the ejecta are composed of clumps that occupy a fraction fvol of the total volume. The clumps are assumed to be “small” (see Sect.3.2), there is no interclump medium, and the velocity remains unchanged (i.e., clump and inter-clump media move at the same speed at a given radius and post-explosion time). With these assumptions the model density is simply scaled by a factor of 1/ fvol, while opac-ities and emissivopac-ities (which are computed with populations and temperature deduced for the clumps) are all scaled by a factor of fvol. These assumptions leave column densities unchanged but have a direct influence on processes that depend on the density squared (e.g., free–free), and an indirect influence on the radi-ation field because of the sensitivity of the kinetic equradi-ations to density.
The volume-filling factor approach adopted has been imple-mented in CMFGEN (Hillier 1996; Hillier & Miller 1999) for two decades, is also implemented in other transfer codes such as
FASTWIND(Puls et al. 2006) and POWR (Hamann & Koesterke
1998), and has been widely used in the studies of massive stars
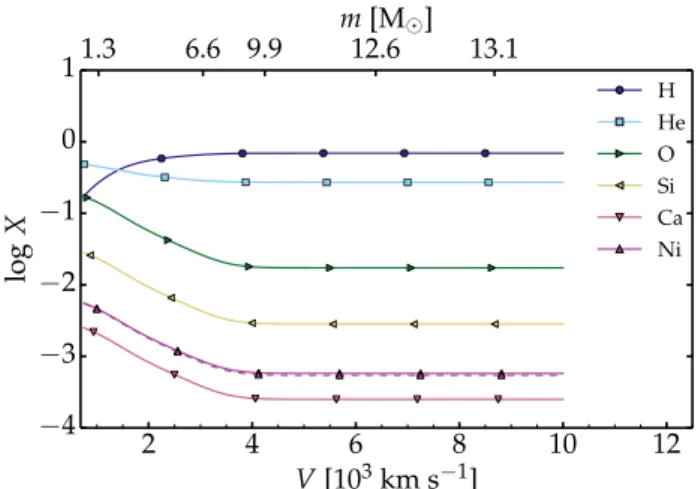
2 4 6 8 10 12 V [103km s−1] −4 −3 −2 −1 0 1 log X H He O Si Ca Ni 1.3 6.6 9.9 m [M12.6 ] 13.1
Fig. 1.Chemical composition of the BSG explosion model used for the Bsm (smooth) and Bcl (clumped) simulations withCMFGEN(Sect.4). The x-axis is cut at 10 000 km s−1– the composition is uniform above that limit and up to the maximum ejecta velocity of 30 000 km s−1. and their stellar winds. There is strong theoretical evidence that the winds of hot stars are clumped due to instabilities aris-ing from radiation drivaris-ing (Owocki & Rybicki 1984; Owocki et al. 1988). Observations, of both O and W-R stars, also indi-cate the clumping is important (Moffat et al. 1988;Hillier 1991;
Eversberg et al. 1998).
The volume-filling factor approach is somewhat similar to assuming a radial compression of material into dense spherical shells, occupying a fraction fvol of the total volume. However, due to both radiative transfer effects (which would allow for opti-cal depth effects) and the influence of density variations, such shells would show strong variations in populations across the shells. Shell-like models also incorporate an interclump medium. Shell-like models have been explored for O and W-R stars (Hillier 1991,2008).
Multidimensional simulations of core-collapse SN explo-sions suggest a greater level of clumping as one progresses deeper in a core-collapse SN ejecta (Mueller et al. 1991;
Wongwathanarat et al. 2015). Hence, the adopted clumping factor is a function of the ejecta velocity V and takes the form :
fvol(V)= 1 + (a − 1) exp(−X2) ; X= (V − Vmin)/b , (1) where Vminis the minimum ejecta velocity. With this choice, the inner ejecta is clumped ( fvol(V)= a, with a < 1) and becomes progressively smooth outwards ( fvol(V → ∞) = 1). The tran-sition region from clumped to smooth ejecta is controlled by b. The choice for a and b is somewhat arbitrary.Mueller et al.
(1991) report density contrasts close to ten in their simulations (i.e., a ∼ 0.1). For b, we chose the ejecta velocity that corre-sponds roughly to what used to be the edge of the He core in the progenitor star. Using our BSG progenitor model, we study two variants of the same explosion model. Model Bsm has a smooth ejecta (a= 1) and model Bcl has a clumped ejecta (with a = 0.1 and b= 4000 km s−1). We assume that clumping does not evolve with time.
To start the clumped models, we chose a post-explosion time sufficiently early that the photosphere in the smooth model is at a velocity where fvol is close to unity in the clumped model. The emerging SN radiation in the clumped model is therefore not affected by clumping initially. We then stepped in time in the usual manner and with the same model parameters as in the smooth model. Throughout this work, we assumed local deposition of radioactive decay energy.
3.2. Considerations on clumping
Clumping will impact continuum and line photons differently. At large optical depths, the change to the opacity caused by clump-ing is largely irrelevant since the diffusion time is much larger than the age of the SN, and hence there is effectively no diffusion of radiant energy from regions of high optical depth. What mat-ters most are the photospheric layers in which diffusion occurs, and from which photons escape.
For continuum processes, our approach assumes that the clumps are small and optically thin, or equivalently, that the clumps are much smaller than a photon mean free path. In this case the relevant scale is 1/χ, where χ is the opacity. Assuming that the density at a radius R varies as R−n, the scale length at the photosphere is ∼R/(n − 1). In our BSG explosion model, we have n= 9 above 2000 km s−1. If we assume the volume-filling factor is fvol, we require that the clumps are much smaller (say a factor of 10) than R fvol/10. Adopting fvol = 0.1 and a photo-spheric radius ≥1015cm (typically valid, for example, between 10 and 160 days) the clumps should have a size ∼1012cm or smaller.
For line processes, the relevant scale is the Sobolev length. The Sobolev length is defined as Vth/(dV/dR) = RVth/V, where Vth is the intrinsic line thermal width, which varies from ∼1 km s−1for Fe to ∼10 km s−1for H in a Type II photosphere at the recombination epoch. For R= 1015cm, V
th= 1 km s−1(i.e., an Fe line with no micro-turbulence), and Vphot = 5000 km s−1, the Sobolev length is 2 × 1011 cm, i.e., about the size of the Sun. The approach we use to incorporate clumping into CMF-GENeffectively assumes that the clumps are much smaller than a Sobolev length. While this scale is smaller than the continuum requirement, it is still large. In practice, we use a turbulent veloc-ity of 50 km s−1in the presentCMFGENsimulations. This tends to enhance the Sobolev length and make it less species or ion dependent.
As noted earlier, there is strong theoretical and observational evidence that the winds of hot stars are clumped with the clumps having a size of a few Sobolev lengths. However, there are argu-ments about the nature of the clumps and the importance of porosity. In stellar winds, we can also have porosity in velocity space (Owocki 2008) – some directions may not probe all veloci-ties or some velocity regions may have a much lower density with little impact on photon escape. The properties of the interclump medium also impact the morphology of P Cygni profiles, in par-ticular whether they exhibit a “black absorption” (i.e., no residual flux in the P-Cygni absorption trough; e.g., Sundqvist et al. 2010). An approximate approach to solving the non-LTE transfer problem in such cases is outlined bySundqvist & Puls(2018). Despite the limitations of the volume-filling factor approach, it has been used quite successfully in modeling both O (e.g.,Bouret et al. 2003,2012) and W-R stars (e.g.,Hainich et al. 2015).
The clumpingCMFGENuses corresponds to an ejecta com-posed of numerous small-scale inhomogeneities, covering all ejecta-centered directions, rather than a few large-scale struc-tures. The properties of these small-scale clumps may be com-plex. For example,56Ni bubbles will cause regions of enhanced density, and they themselves will be in regions more rarified than what is assumed by a smooth hydrodynamical model.
Our treatment of clumping is different from the statistical approach ofJerkstrand et al.(2011) in two important ways. First, our clumping does not alter the column density, and hence the electron-scattering optical depth (ignoring changes in ionization) and the escape of gamma-ray photons. The second characteristic of clumping not considered inCMFGENis chemical segregation.
In core-collapse SNe, mixing is expected to be macroscopic, leading to a shuffling of the pre-SN “onion-shell” structure by advection on a large scale, with little or no microscopic mix-ing. At a given radius (or velocity) in a macroscopically mixed model, one encounters material that used to be located at distinct radii (or velocities) in the original, unmixed, model, and with its original composition.
The assumption of microscopic instead of macroscopic mix-ing can, in some cases, have dramatic effects on nebular spectra. As our own modeling has shown, and was first demonstrated for SN 1987A byFransson & Chevalier(1987), microscopic mixing of Ca into the O zone can lead to both an enhancement in the strength of the [CaII] lines, and a corresponding reduction in the strength of the [OI] lines. Because the [CaII] lines are a more efficient coolant than the [OI] lines, the amount of Ca in the O zone does not need to be very large to cause the [OI] line flux to weaken substantially.
In CMFGEN, we assume both macroscopic and microscopic
mixing. This means that each radial (or velocity) shell in a
CMFGEN model (whether smooth or clumped) is fully mixed.
While this seems a severe shortcoming of our approach, the
CMFGEN results obtained at nebular times for Type II SNe
(Dessart et al. 2013) are a close match to the observations (Silverman et al. 2017), not obviously inferior in quality to simu-lations that treat chemical segregation and clumping (Jerkstrand et al. 2012). This weak sensitivity implies that nebular-phase spectra cannot set a robust constraint on chemical segregation and clumping in the inner ejecta.
A more realistic treatment of clumping will require a 3D approach, and should allow for a variety of clump properties (abundances, filaments, broad protuberances, or blobs) on dif-ferent scales, and for the interclump medium (assumed to be a vacuum inCMFGEN). In such a scenario, porosity may be impor-tant, that is, “clumping” might lead to a reduction of the optical depth along some sight lines.
4. Results
In this section, we compare the results of a clumped model with those of an otherwise identical but smooth model. We study the bolometric luminosity, optical colors, optical spectra, and the ejecta properties and the photosphere as a function of time until the onset of the nebular phase.
Figure2shows the bolometric light curve (top) and the U–V and V–I colors (bottom panels) from 10 to 170 days after explo-sion for the smooth and clumped models Bsm and Bcl. The two models are initially indistinguishable but subsequently depart from each other, the clumped model Bcl becoming more lumi-nous and redder in the optical than the smooth model Bsm. The offset in bolometric luminosity grows to 10–15% at 50 days before decreasing again as the clumped model reaches its bolo-metric maximum earlier, by about 10 days. The excess radiation released at early times turns into a deficit of radiation after maxi-mum, causing the clumped model to fade earlier from maximum (with respect to the time of explosion). The clumped model turns optically thin earlier. At 170 days, the two models are optically thin in the continuum (some lines may remain optically thick for much longer) and have the same bolometric luminosity1. 1 Because we assume a local energy deposition, the nebular-phase luminosity of both models is identical. But with our treatment of clump-ing, which preserves the column densities, the γ-ray energy deposition (and hence the luminosity) would be equal in both models even if we allowed for non-local energy deposition.
A&A 619, A30 (2018)
0 20 40 60 80 100 120 140 160 180
Days since explosion 41.2 41.3 41.4 41.5 41.6 41.7 41.8 41.9 log( Lbol /er g s − 1) Bsm Bcl 2.2 2.4 2.6 2.8 3.0 3.2 3.4 U − V 0 20 40 60 80 100 120 140 160 180 0.4 0.6 0.8 1.0 1.2 1.4 1.6 1.8 V − I Bsm Bcl Color Magnitude [mag]
Days since explosion
Fig. 2.Bolometric light curve (top panel) and color evolution (lower panels) for models Bsm and Bcl.
Rather than impacting the time-integrated bolometric luminos-ity, clumping influences the rate at which radiation is released from the SN ejecta. Up to maximum, the clumped model is consistently redder in the optical than the smooth model. This persists in V–I after maximum, while the clumped model shows a bluer U–V color as the ejecta turns nebular.
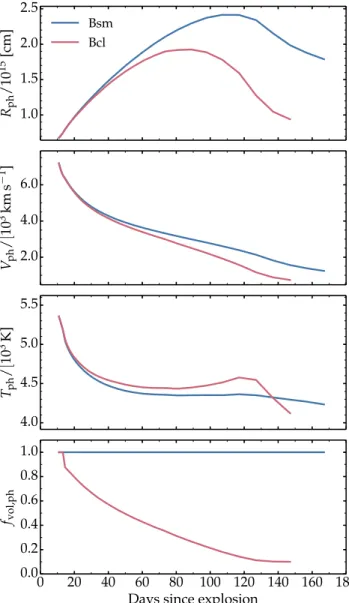
Figure 3 shows some photospheric properties for models Bsm and Bcl, which illustrates the origin of the luminosity boost in the clumped model. In both models, the photosphere recedes toward the inner ejecta layers as time passes but in the clumped model this recession is faster. Consequently, the pho-tospheric velocity drops faster with clumping, yielding smaller photospheric radii. The faster recession allows more trapped energy to be released, boosting the luminosity on the way to bolometric maximum. Given the smaller photospheric radii, this occurs through a greater photospheric temperature. The greater offset in bolometric luminosity takes place when the clumping factor at the photosphere is only 0.5 (over-density of a factor of 2 compared to the smooth model). Numerical simulations (e.g., Mueller et al. 1991) suggest much greater clumping val-ues, which suggests that the effect seen here could be greater in Nature. 1.0 1.5 2.0 2.5 Rph / 10 15 [cm] Bsm Bcl 2.0 4.0 6.0 Vph / [10 3 km s − 1 ] 4.0 4.5 5.0 5.5 Tph / [10 3 K] 0 20 40 60 80 100 120 140 160 180
Days since explosion 0.0 0.2 0.4 0.6 0.8 1.0 fvol,ph
Fig. 3.Evolution of the radius, the velocity, the temperature, and the clumping factor at the photosphere of models Bsm and Bcl.
Figure4 shows some ejecta properties of the clumped and smooth models Bcl and Bsm at 73.5 days after explosion. The profiles look similar in both models, which exhibit a strong ion-ization front. The jump in the H ionion-ization fraction coincides with a jump in electron density, in Rosseland-mean opacity and in temperature. We note that in both, the clumped and the smooth models, the photosphere is located well above this ionization front (by about 1000 km s−1 at that time; see Fig.3). This fea-ture arises from the ionization freeze-out in the outer ejecta, allowing the electron-scattering optical depth to be 5–10 at the ionization front. However, in the clumped model, the ionization front has receded ∼500 km s−1 deeper in the ejecta, and will eventually reach the base of the ejecta 10 days earlier than in the smooth model Bsm. Figure4 also shows that the clumped model has a higher Rosseland-mean opacity in optically thick regions, and a higher Rosseland-mean optical depth (1070 ver-sus 620 in the smooth model) while the reverse is true for the electron-scattering optical depth (201 versus 230 in the smooth model). This offset arises because density-squared-dependent opacity processes are boosted in the clumped model, while those that are linear (such as electron scattering) are not (the clumped ejecta has a lower electron-scattering optical depth because its
0.0 0.2 0.4 0.6 0.8 1.0 H Ionization Fraction [email protected] [email protected] 8 10 12 14 log( Ne /cm − 3) −2 −1 0 log( κRoss /cm 2g − 1) 0 5 10 15 20 T [10 3K] 1 2 3 4 5 6 7 8 V [103km s−1] 0.0 0.2 0.4 0.6 0.8 1.0 fvol
Fig. 4.Comparison of ejecta properties for models Bsm (solid) and Bcl (dashed) at 73.5 days after explosion.
ionization is lower). So, counter-intuitively, the clumped model, with its greater Rosseland-mean optical depth, has a shorter pho-tospheric phase. This arises because the total optical depth is not the relevant one for diffusion. In Type II SN ejecta, diffusion occurs mostly through the photospheric region.
Let X(n+1)+be the dominant ionization state of some species. In that case the most important opacity source (at the wave-lengths of interest) is usually provided by Xn+. The population of the levels in this ionization state scales with the square of the density.
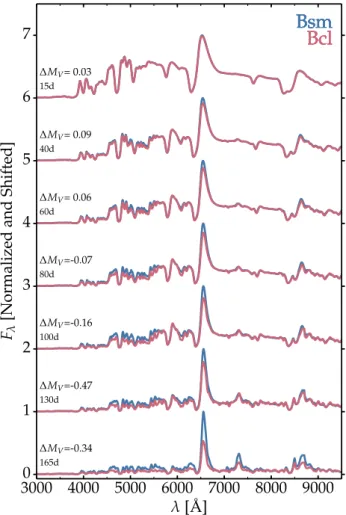
Figure5shows the spectral evolution for models Bsm and Bcl during the photospheric phase. The spectral differences between our smooth and clumped models Bsm and Bcl are sub-tle. The redder colors reported earlier (bottom panels of Fig.2) arise from a stronger metal line blanketing in the clumped model, driven by a lower ionization and higher density in the spectrum formation region. This supersedes the counter-acting effect of a greater photospheric temperature. Consequently, the clumped model shows a lower flux shortward of Hα. Metal lines such as BaII6142 Å appear stronger, while the Hα emission flux is reduced. This likely stems from the smaller ejecta volume containing partially-ionized hydrogen in the clumped model.
It is not surprising that clumping does not strongly affect colors and spectra during the recombination phase since the
3000 4000 5000 6000 7000 8000 9000 λ[ ˚A] 0 1 2 3 4 5 6 7 Fλ [Normalized and Shifted] 15d
Bsm
40dBsm
60dBsm
80dBsm
100dBsm
130dBsm
165dBsm
∆MV= 0.03Bcl
∆MV= 0.09Bcl
∆MV= 0.06Bcl
∆MV=-0.07Bcl
∆MV=-0.16Bcl
∆MV=-0.47Bcl
∆MV=-0.34Bcl
Fig. 5.Comparison of the spectral evolution for models Bsm and Bcl. At each epoch, the Bsm model is divided by the peak Hα flux and shifted vertically by one unit, and the Bcl model is normalized to the Bsm model at 6800 Å. The labels at left indicate the post-explosion time and the V-band magnitude offset between the two models.
photosphere sits at the interface between ionized and recombined hydrogen (i.e., the recombination front), irrespective of whether the material is clumped or smooth. The effect of clumping is merely to cause the photosphere to recede faster to deeper ejecta layers. Spectroscopically, because of the strong chemical mix-ing and because lines form over extended regions (in radius or in velocity), the precise location of the photosphere cannot be easily deciphered from spectral line widths. In other words, clumping (as implemented inCMFGENat present) does not lead to spec-tral differences that can be easily identified. The lack of clear clumping signatures does not imply clumping is absent, nor that it should be ignored.
5. Comparison with observations
The BSG model used here is part of a broad investigation on Type II-peculiar SNe and the diversity of their light curves and spectra (Dessart et al., in prep.). None of the SN models is specif-ically designed to match any particular observation. In other words, we do not iterate until a given model matches a specific SN. Nonetheless, it is fruitful to compare theoretical models to observed BSG-star explosions and in particular SN 1987A.
The supernova 1987A has been modeled extensively in the past, including its light curve properties (e.g., Woosley et al. 1988,Blinnikov et al. 2000; Utrobin et al. 2015) and its spec-tral properties (e.g.,Hoeflich 1988;Eastman & Kirshner 1989;
A&A 619, A30 (2018)
Schmutz et al. 1990; Mitchell et al. 2001). However, its pho-tometric and spectroscopic properties have very rarely been modeled simultaneously (Utrobin & Chugai 2005; Dessart & Hillier 2010; Li et al. 2012). In this section, we compare our clumped model Bcl to the observations of SN 1987A. We use the bolometric luminosity inferred byCatchpole et al.(1987) and
Hamuy et al.(1988), which differ mostly through the uncertain value of reddening. We use the spectroscopic observations of
Phillips et al.(1988). For our spectral comparisons, we adopt a reddening E(B−V)= 0.15 mag and an explosion date coincident with the neutrino detection reported byHirata et al.(1987).
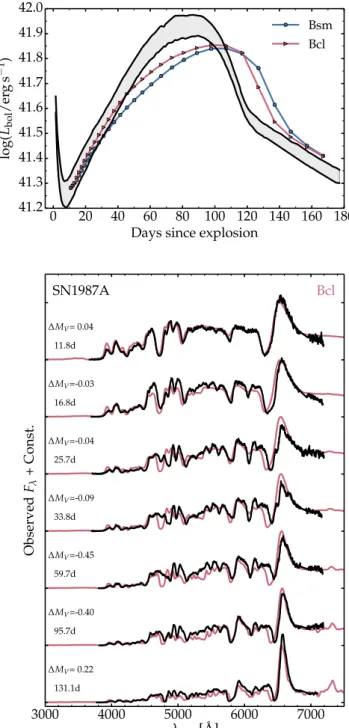
Figure 6 shows the bolometric light curve and spectral evolution from about 10 d until the onset of the nebular phase for model Bcl and for SN 1987A (for the light curve, both models Bsm and Bcl are shown). The huge mixing employed (Fig.1) allows the model Bsm to continuously rise after 10 days, as observed in SN 1987A. With weak mixing, the rise would be delayed and a kink would be present at about 20 days. With no 56Ni, the model light curve would instead precipitously drop after 20 days (see, e.g.,Blinnikov et al. 2000). In the clumped model, the rise is faster and the time of maximum is earlier, reducing the offset with SN 1987A. A greater helium mass fraction or a smaller radius can also hasten the photosphere recession, but this takes away nothing from the effect caused by clumping.
Spectroscopically, models Bcl and Bsm are identical at 11.8 days and reproduce well SN 1987A. The subsequent evo-lution is however perplexing and suggest that something very unusual is going on. Indeed, the Hα line becomes weak and very narrow on the way to bolometric maximum, Hβ even dis-appears, while BaII6142 Å and BaII6496.9 Å (and probably BaII4934 Å, which may cause the disappearance of Hβ) become surprisingly strong. Utrobin & Chugai (2005) argued that the strong BaIIlines were a result of time-dependent ionization but this is unlikely the solution since we treat this process here. In practice, accounting for time dependence yields a greater ion-ization than for steady state, which tends to prevent rather than facilitate the formation of BaIIlines here. At 35 days, the dom-inant Ba ion is Ba2+, which explains why BaIIlines are weak. Increasing the Ba abundance by a factor 5 at 35 days induces only a minor change to the synthetic spectrum. The weakness of BaII lines is therefore caused mostly by over-ionization, which clump-ing can affect favorably, although insufficiently, in model Bcl. The Ba ionization is also sensitive to the radiation field short-ward of 9.3 eV, a region in which there is little flux. Additional species and line blanketing might help reduce the radiation field in this region, and may thus solve the BaIIline strength problem (as also discussed byUtrobin & Chugai 2005).CMFGEN some-times reproduces the strength of BaIIlines, as in the low-energy explosion Type II-Plateau SN 2008bk (Lisakov et al. 2017).
The lower ionization in SN 2008bk arises from the greater density in the spectrum formation region (even without clump-ing), which is a consequence of the low expansion rate (i.e., the SN ejecta are denser at a given post-explosion time compared to a standard energy explosion). Interestingly, in SN 2008bk (and in fact in all low-energy low-luminosity SNe II-Plateau;Lisakov et al. 2018), the effect of BaII6497 Å on the Hα profile is as strong as seen here for SN 1987A. Compared to SN 1987A, a dis-agreement persists but is reduced when clumping is introduced. Throughout the evolution, the NaID is well matched, perhaps because the NaIionization potential is only 5.14 eV, and hence the Na ionization state is less sensitive to the EUV radiation field (E > 10 eV). As the NaIIionization potential is very large (47.5 eV), NaIpersists over a wide range of conditions.
0 20 40 60 80 100 120 140 160 180 Days since explosion
41.2 41.3 41.4 41.5 41.6 41.7 41.8 41.9 42.0 log( Lbol /er g s − 1) Bsm Bcl 3000 4000 5000 6000 7000 λobs[ ˚A] Observed Fλ + Const. 11.8d ∆MV= 0.04 16.8d ∆MV=-0.03 25.7d ∆MV=-0.04 33.8d ∆MV=-0.09 59.7d ∆MV=-0.45 95.7d ∆MV=-0.40 131.1d ∆MV= 0.22 Bcl SN1987A
Fig. 6. Comparison of the bolometric light curve (top panel: the shaded area is bounded by the bolometric light curves inferred by
Catchpole et al. 1987andHamuy et al. 1988) and multi-epoch spec-tra for SN 1987A and our BSG explosion model Bcl (redshifted and reddened). The label gives the post-explosion epoch and the V-band magnitude offset between model Bcl and SN 1987A.
In general, to produce a brighter Type II SN display during the photospheric phase, one increases the explosion energy. But as can be seen in Fig.6, our model spectra match observations at 10 days, and overestimate the widths of FeII5169 Å, NaID, or Hα later on. Increased 56Ni mixing would not help either. While it would reduce the mismatch in early-time brightness, it would increase the mismatch in line profile width because of the enhanced non-thermal excitation and ionization in the outer ejecta. Instead, observations suggest that the SN photosphere is receding faster, a property that is compatible with clump-ing. While qualitatively adequate, the clumping we use in model A30, page 6 of8
Bcl is too small to yield a good match to the SN 1987A spec-tra at 30–100 days, and to the bolometric light curve. As pointed out earlier, we made no attempt at reducing the ejecta mass or changing the ejecta composition to yield a better match. Given all the uncertainties and the simplistic treatment of clumping in
CMFGEN at present, our goal is merely to demonstrate that
clumping has an effect.
6. Discussion
We have presented non-local thermodynamic equilibrium time-dependent radiative transfer simulations for the ejecta resulting from a BSG explosion. The basic ejecta properties are broadly compatible with SN 1987A.
The goal of the paper was to describe the impact of ejecta clumping on SN radiation properties. With our 1D treatment of clumping, which leaves unchanged the radial column density, the rate of recession of the photosphere is increased because of the greater recombination at the photosphere. The greater mate-rial density also leads to enhanced blanketing and redder optical colors. The impact on the spectral morphology is subtle, with a slight reduction of the Hα emission and slight increase in metal line strength. Of all observables, the bolometric luminosity (or optical flux) is the most influenced, through an increase of at most 10–15 % at 50 days, a shorter rise to maximum, and an ear-lier transition to the nebular phase. This effect of clumping is analogous, for example, to what would occur if the ejecta had a lower mass or a greater helium mass fraction. The spectral pecu-liarities of SN 1987A at 30 days (abnormally weak Hα, absent Hβ, strong BaIIlines) cannot be explained by time dependence, and are not compatible with a stronger56Ni mixing. They are, however, compatible with the effect of clumping, which in our simulations is probably too small – the clumping factor at the photosphere at 30 days is only 0.65 (over-density by a factor of 1.55 compared to the smooth model counterpart).
Clumping, as currently implemented inCMFGEN, leads to a higher recombination rate, causing the faster recession of the photosphere and the faster release of stored internal energy. This is the main effect captured here. However, because our clump-ing is 1D, it does not alter the (radial) column density and thus underestimates the impact that clumping would have (e.g., by introducing porosity). Even with clumping, we continue to assume chemical homogeneity while, for example, the56Ni rich material should be under-dense relative to the H-rich material. A porous medium in 3D would thus impact the mean free path of γ-ray and optical photons differently. Porosity will exacerbate the effect of clumping described here. The linear polarization detected at early times in some Type II-Plateau SNe (Leonard et al. 2012) suggests the presence of inhomogeneities in the outer ejecta, thus further out than adopted here.
We have performed a similar exploration for the RSG explo-sion model m15mlt3 ofDessart et al.(2013). We computed two such models of Type II-Plateau SNe (Rsm and Rcl) in an anal-ogous fashion to what is described above for model Bsm and Bcl. Model Rsm is smooth (identical to m15mlt3) and model Rcl is clumped (we adopted a= 0.1 and b = 3000 km s−1). We found a very similar behavior to Bsm versus Bcl simulations, although here the effect at early times is invisible due to the large SN brightness. However, at the end of the plateau (correspond-ing to the epoch of bolometric maximum in a Type II-peculiar SN), model Rcl is brighter by about 10% and it also falls off the plateau (i.e., it enters the nebular phase) 10 days earlier. Clump-ing might thus help resolve a problem with (smooth) CMFGEN
SN II-Plateau models, because these tend to underestimate the brightness at the end of the plateau (Dessart et al. 2013). It also suggests that clumping can impact the inferred ejecta mass of Type II-Plateau SNe since the ejecta mass is in part constrained by the plateau (or the photospheric phase) duration.
Our smooth BSG explosion model Bsm systematically underestimates the BaII line strength observed in SN 1987A, in spite of our time-dependent non-LTE treatment (Utrobin & Chugai 2005;Dessart & Hillier 2008). Increasing the Ba abun-dance by a factor of 5 has little impact on the predicted line strengths, primarily because the ionization of Ba remains too high. Clumping is a powerful means to reduce the ejecta ion-ization and enhance the strength of BaIIlines after 20 days.
With time dependence, the ejecta ionization is maintained higher, which tends to inhibit recombination. In the simulations of Dessart & Hillier (2008), assuming steady state yields an ejecta more recombined, hence with a lower radial optical depth. This process may be one reason why ourCMFGENsimulations tend to yield a longer photospheric phase than in seemingly identical radiation hydrodynamics simulations with a simplified treatment of the gas (Utrobin et al. 2015). This issue requires further study.
In this study, the properties for clumping (depth dependence and magnitude) were largely ad-hoc. Enhancing the magnitude and extent of clumping exacerbates its impact. In the future, we will need to perform a systematic study to quantify the impact of clumping for different clumping properties. We will also need to seek constraints from high-resolution 3D explosion simulations, in which both large-scale and small-scale inhomogeneities are resolved.
The effects of clumping discussed here for Type II SNe may be relevant for other SN ejecta and SN types. Although not mod-eled here and therefore speculative, clumping may help to resolve the discrepancy between the mass inferred for SN Ibc (Drout et al. 2011) and those expected from single W-R stars. The lumi-nosity boost caused by clumping in our Bcl and Rcl models may also explain why some standard SNe Ibc have abnormally large inferred56Ni masses (Drout et al. 2011). At present, while one can explain easily the production of Type IIb/Ib SNe through the binary channel (Yoon et al. 2017), the origin of Type Ic SNe remains debated. Continued evidence supports the notion that SNe Ic must come from higher mass progenitors, including sin-gle W-R stars (Maund 2018). Clumping, which to this day has never been treated in light curve calculations, may afford larger ejecta masses that may help resolve this long standing problem.
Acknowledgements.We thank Roni Waldman for providing the blue-supergiant
progenitor model.
References
Abellán, F. J., Indebetouw, R., Marcaide, J. M., et al. 2017,ApJ, 842, L24
Arnett, W. D., Bahcall, J. N., Kirshner, R. P., & Woosley, S. E. 1989,ARA&A,
27, 629
Blinnikov, S., Lundqvist, P., Bartunov, O., Nomoto, K., & Iwamoto, K. 2000,
ApJ, 532, 1132
Blondin, J. M., Mezzacappa, A., & DeMarino, C. 2003,ApJ, 584, 971
Bouret, J.-C., Lanz, T., Hillier, D. J., et al. 2003,ApJ, 595, 1182
Bouret, J.-C., Hillier, D. J., Lanz, T., & Fullerton, A. W. 2012,A&A, 544, A67
Catchpole, R. M., Menzies, J. W., Monk, A. S., et al. 1987,MNRAS, 229, 15P
Dessart, L., & Hillier, D. J. 2008,MNRAS, 383, 57
Dessart, L., & Hillier, D. J. 2010,MNRAS, 405, 2141
Dessart, L., Hillier, D. J., Waldman, R., & Livne, E. 2013,MNRAS, 433, 1745
Drout, M. R., Soderberg, A. M., Gal-Yam, A., et al. 2011,ApJ, 741, 97
Eastman, R. G., & Kirshner, R. P. 1989,ApJ, 347, 771
Eversberg, T., Lépine, S., & Moffat, A. F. J. 1998,ApJ, 494, 799
A&A 619, A30 (2018)
Fransson, C., & Chevalier, R. A. 1987,ApJ, 322, L15
Fransson, C., & Chevalier, R. A. 1989,ApJ, 343, 323
Hainich, R., Pasemann, D., Todt, H., et al. 2015,A&A, 581, A21
Hamann, W.-R., & Koesterke, L. 1998,A&A, 335, 1003
Hamuy, M., Suntzeff, N. B., Gonzalez, R., & Martin, G. 1988,AJ, 95, 63
Hanuschik, R. W., Thimm, G., & Dachs, J. 1988,MNRAS, 234, 41
Hillier, D. J. 1991,A&A, 247, 455
Hillier, D. J. 1996, inLiège International Astrophysical Colloquia,eds. J. M.
Vreux, A. Detal, D. Fraipont-Caro, E. Gosset, & G. Rauw,33,509
Hillier, D. J. 2008, in Clumping Hot-Star Winds, ed. W.-R. Hamann,
A. Feldmeier, & L. M. Oskinova (Germany: Universitätsverlag Potsdam),93
Hillier, D. J., & Dessart, L. 2012,MNRAS, 424, 252
Hillier, D. J., & Miller, D. L. 1999,ApJ, 519, 354
Hirata, K., Kajita, T., Koshiba, M., Nakahata, M., & Oyama, Y. 1987,Phys. Rev.
Lett., 58, 1490
Hoeflich, P. 1988,Proc. Astron. Soc. Aust., 7, 434
Jerkstrand, A., Fransson, C., & Kozma, C. 2011,A&A, 530, A45
Jerkstrand, A., Fransson, C., Maguire, K., et al. 2012,A&A, 546, A28
Kifonidis, K., Plewa, T., Janka, H.-T., & Müller, E. 2000,ApJ, 531, L123
Kjær, K., Leibundgut, B., Fransson, C., Jerkstrand, A., & Spyromilio, J. 2010,
A&A, 517, A51
Leonard, D. C., Filippenko, A. V., Ganeshalingam, M., et al. 2006,Nature, 440,
505
Leonard, D. C., Pignata, G., Dessart, L., et al. 2012,ATel, 4033
Li, H., McCray, R., & Sunyaev, R. A. 1993,ApJ, 419, 824
Li, C., Hillier, D. J., & Dessart, L. 2012,MNRAS, 426, 1671
Lisakov, S. M., Dessart, L., Hillier, D. J., Waldman, R., & Livne, E. 2017,
MNRAS, 466, 34
Lisakov, S. M., Dessart, L., Hillier, D. J., Waldman, R., & Livne, E. 2018,
MNRAS, 473, 3863
Livne, E. 1993,ApJ, 412, 634
Maund, J. R. 2018,MNRAS, 476, 2629
Mitchell, R. C., Baron, E., Branch, D., et al. 2001, ApJ, 556,
979
Moffat, A. F. J., Drissen, L., Lamontagne, R., & Robert, C. 1988,ApJ, 334, 1038
Mueller, E., Fryxell, B., & Arnett, D. 1991,A&A, 251, 505
Owocki, S. P. 2008, in Clumping in Hot-StarWinds, eds. W.-R. Hamann,
A. Feldmeier, & L. M. Oskinova (Germany: Universitätsverlag Potsdam),121
Owocki, S. P., & Rybicki, G. B. 1984,ApJ, 284, 337
Owocki, S. P., Castor, J. I., & Rybicki, G. B. 1988,ApJ, 335, 914
Paxton, B., Marchant, P., Schwab, J., et al. 2015,ApJS, 220, 15
Phillips, M. M., Heathcote, S. R., Hamuy, M., & Navarrete, M. 1988,AJ, 95,
1087
Puls, J., Markova, N., Scuderi, S., et al. 2006,A&A, 454, 625
Schmutz, W., Abbott, D. C., Russell, R. S., Hamann, W.-R., & Wessolowski, U.
1990,ApJ, 355, 255
Silverman, J. M., Pickett, S., Wheeler, J. C., et al. 2017,MNRAS, 467, 369
Sinnott, B., Welch, D. L., Rest, A., Sutherland, P. G., & Bergmann, M. 2013,
ApJ, 767, 45
Spyromilio, J., Meikle, W. P. S., & Allen, D. A. 1990,MNRAS, 242, 669
Sundqvist, J. O., & Puls, J. 2018,A&A, in press,
DOI:10.1051/0004-6361/201832993
Sundqvist, J. O., Puls, J., & Feldmeier, A. 2010,A&A, 510, A11
Taddia, F., Sollerman, J., Razza, A., et al. 2013,A&A, 558, A143
Utrobin, V. P., & Chugai, N. N. 2005,A&A, 441, 271
Utrobin, V. P., Wongwathanarat, A., Janka, H.-T., & Müller, E. 2015,A&A,
581, A40
Wongwathanarat, A., Mueller, E., & Janka, H.-T. 2015,A&A, 577, A48
Woosley, S. E., Pinto, P. A., & Ensman, L. 1988,ApJ, 324, 466
Yoon, S.-C., Dessart, L., & Clocchiatti, A. 2017,ApJ, 840, 10