HAL Id: insu-01287690
https://hal-insu.archives-ouvertes.fr/insu-01287690
Submitted on 14 Mar 2016
HAL is a multi-disciplinary open access
archive for the deposit and dissemination of
sci-entific research documents, whether they are
pub-lished or not. The documents may come from
teaching and research institutions in France or
abroad, or from public or private research centers.
L’archive ouverte pluridisciplinaire HAL, est
destinée au dépôt et à la diffusion de documents
scientifiques de niveau recherche, publiés ou non,
émanant des établissements d’enseignement et de
recherche français ou étrangers, des laboratoires
publics ou privés.
field study at Dome C, Antarctica
Tesfaye Berhanu, J Savarino, J Erbland, W.C Vicars, S Preunkert, J.F
Martins, Johnson M.S.
To cite this version:
Tesfaye Berhanu, J Savarino, J Erbland, W.C Vicars, S Preunkert, et al.. Isotopic effects of nitrate
photochemistry in snow: a field study at Dome C, Antarctica. Atmospheric Chemistry and Physics
Discussions, European Geosciences Union, 2015, 15 (9), pp.11243-11256. �10.5194/acp-15-11243-2015�.
�insu-01287690�
www.atmos-chem-phys.net/15/11243/2015/ doi:10.5194/acp-15-11243-2015
© Author(s) 2015. CC Attribution 3.0 License.
Isotopic effects of nitrate photochemistry in snow: a field study at
Dome C, Antarctica
T. A. Berhanu1,2,a, J. Savarino1,2, J. Erbland1,2, W. C. Vicars1,2,b, S. Preunkert1,2, J. F. Martins3, and M. S. Johnson4
1Universite Grenoble Alpes, LGGE, 38041 Grenoble, France
2CNRS, LGGE, 38000 Grenoble, France
3LTHE, UMR 5564, UJF-Grenoble 1/CNRS-INSU/G-INP, 38041 Grenoble, France
4Copenhagen Center for Atmospheric Research, Department of Chemistry, University of Copenhagen,
Universitetsparken 5, 2100 Copenhagen Ø, Denmark
acurrently at: Physics Institute, Climate and Environmental Physics, University of Bern, 3012 Bern, Switzerland bcurrently at: Technical Services Program, Air Pollution Control Division, Colorado Department of Public Health and
Environment, Denver, CO, USA
Correspondence to: J. Savarino ([email protected])
Received: 5 November 2014 – Published in Atmos. Chem. Phys. Discuss.: 23 December 2014 Revised: 29 June 2015 – Accepted: 18 September 2015 – Published: 9 October 2015
Abstract. Stable isotope ratios of nitrate preserved in deep
ice cores are expected to provide unique and valuable in-formation regarding paleoatmospheric processes. However, due to the post-depositional loss of nitrate in snow, this in-formation may be erased or significantly modified by phys-ical or photochemphys-ical processes before preservation in ice. We investigated the role of solar UV photolysis in the post-depositional modification of nitrate mass and stable isotope ratios at Dome C, Antarctica, during the austral summer of 2011/2012. Two 30 cm snow pits were filled with homog-enized drifted snow from the vicinity of the base. One of these pits was covered with a plexiglass plate that transmits solar UV radiation, while the other was covered with a differ-ent plexiglass plate having a low UV transmittance. Samples were then collected from each pit at a 2–5 cm depth reso-lution and a 10-day frequency. At the end of the season, a comparable nitrate mass loss was observed in both pits for the top-level samples (0–7 cm) attributed to mixing with the surrounding snow. After excluding samples impacted by the mixing process, we derived an average apparent nitrogen iso-topic fractionation (15ε
app)of −67.8 ± 12 ‰ for the snow
nitrate exposed to solar UV using the nitrate stable isotope ratios and concentration measurements. For the control sam-ples in which solar UV was blocked, an apparent average
15ε
app value of −12.0 ± 1.7 ‰ was derived. This difference
strongly suggests that solar UV photolysis plays a dominant
role in driving the isotopic fractionation of nitrate in snow. We have estimated a purely photolytic nitrogen isotopic frac-tionation (15εphoto) of −55.8 ± 12.0 ‰ from the difference in
the derived apparent isotopic fractionations of the two exper-imental fields, as both pits were exposed to similar physical processes except exposure to solar UV. This value is in close agreement with the15εphotovalue of −47.9 ± 6.8 ‰ derived
in a laboratory experiment simulated for Dome C conditions (Berhanu et al., 2014). We have also observed an insensitiv-ity of15ε with depth in the snowpack under the given ex-perimental setup. This is due to the uniform attenuation of incoming solar UV by snow, as 15ε is strongly dependent on the spectral distribution of the incoming light flux. To-gether with earlier work, the results presented here represent a strong body of evidence that solar UV photolysis is the most relevant post-depositional process modifying the sta-ble isotope ratios of snow nitrate at low-accumulation sites, where many deep ice cores are drilled. Nevertheless, model-ing the loss of nitrate in snow is still required before a robust interpretation of ice core records can be provided.
1 Introduction
Nitrate (NO−3), the end product of the oxidation of atmo-spheric nitrogen oxides (NOx=NO + NO2), is one of the
most abundant ions present in polar ice and snow. Ice core nitrate mass and isotopic measurements have the potential to provide quantitative constraints on historic variations in at-mospheric NOxcycling and oxidative capacity (Legrand and
Kirchner, 1990; Wolff, 1995). However, the interpretation of these paleorecords is problematic at most sites on the polar ice sheets, where post-depositional processes such as the des-orption of nitrate species on snow grains, sublimation or con-densation of water vapor and photolysis of nitrate have a ma-jor influence on the signal archived in firn and ice (Dibb et al., 1998; Honrath et al., 1999; Röthlisberger et al., 2002; Blunier et al., 2005; Frey et al., 2009; Wolff, 2013). While desorp-tion is manifested by the physical release of HNO3from the
snowpack, photolysis involves bond breaking in NO−3 and emission of the photoproducts, such as NOx, HONO and the
hydroxyl radical (OH), which can alter the oxidative capacity of the overlying atmosphere (Chen et al., 2001; Crawford et al., 2001; Domine and Shepson, 2002; Grannas et al., 2007; Meusinger et al., 2014).
The stable isotope ratios of nitrate are useful metrics used to constrain NOx chemistry (Savarino et al., 2007, 2013;
Morin et al., 2008; Hastings et al., 2009; Vicars et al., 2013) and the post-depositional processing of nitrate in snow (Blu-nier et al., 2005; Frey et al., 2009; Erbland et al., 2013). Stable isotope ratios (R) (n(18O) / n(16O), n(17O) / n(16O) and n(15N) / n(14N)) are expressed as isotopic enrichments or depletion (δ18O, 117O and δ15N) relative to a reference where δ = (Rspl/ Rref) −1 and R represents the elemental 17O /16O,18O /16O or15N /14N ratio in the sample or
ref-erence material. The 117O value is defined here using the linear relation of 117O = δ17O − 0.52 × δ18O. The reference used for oxygen isotope analysis is Standard Mean Oceanic Water (SMOW) and the reference for nitrogen is atmospheric N2. For practical reasons, δ values are typically reported in
per mill (‰), as variations in isotopic ratios for natural sam-ples occur within a very narrow range.
In order to constrain post-depositional effects on the con-centration and stable isotope ratios of nitrate, it is neces-sary to know about the isotopic fractionation values (ex-pressed using15ε,18ε,17E; see Eq. 1 for definitions), which are unique for each post-depositional process. Blunier and coworkers analyzed two surface ice cores from Dome C, Antarctica, and determined a nitrogen isotopic fractionation (15ε) of −54 ± 10 ‰ (Blunier et al., 2005). In an attempt to reproduce this field observation in the laboratory, artificial snow was irradiated with UV light in the 200–900 nm wave-length range and a 15ε value of −11.7 ± 1.4 ‰ was deter-mined. The authors concluded that post-depositional modi-fication must therefore result primarily from sublimation of snow and/or from desorption of nitric acid, with only a mi-nor contribution from photolysis. However, it was later
con-firmed that the light source used in this laboratory study possessed a different spectral distribution compared to solar spectra encountered in the field, and this may have had a con-founding effect on the interpretation of the results (Frey et al., 2009). This effect was shown experimentally in a recent labo-ratory study (Berhanu et al., 2014; Meusinger et al., 2014) by irradiating natural snow from Dome C using different UV fil-ters to match field conditions. Accordingly, isotopic fraction-ations became less negative and approached 0 when irradi-ated with short wavelength UV light and vice versa due to the different overlaps of nitrate isotopologue cross sections with the incoming UV. The15εvalue of −47.9 ± 6.8 ‰ derived for the experiment conducted using a 320 nm filter (closer to Dome C solar irradiance conditions) was in good agree-ment with the field observations of −54 ± 10 ‰ (Blunier et al., 2005), −50 ± 10 and −71 ± 12 ‰ by Frey et al. (2009) at Dome C. A recent field study by Erbland and colleagues determined an average apparent15εvalue of −59 ± 10 ‰ for the East Antarctic Plateau (Erbland et al., 2013).
A theoretical framework has been developed by Frey and colleagues in order to determine isotopic fractionations asso-ciated with photolysis (Frey et al., 2009). The authors used the zero point energy shift model (1ZPE) (Yung and Miller, 1997), convoluted with a solar spectrum measured during the summer solstice at Dome C, and determined a15εvalue of
−48 ‰, consistent with their field observations. However, photolytic isotopic fractionations based solely on the ZPE shift model are affected by the limitations of the model, such as ignoring the change in shape and intensity of the absorp-tion cross secabsorp-tions during isotopic substituabsorp-tions (Schmidt et al., 2011). In a recent study, a semiempirical model was de-veloped that is based on the ZPE shift model but addresses some of the limitations mentioned above (Berhanu et al., 2014). This model enabled a better estimation of the absorp-tion cross secabsorp-tions of nitrate isotopologues, which can be in-terpolated to a temperature of interest, thus providing a better estimate for isotopic fractionations under field conditions.
The currently existing field studies (Blunier et al., 2005; Frey et al., 2009; Erbland et al., 2013) derived apparent iso-topic fractionations (denoted15εapp,18εappand17Eapp)that
incorporate not only the isotopic effects of photolysis but also other processes with the potential to induce isotopic frac-tionation (desorption, reoxidation and surface deposition). In addition, the isotopic fractionations obtained in the exist-ing field studies cover a wide range of15εvalues (−40 to
−74.3 ‰) (Erbland et al., 2013). Therefore, further experi-mental and modeling studies are required to constrain the ef-fects of photolysis on stable isotope ratios of nitrate in snow and to advance the interpretation of these measurements in snow and ice.
We performed a field study at Concordia (Dome C), Antarctica, (75◦060S, 123◦190E) during the Antarctic sum-mer of 2011/2012. The effect of UV photolysis on snow nitrate and its associated effects on nitrate’s stable isotopic composition were investigated. We have employed an
iso-lation technique to produce exposed and limited UV-exposed samples in order to understand the role of photol-ysis in the post-depositional processing of snow nitrate. To the best of our knowledge, this is the first field study that has employed an isolation strategy to constrain specifically nitrate mass loss and the isotopic fractionation induced by photolysis from solar UV radiation.
2 Methods
2.1 Experimental design
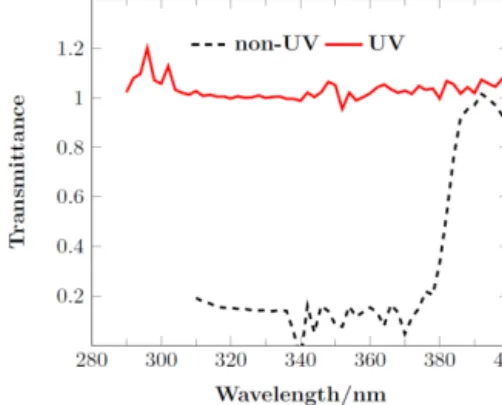
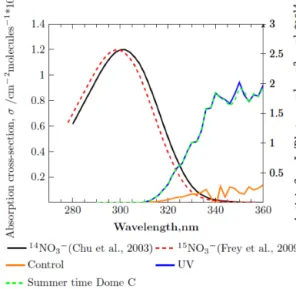
Windblown snow (i.e., drifted snow) was collected at Dome C on 2 December 2011 and physically homogenized in the field. This drifted snow possessed a high nitrate con-centration (≈ 1450 ppb), which ensured levels adequate for isotopic analysis. As the snow density was not measured, its value can be estimated to be about 225 to 330 kg m−3based on its faceted-grain-like structure (Gallet et al., 2011). Two snow pits of 1 m × 2 m surface area and 30 cm depth were excavated within close proximity (∼ 10 m) and filled with the drifted homogenized snow. A rectangular wooden frame was used to mark each surface level at a fixed position (i.e., depth = 0 cm). Any additional windblown snow accumulat-ing above this wooden mark could be removed on a weekly basis or as necessary. The snow did not become hardened with time during the study period. The pits were covered with plexiglass plates of different UV transmittances (Fig. 1), one having only minor transmittance (10–15 %) below 380 nm, and the other allowing most of the solar UV radiation in the 290–380 nm range. Transmittance was measured as a ratio between incoming solar light below the plexiglass plate to light on top of the plate. Note that sometimes light reflected back by the snow might lead to transmittance greater than 1. For simplicity, the samples exposed to UV will be referred to as “UV” samples, while those collected from the other pit, which was expected to be unaffected by UV-driven photoly-sis, will be referred to as “control” samples. Note that other non-UV-light-associated effects are expected to affect both pits equally (e.g., the disturbance of outgoing long-wave ra-diation caused by the plates). Equally, it should be realized that complete protection from UV radiation in the field is im-possible due to the scattering of light by the snow, high solar zenithal angles (min at solstice 51.6◦) and imperfect UV cut-ting by the plexiglass. Such interferences are too complex to quantify but are mainly limited to the first few centime-ters of snow. The choice of the plexiglass plate transmittance was based on the UV absorption cross section of nitrate. Ni-trate has UV absorption peaks around 200 and 305 nm, with the former being 3 orders of magnitude stronger than the lat-ter (Mack and Bolton, 1999). However, light at the wave-lengths of the strong 200 nm band is cut off because of the presence of the stratospheric ozone layer (Fig. 2) and does not reach Earth’s surface. The control plexiglass plate blocks
Figure 1. Transmittance as measured for the control and the UV plates. The UV plate transmits solar UV above 290 nm, whereas the control plate has a cutoff at ca. 375 nm (note that the control plate has an average transmittance of 15 % below 375 nm). As transmis-sion was measured as the ratio between solar light below plexiglass plate to light above the plexiglass plate, light reflected back by the snow might lead to transmittance greater than 1.
the secondary absorption band in contrast to the UV plexi-glass plates, which allow this band to reach the snow beneath. The plexiglass plates were placed on a metallic frame 20 cm above the snow surface, which was expected to be an opti-mum height because it minimizes both the warming effect on the snow beneath and the trapping of emitted NOx
photo-products. Placing the plates at a higher level could increase the possibility of snow deposition at the sides; furthermore, at higher solar zenith angles there may be solar UV radiation reaching the control plates. However, vertical plates were not placed at the sides to avoid trapping drifted snow.
2.2 Sampling and concentration measurements
Sampling was conducted every 10 days from 2 Decem-ber 2011 to 30 January 2012 at a 2–5 cm depth resolution and to a depth of 30 cm. Samples were collected less fre-quently at depths below the homogenized snow (i.e., down to 50 cm). The individual sampling events are indicated us-ing numbers 0–6, with the numbers increasus-ing from the be-ginning to the end of the season. Below 50 cm, the photol-ysis of nitrate becomes negligible, as demonstrated by the light transmission measured at Dome C (France et al., 2011). The detailed sampling dates are given in Table 1. Sampling was usually conducted in the morning between 09:00 and 12:00 LT and, on a few occasions, one pit was sampled in the morning and another in the afternoon. During sampling the plexiglass plates were removed so that both pits were ex-posed to direct solar UV for a short period of time (usually less than 1 h). For each sample, a snow mass of 0.3–0.6 kg was collected, placed into a 2 L Whirl-Pack™bag and stored frozen (note that in a few cases, a larger amount of snow, up to 1 kg was collected). The vertical pipes created during sampling were backfilled using natural snow from nearby,
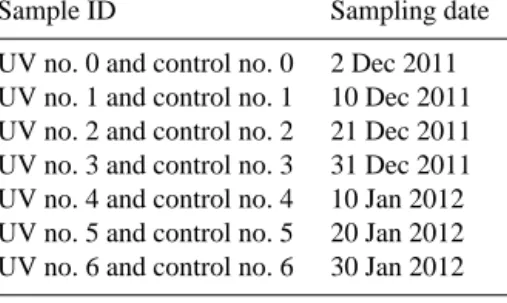
Table 1. Sample IDs with their respective sampling dates during the Austral summer 2011/2012 field campaign at Dome C, Antarctica.
Sample ID Sampling date
UV no. 0 and control no. 0 2 Dec 2011 UV no. 1 and control no. 1 10 Dec 2011 UV no. 2 and control no. 2 21 Dec 2011 UV no. 3 and control no. 3 31 Dec 2011 UV no. 4 and control no. 4 10 Jan 2012 UV no. 5 and control no. 5 20 Jan 2012 UV no. 6 and control no. 6 30 Jan 2012
with a different nitrate concentration and isotopic signature than the experimental snow. A mark was left on the wooden frame after each sampling to record the place where sam-pling was conducted. A gap of 10 cm was left between con-secutive samplings to ensure that subsequent samplings were not modified by previous samplings. The samples were later melted at room temperature for nitrate concentration mea-surement and preconcentration. The concentration of nitrate in each sample was determined in a warm laboratory at the Dome C station using a continuous flow analysis method. This is a fast technique used in previous studies by our group at Dome C, with a precision of better than 3 % and a de-tection limit of 5 ng g−1 (Frey et al., 2009; Erbland et al., 2013). In this study, we have determined a precision of better than 5 % based on replicate standard measurements. Most of the melted snow sample volume was preconcentrated using an anion exchange resin AG 1-X8 (Bio-Rad 200–400 mesh chloride form) to trap NO−3 for isotopic analysis. This step is essential to ensure that enough samples are available for replicate measurements. The nitrate trapped in the resin was eluted with the addition of 5 × 2 mL 1 M NaCl solution (Frey et al., 2009; Erbland et al., 2013). The samples were stored in plastic tubes in the dark and shipped frozen to Grenoble, France, for isotopic analysis. We have also collected surface snow samples along with the snow pit sampling in the im-mediate vicinity in order to follow possible mixing of the surrounding snow with the snow pits. The analysis of these samples was conducted in a similar fashion as for the snow pit samples.
2.3 Isotopic analysis
The oxygen and nitrogen isotopic composition of nitrate was determined using the bacterial denitrifier method (Sigman et al., 2001; Casciotti et al., 2002; Kaiser et al., 2007; Morin et al., 2008) as modified by Kaiser et al. (2007) and Morin et al. (2009). Briefly, a culture of the denitrifying bacteria (Pseudomonas aureofaciens) was concentrated 8 times by centrifugation following a 5–7-day growth period. 2 mL of the bacterial culture were then transferred to a 20 mL glass vial, which was sealed airtight with a PTFE septum. The vials were then degassed for 3 h using a helium flow (Air Liquide,
99.999 %). Using an automated system (Gilson Liquid Han-dler 215), 100 nmol of each preconcentrated nitrate sample was then injected into these vials. After an overnight incuba-tion, which allows for complete conversion of NO−3 to N2O
(Sigman et al., 2001), 0.5 mL of 1 M NaOH was added to each vial to inactivate the bacterial cells. The N2O in the
sample vial headspace was then flushed with purified he-lium (99.999 %), cryogenically trapped before being trans-ferred into a gold tube at 900◦C, where it was decomposed to O2and N2(Cliff and Thiemens, 1994; Kaiser et al., 2007),
which were separated by a GC (gas chromatograph) column and passed into a MAT253 IRMS (isotope ratio mass spec-trometer) (Thermo Scientific) to determine the stable oxygen and nitrogen isotope ratios (Morin et al., 2009).
To correct for isotopic effects associated with sample analysis, we have included certified standards of USGS-32, USGS-34 and USGS-35 (Michalski et al., 2002; Bohlke et al., 2003), which were subjected to a treatment identical to the samples and prepared in the same matrix (1 M NaCl solu-tion prepared using Dome C water in order to match the oxy-gen isotopic composition of local water) (Werner and Brand, 2001; Morin et al., 2009). We have determined the overall accuracy of the method as the standard deviation of the resid-uals derived from the linear regression between the measured and expected values of the reference materials (Morin et al., 2009). For the samples analyzed in this study, the associated overall accuracies are 2.0, 0.4 and 0.6 ‰ for δ18O, 117O and
δ15N, respectively.
2.4 Data reduction
In order to quantify the effect of photolysis on the stable tope ratios of snow nitrate, we have calculated apparent iso-topic fractionations (isoiso-topic fractionations derived for field samples irrespective of the process inducing fractionation) for O and N isotopes (15εapp, 18εapp and17Eapp for δ15N,
δ18O and 117O of nitrate, respectively). In doing so, we as-sume an open system, where NOxemitted upon the
photoly-sis of nitrate will be removed as soon as it is formed and ni-trate at depth is considered irreversibly lost (in contrast to the “skin layer” snow, which receives the deposition of reoxida-tion products) and adopt the linear relareoxida-tion used in previous studies (Blunier et al., 2005; Erbland et al., 2013):
ln (δ + 1) = ε ln (f ) + ln (δ0+1) , (1)
where f is the nitrate fraction remaining in snow, defined as the ratio of the final nitrate concentration (C) and the initial nitrate concentration (C0)in the snow (f = C/C0). δ0and δ
are the isotope ratio values for the initial and final snow, re-spectively. Due to a hiatus in preparing the standards for each batch of analysis (an offset was observed between batches but not within a batch), the use of the initial concentration of the homogenized snow as the starting point was not possible. Instead C0was calculated using the average nitrate
no change in the amount of nitrate at this depth due to insuf-ficient light penetration and the short duration of the experi-ment. The slope of the ln(δ + 1) vs. ln(f ) plot is the isotopic fractionation ε (note that ε = (α − 1)), where α is the frac-tionation factor.
Isotopic fractionation due to photolysis (denoted15εphoto)
has also been determined in this study using 1ZPE and the light transmittance of plexiglass plates, as described in Frey et al. (2009). According to this model, during isotopic sub-stitution, the ZPE of the heavier isotopologue is reduced, leading to a small blue shift in the absorption spectrum of the heavier isotopologue relative to the lighter one (Fig. 2). Hence, from a light isotopologue with a measured absorption cross section (14NO−3), it is possible to derive the absorption cross section of the heavier isotopologue (15NO−3)(Yung and Miller, 1997; Miller, 2000). Isotopic fractionations (ε) were determined using the following equation:
ε = J 0
J −1, (2)
where J0and J are the photolytic rate constants of the heav-ier and lighter isotopologues, respectively, defined mathe-matically as J = Z ϕ(λ, T )σ (λ, T )I (λ, θ, z)dλ (3) J0= Z ϕ(λ, T )σ0(λ, T )I (λ, θ, z)dλ, (4)
where σ and σ0are the absorption cross sections of the light
and heavy isotopologues, respectively. ϕ(λ) is the quantum yield and I is the actinic flux for the given wavelength ranges, which depends on the solar zenith angle (θ ) and snow depth (z). Note that if ϕ(λ) is assumed to be independent of wave-length and is the same both for14NO−3 and15NO−3, then there is no need to know its value in order to determine the isotopic fractionation value. In this study, we have applied this prin-ciple and derived isotopic fractionations for the UV-exposed pit in the presence of the plexiglass plates for field condi-tions.
We have also investigated the depth dependence of the iso-topic fractionation using the concentration and isotope ra-tio profiles of nitrate in the experimental snow pits. Accord-ingly, samples from the same depths from the seven sam-pling events were stacked together, and isotopic fractiona-tions were determined from the measured nitrate concen-tration and δ15N applying the Rayleigh plot approximation. Sampling at exactly the same depth during each collection was not possible under field conditions; therefore, the nitrate concentration and δ15N values obtained for at least four dif-ferent samples that were expected to be at the same depth, were used to derive the isotopic fractionation values. In a few cases, samples within a 1 cm depth range were averaged to-gether to derive15ε.
Figure 2. The absorption cross section of14NO−3 measured in the liquid phase and the absorption cross section of15NO−3 determined using the ZPE shift model (left y axis). The absorption cross sec-tion of15NO−3 was derived by applying an average shift of 0.5 nm on14NO−3. The 2 nm shift has been manually emphasized (note that in reality the two curves nearly overlap). Plotted on the right y axis is the solar spectrum derived using the TUV (Tropospheric Ultravi-olet Visible) model at Dome C conditions (ozone column depth of 297 DU and an albedo of 0.9) and expected UV fluxes in the pres-ence of the plexiglass plate filters.
2.5 Experimental precautions
It is important to present the precautions taken in this study to minimize possible artifacts. The two experimental fields were open to the atmosphere despite the presence of the plex-iglass plates. Therefore, while the deposition of snow and/or nitrate was prevented at the top of the experimental fields, drifted snow could still have been deposited at the surface of the pits, as the sides were not closed, in addition to dry deposition of gaseous HNO3. In order to minimize the
ef-fect from drifted snow, we mounted a wooden frame at the sides of the snow pits so that it was possible to establish a reference surface level (depth = 0 cm), and the snow present above this frame was carefully removed as necessary. In ad-dition, in order to avoid absorption or reflection of solar UV by windblown snow deposited on top of the plexiglass plates, we cleaned the plates at least once a week. However, dur-ing strong winds and bad weather, it was impossible to pre-cisely maintain the reference frame location. The lack of ho-mogeneity within and between fields and possible dry de-position are unavoidable sources of mixing and noise in the data obtained from this experiment, especially for the first few centimeters of the pits.
Figure 3. Plot of the nitrate fraction remaining in the snow (f ) with depth. Control samples (reduced solar UV) are plotted in the left panel and UV-exposed samples are plotted in the right panel. The numbers denote the sampling events, which were carried out at 10-day intervals from 2 December 2011 to 30 January 2012. The dashed lines show the depth where external factors (mainly mixing) play a significant role.
3 Results
3.1 Concentration profiles
Figure 3 shows the fraction of nitrate remaining in the snow for each field and for each sampling events. (The actual ni-trate concentrations for the entire sampling events are shown in Fig. 1 of the Supplement.) Accordingly, at the beginning of the experiment (Turnbull et al., 2015, and control no. 0,
t =0), the concentration of nitrate was uniform with depth (f ≈ 1). This corresponds to an average nitrate concentra-tion of 1431 ± 46.8 and 1478 ± 34.5 ng g−1down to a 30 cm depth for the control and UV pits, respectively.
For control no. 2, f is about 0.75 in the top 5 cm, but the profile stabilized below 10 cm, with f ≈ 1. A significant ni-trate change was observed for the controls no. 4 and no. 6 when compared to controls no. 0 and no. 2, with f reach-ing 0.15–0.25 in the top 4 cm, but higher f values (f > 0.8) were observed below 5 cm. The maximum nitrate change (f < 0.3) was observed at the surface. It is important to note that the change observed in the uppermost centimeters is not necessarily the result of a mass loss but could also result from mixing with surrounding snow with a lower nitrate concen-tration than the experimental snow, resulting in an apparent mass loss.
In contrast, samples from the pit exposed to UV radiation showed a decrease in nitrate mass up to a depth of 20 cm. For UV no. 2, a nitrate change of f ≈ 0.5 was observed at the surface. However, at lower depths, below 3 cm, only mi-nor changes were observed (f > 8). The maximum nitrate change, with f reaching 0.2, was observed for UV no. 4 and UV no. 6. The decrease continued up to a depth of 7 cm
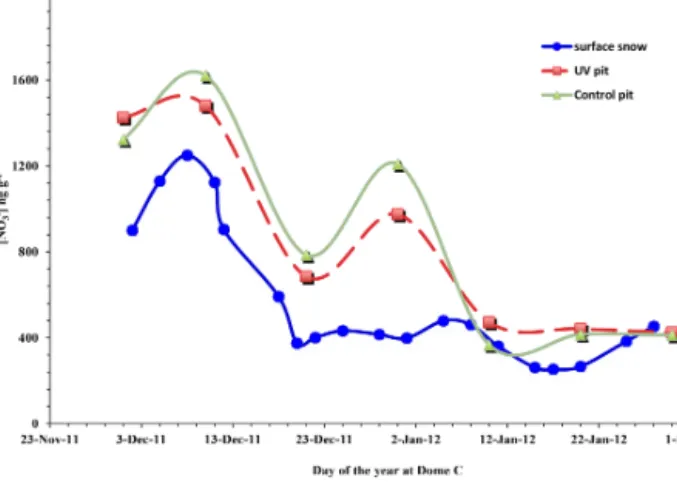
Figure 4. The nitrate concentration profile for the surface snow col-lected in the vicinity of the two pits compared with the UV and control pit surface snow (0–2 cm depth).
where f reached 0.4. Further minor decrease (f > 0.75) was observed up to a depth of 20 cm, and the decrease in nitrate ceased below 25 cm.
In general, the decrease in nitrate in the top 7 cm was com-parable for both the control and UV samples (a further indi-cation of a possible mixing process); however, the amount of nitrate mass decrease was different in each pit depending on depth and collection date.
For the surface snow samples, we observed nitrate con-centrations as high as 1500 ng g−1in mid-December that de-creased to 400 ng g−1 at the end of January (Fig. 4). This concentration profile sometimes matches the concentration of nitrate measured at a depth of 0–2 cm in the snow pits, which may have been caused by mixing and/or substitution by the surrounding snow.
3.2 Isotopic analysis
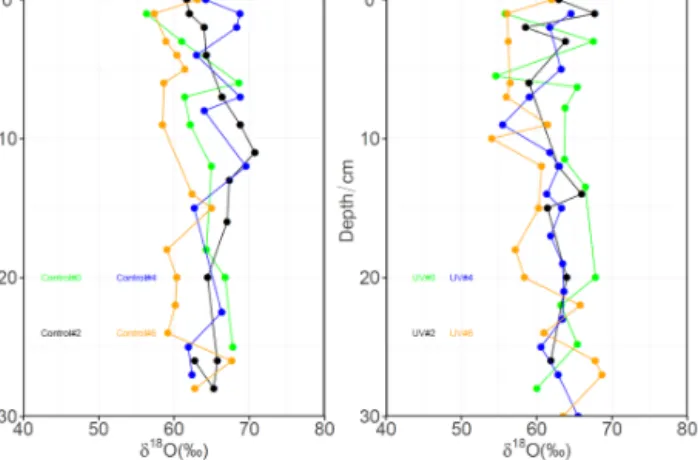
Figure 5 shows the δ15N profiles of the two pits for samples no. 0, no. 2, no. 4 and no. 6 (the δ15N values for the duration of the sampling season are shown in Fig. 3 of the Supple-ment). Controls no. 0 and no. 2 showed fairly uniform δ15N, with values ranging between −10 and 0 ‰. However, con-trols no. 4 and 6 were enriched in δ15N up to +15 ‰ for the surface samples (0–2 cm depth) extending to a depth of about 7 cm and subtle changes below a depth of 10 cm.
In the case of the UV samples, only UV no. 0 showed sta-bility up to 30 cm depth, with δ15N values ranging between
−6 and −8 ‰. For the top 5 cm samples of UV no. 2, the
δ15N values showed an increase, with a maximum value at the surface (+12 ‰) and a stable δ15N profile below a depth of 5 cm. Comparable δ15N values and similar profiles were observed for UV no. 4 and UV no. 6, with a maximum δ15N value of +35 ‰ at a depth of 2–4 cm. However, a decrease in
δ15N towards the surface was observed, and this profile is not consistent for all samples. All of the UV samples (excluding
Figure 5. δ15N depth profiles for snow nitrate in the control (left panel) and UV (right panel) pits. The horizontal lines show the depth where mixing is present in samplings nos. 0–2 (red) and 4–6 (black) in both pits.
UV no. 0) have decreasing δ15N values from their respective maximum value to about +8 to +14 ‰ near the snow surface (ca. 0–2 cm), irrespective of the sampling time. Meanwhile, this pattern is also apparent for controls no. 4 and 6.
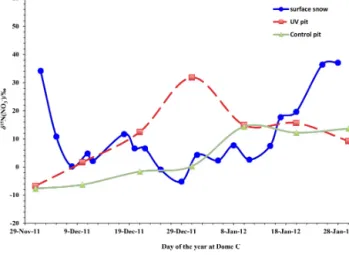
For the surrounding surface snow samples, δ15N values varying between −10 and +40 ‰ were measured on differ-ent days (Fig. 6). However, no trend was observed in the δ15N values over time. These values are sometimes similar to what is measured at the surface of the two pits; consequently, we believe that the first 7 cm in both pits was subjected to mixing with the surrounding snow.
Figure 7 shows the δ18O values obtained for both the con-trol and UV samples, which ranged from 52 to 68 ‰. It is difficult to detect a consistent trend between δ18O and depth or sampling period for either the control or UV samples in this data set.
Similar to the δ18O observations, the measured 117O
val-ues also exhibited no significant trend, with valval-ues between 26 and 30 ‰ obtained for both pits (Fig. 8). However, com-paring the control and UV samples, more variability is ob-served in the 117O values of the UV samples.
In general, when comparing the stable oxygen isotope ra-tios of the control and UV samples, it is difficult to iden-tify any pattern or significant difference between the two sets with respect to sampling event (Figs. 7 and 8). However, a significant difference is observed between the two pits (con-trol and UV) for δ15N. The measured δ15N values are the main results, used in this study to understand the role of pho-tolysis in the post-depositional processing of snow nitrate.
Figure 6. δ15N time series for nitrate in natural surface snow com-pared to surface snow sampled from the UV and control pits.
4 Discussion
4.1 Processes possibly affecting the top 0–7 cm
As this experimental study is based on the comparison of re-sults obtained from two pits filled with the same drifted snow, our first priority was to ensure that the two pits were as iden-tical as possible at the beginning of the study to minimize or possibly prevent non-photolytic process. Figures 3 and 5 show a uniform nitrate mass fraction left in the snow (f ≈ 1) as well as a fairly stable δ15N (−6 to −8 ‰) profile up to a depth of 30 cm for both UV no. 0 and control no. 0. This observation indicates that the snow was well homogenized and both pits had comparable initial nitrate concentrations and isotopic compositions. However, Figs. 3 and 5 show a significant change in nitrate and enrichment in δ15N was ob-served in the top 0–7 cm after consecutive sampling events, even in the absence of direct solar UV light. This observa-tion, together with the decreasing δ15N pattern observed near the surface layers with opposite direction to the expected en-richment at similar depths, implies that additional processes besides photolysis may be involved at these depths. Based on this observation and as a first approach, we have divided the two pits into two regions: the top 0–7 cm samples, where photolysis, mixing and additional processes are expected to act strongly, and samples collected at a depth of 7–30 cm, where the effect of these additional processes is minor and photolysis is the dominant process inducing nitrate mass loss and isotopic fractionation. We have discussed below the pos-sible causes for nitrate mass loss in the top 7 cm, which are summarized in Fig. 9.
Dome C generally experiences moderate wind speeds, with an average value of 2.9 m s−1 throughout the 1984– 2003 meteorological record (Aristidi et al., 2005; Zhou et al., 2009), but even in this range of wind speeds, deposi-tion and erosion of snow are possible at the surface. Even
Figure 7. δ18O depth profiles for snow nitrate in the control (left panel) and UV (right panel) pits.
Figure 8. Same as Fig. 7 but for 117O.
though the new snow deposited above the reference surface level was removed once or twice a week, the snow might have already been mixed with the underlying surface layer and manual removal may have disturbed or mixed the two layers, even with extremely careful handling. Furthermore, erosion and replacement are also expected to take place dur-ing strong wind events. In addition, the drifted snow on the surface of the two pits was not always evenly deposited; more snow was often deposited on one pit relative to the other, and the deposition was not homogeneous even within a single pit. This variability could have led to changes in the surface ref-erence level between each sampling event and may have thus introduced additional artifacts in these samples.
Snowfall was not observed during the sampling period; therefore, wet deposition of nitrate via snowfall can be ex-cluded. However, dry deposition of HNO3 is still possible
even with the plates in place. An interesting observation was the convergence in both the nitrate concentration and δ15N values among the surface snow samples from the different batches. For the surface snow pit samples, both of these val-ues converge on f ≈ 0.3 and δ15N ≈ + 10 to +14 ‰ (mainly
Figure 9. Schematic showing the possible external processes that could affect the surface layers of both the UV and control pits. These include evaporation, wind deposition and/or removal and photolysis at high solar zenith angle.
in UV nos. 2–6 and controls no. 4–6 samples), as can be seen in Figs. 3 and 5. These values contradict expectations based on the concentration and δ15N profile observed below 7 cm. This implies that there might be snow deposition or mixing at the surface of the pits with snow with lower ni-trate concentration (Fig. 4) and a different isotopic composi-tion (δ15N ≈ +10 to +14), giving a false impression of mass loss. As these measured values are sometimes in agreement with the surface snow measurements from a similar time pe-riod (Fig. 6), the presence of deposition is inevitable. For example, on 10 January 2012 we observed drifted snow on both snow pits (see Supplement) with similar nitrate concen-tration and stable isotope ratios as the nearby surface snow measurement. However, such events were sporadic and ap-parently depended on meteorological conditions.
Another important process to consider is the redeposition of nitrate via dry deposition. NOxphotoproducts can be
lo-cally reoxidized to reform nitrate and eventually redeposited on the snow surface. It should also be noted that desorp-tion may have taken place from the surface of both of the pits, which could be enhanced by the plexiglass plates trap-ping heat and warming the top layers. This effect should be manifested in both pits and should affect mainly the top few centimeters of the snow. The pits exhibited compara-ble loss of nitrate mass in the top 7 cm, but the δ15N val-ues were significantly different for the two pits, with mini-mum δ15N values of −15.0 and −36.0 ‰ for the control and UV pit samples, respectively. However, the more highly neg-ative isotopic fractionation observed for the UV samples was probably due to the dominance of photolysis over the non-photolytic processes present in both pits.
Another possible reason for the observed nitrate mass change and resulting isotopic effect could be photolysis in both pits. The plexiglass plate over the control pit excluded the majority of UV light at wavelengths shorter than 380 nm. However, 10–20 % of the incoming solar UV in the range of 300–310 nm is transmitted through this plate (Fig. 1), thus resulting in a spectral distribution in the control pit that
over-laps with the nitrate UV absorption band. Additionally, at higher solar zenith angles, there might be direct solar UV impeding upon the sides of the plexiglass plates leading to photolysis.
In general, there are multiple processes (Fig. 9) that can alter the concentration and isotopic composition of nitrate in the top 7 cm of snow. Identifying these processes and quan-tifying them is beyond the scope of this study. Hence, in this manuscript the samples from the 7–30 cm depth range will be mainly considered with a few exceptions when results are consistent with a unidirectional process.
4.2 Isotopic fractionations
Due to an insignificant change in nitrate mass and isotopic composition, the linear fits for samples no. 0 and no. 1 from both pits were only weakly correlated and are not discussed. Better correlations were observed for samples collected late in the season.
4.2.1 The nitrogen isotopic fractions:15ε
The calculated nitrogen isotopic fractionation values (i.e., the slopes of the Rayleigh plots, correlation coefficients and
pvalues) for samples between depths of 7 and 30 cm in the control and UV pits are given in Table 2. Figure 10 shows the 15εapp values determined for the control and UV
ples collected below 7 cm. Accordingly, the control sam-ples possessed nearly constant and small negative appar-ent isotopic fractionation values between −7.4 ± 2.3 and
−15 ± 0.9 ‰. In contrast, the UV samples shown in Fig. 10 exhibited higher negative apparent nitrogen isotopic fraction-ations ranging from −18.0 ± 7.3 to −58.3 ± 20.0 ‰, which became progressively more negative over time. According to this figure, it seems that either 15ε evolves over time (i.e., from collection event no. 2 to no. 6), which contradicts the-ory (Berhanu et al., 2014), or there is an artifact introduced by removing the samples collected in the top 7 cm, where rel-atively larger nitrate mass change and isotopic fractionation were observed. An artifact due to removing all the samples at a depth of 0-7 cm is the most probable as samples from this depth exhibited maximal nitrate loss (about 80 % nitrate is lost) and significant enrichment in δ1515N when com-pared to samples below 7 cm. In addition, the depth where the abovementioned processes affect the surface snow may not be homogeneous in space and time. Hence, a new ap-proach is followed using the nitrate δ15N signal to identify data points that may be impacted by one or more of the pro-cesses explained above. Accordingly, the bending pattern in
δ15N observed for samples near the surface layers implies either the presence of another process or contamination by windblown snow with a different isotopic composition. As this bending pattern is inconsistent with a Rayleigh type pro-cess, we have excluded the samples from the surface level when the δ15N begins to decrease instead of increasing to
Figure 10. 15ε values determined for the control samples (tri-angles), UV samples excluding all samples between 0 and 7 cm (dashed line) and the UV samples obtained using the δ15N signal to identify data points affected by non-photolytic processes (cir-cles) rather than by excluding all 0–7 cm data. Note that excluding the entire top 7 cm data introduced an apparent trend where15εapp
decreases with time. Errors are determined by the least square fit method as in Frey et al. (2009).
more positive values and then recalculated the isotopic frac-tionations. Accordingly, only data points between 0 and 2 cm were excluded for sampling events UV no. 0 to UV no. 3. For later sampling events, UV no. 4 to UV no. 6, samples between depth of 0–6 cm were not considered in the new cal-culation of isotopic fractionations (shown using horizontal dashed lines in Figs. 3 and 5). The exclusion of more data points in the case of later sampling events was probably due to the fact that the external processes had more time to play a role in the modification of the near surface snow. The plots made based on these corrections are also shown in Fig. 10.
15ε
appvalues ranging from −59.8 to −73.0 ‰ were obtained,
irrespective of the sampling time. Therefore, the pattern ob-served under the first assumption (i.e., excluding all points in the top 7 cm) introduced an apparent evolution of15εappover
time as an artifact of the analysis. The average apparent iso-topic fractionation values derived using the second approach (−67.8 ± 12 ‰) are in excellent agreement with previous average apparent isotopic fractionations of −60 ± 10 ‰ at Dome C (Frey et al., 2009) and −59 ± 10 ‰ for the East Antarctic Plateau (Erbland et al., 2013) (Table 3). This data exclusion procedure based on the δ15N signal was applica-ble only to samples from sampling events between controls no. 4 and 6 as samples from the first two events (controls no. 2 and 3) showed no deviation in δ15N from the expected pattern (Fig. 3), and we have calculated a15εapp value of
−12.0 ± 1.7 ‰. As shown in Table 2, the observed change in the calculated15εappwas minor.
Based on the significant difference between the15εapp
val-ues of the control and UV samples, it is clear that the more highly negative isotopic fractionation is associated with so-lar UV photolysis. However, the small negative nitrogen iso-topic fractionation (an average of −12.3 ± 1.7 ‰) observed for the control samples may be due to a combination of
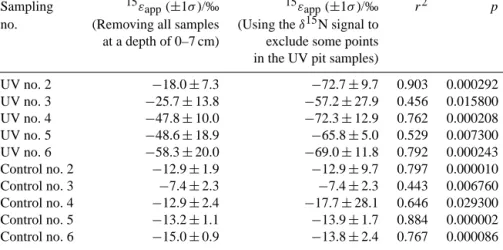
Table 2. The apparent nitrogen isotopic fractionations determined for both pits excluding all the samples between 0 and 7 cm or using the δ15N signal to identify whether samples were influenced by external processes. The correlation coefficients (r2)and significance (p) are also given for the derived15εappvalues derived using the δ15N signal. Note that due to insignificant change in nitrate mass and isotopic
composition, the linear fits for samples no. 0 and no. 1 from both pits were only weakly correlated and are not given in Table 2.
Sampling 15εapp(±1σ )/‰ 15εapp(±1σ )/‰ r2 p
no. (Removing all samples (Using the δ15N signal to at a depth of 0–7 cm) exclude some points in the UV pit samples)
UV no. 2 −18.0 ± 7.3 −72.7 ± 9.7 0.903 0.000292 UV no. 3 −25.7 ± 13.8 −57.2 ± 27.9 0.456 0.015800 UV no. 4 −47.8 ± 10.0 −72.3 ± 12.9 0.762 0.000208 UV no. 5 −48.6 ± 18.9 −65.8 ± 5.0 0.529 0.007300 UV no. 6 −58.3 ± 20.0 −69.0 ± 11.8 0.792 0.000243 Control no. 2 −12.9 ± 1.9 −12.9 ± 9.7 0.797 0.000010 Control no. 3 −7.4 ± 2.3 −7.4 ± 2.3 0.443 0.006760 Control no. 4 −12.9 ± 2.4 −17.7 ± 28.1 0.646 0.029300 Control no. 5 −13.2 ± 1.1 −13.9 ± 1.7 0.884 0.000002 Control no. 6 −15.0 ± 0.9 −13.8 ± 2.4 0.767 0.000086
minor photolysis and sublimation or desorption (which is present in the UV pit as well). Even if a comparable mass loss of nitrate was observed in the top 7 cm of both pits, the δ15N values are significantly different (Fig. 5). As the absorption cross section of nitrate is limited at wavelengths shorter than 340 nm, photodissociation of nitrate is not ex-pected at wavelengths longer than 375 nm (i.e., the cutoff of the control plexiglass plate). However, minor contributions from the average 15 % transmittance of the control plexi-glass plate and/or direct solar UV photolysis at high solar zenith angles and UV light scattering by the snow could po-tentially have resulted in some minor photolysis in the con-trol pit, even if no systematic bias was observed between edge and center samples. This implies that another process (e.g., sublimation of snow, desorption of nitrate) may take place, producing a significant nitrate mass change with only a minor change in isotopic composition. In a recent study of post-depositional isotopic effects in snow nitrate, it was veri-fied that sublimation of snow leads to an overall15N isotopic fractionation close to zero (0.9 ± 1.5 ‰ at −30◦C, a temper-ature relevant at Dome C), whereas natural snow is observed with a highly negative fractionation (15ε
app= −59 ± 10 ‰)
(Erbland et al., 2013). Therefore, a mixing of the evaporative and photolytic fractionation processes could conceivably re-sult in an isotopic fractionation on the order −12 ‰ in the control pit. In contrast, photolysis is the dominant process in the UV pit due to the presence of unobstructed solar UV, and we have determined highly negative isotopic fractiona-tions (15ε = −67.8 ± 12.0 ‰). Considering the presence of multiple processes, we cannot consider the values derived from the UV pits to represent purely photolytic isotopic frac-tionation values but rather apparent15εapp values, impacted
minimally by non-photolytic processes. Hence, the best es-timate for purely photolytic isotopic fractionation (15εphoto)
under the current experimental setup would be the difference between the apparent isotopic fractionations determined for the UV and control pits (−55.8 ± 12.0 ‰), as both pits were exposed to identical physical processes except exposure to solar UV. This value is in good agreement with a recent labo-ratory study by Berhanu et al. (2014), who irradiated natural snow collected at Dome C using a UV lamp with a 320 nm filter (similar but not identical to field conditions); a15εphoto
of −47.9 ± 6.8 ‰ was reported (Berhanu et al., 2014). The slightly less negative15εphotovalue obtained for the
labora-tory experiment may be the result of an inability to fully re-produce the solar spectrum under laboratory conditions, in contrast to the field where the snow was exposed to natural solar UV.
We also made a comparison between the isotopic fraction-ations obtained from the field study and a theoretical estimate made using the 1ZPE shift model, as described in Frey et al. (2009) and recently modified by Berhanu et al. (2014). The newly modified model incorporates changes in width and amplitude, in addition to changes in the center wave-length, during isotopic substitution. By applying a 1 % width reduction factor and an amplitude increase of 1 %, in addi-tion to a shift of +32.5 cm−1 in the center of the
absorp-tion cross secabsorp-tion of15NO3 relative to 14NO3, the authors
derived an apparent 15ε value of −55.1 ‰ under Dome C conditions (Berhanu et al., 2014). Following this approach and considering the solar UV transmittance of the plexiglass plates, as well as using the solar actinic flux measured at Dome C on 7 January 2012 at 14:00 LT (Ghislan Picard, per-sonal communication, 2013), we calculated a15εphotovalue
of −52.6 ‰ for the UV-exposed pit. This value is also in agreement with the 15εphoto obtained from the laboratory
study but higher than the value determined for the UV pit, implying that complications arise from multiple processes in
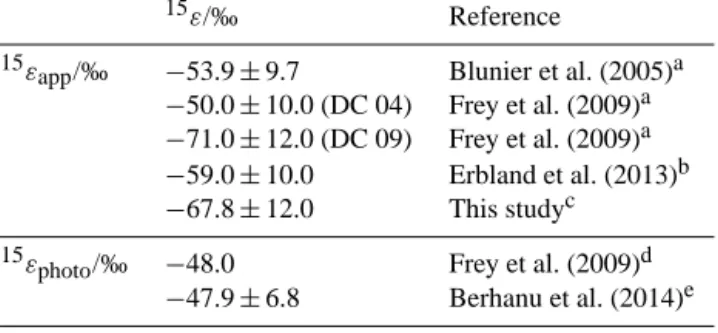
Table 3. Apparent isotopic fractionations (15εapp)observed in
pre-vious studies compared to the results obtained here.
15ε/‰ Reference
15ε
app/‰ −53.9 ± 9.7 Blunier et al. (2005)a
−50.0 ± 10.0 (DC 04) Frey et al. (2009)a −71.0 ± 12.0 (DC 09) Frey et al. (2009)a −59.0 ± 10.0 Erbland et al. (2013)b −67.8 ± 12.0 This studyc
15ε
photo/‰ −48.0 Frey et al. (2009)d
−47.9 ± 6.8 Berhanu et al. (2014)e
aValues determined for Dome C.bAn apparent average value derived for different
locations on the East Antarctic Plateau.cThe15εdetermined for the UV samples in
this study.dDetermined using the ZPE shift model and using the solar actinic flux of Dome C derived from snow TUV model.eA laboratory result observed using snow from Dome C and a Xe lamp with a UV filter at 320 nm (relevant to Dome C conditions) (Berhanu et al., 2014).
the field study. However, we note that the difference between the UV and control experiments brings the apparent isotopic fractionation closer to the pure photolysis isotopic fraction value (−67.8 to −55.8 ‰).
4.2.2 Oxygen isotopic fractionations:18ε and17E
Before calculating the oxygen isotopic fractionations, we ap-plied the same data exclusion procedure as above for δ18O and 117O measurements (not shown in the figures). For the control pit samples, we determined18εvalues ranging from
−2.1 to 3.9 ‰ with an average value of (0.2 ± 2.6) ‰. These low 18ε values are due to an insignificant change in iso-topic values. In contrast, the UV exposed snow samples have nearly stable18εvalues ranging from 9.0 to 13.0 ‰ and an average value of (12.5 ± 6.7) ‰, in good agreement with pre-vious measurements (Table 4).
The 17E values for the control samples were not signif-icantly different from zero, whereas the UV samples pos-sessed17Evalues of 1.1 to 2.2 ‰ with an average17Evalue of (2.2 ± 1.4) ‰, in good agreement with previous studies (Table 4). This is probably due to the “cage effect”, wherein the photoproducts resulting from the photolysis of nitrate immediately undergo isotopic exchange with the surround-ing OH and/or water (117O ≈ 0) and reform secondary ni-trate with 117O values approaching 0 (McCabe et al., 2005). However, compared to the variations observed in snow and ice below the photic zone (> 5 ‰) (Erbland et al., 2013; Sofen et al., 2014), changes in 117O due to the cage effect (ca. 2 ‰) can be considered negligible. Another interesting observation is the greater scattering of the 117O observed for the UV pit, clearly indicating that the cage effect phe-nomenon is initiated by UV radiation.
Table 4. Compiled18εand17Evalues obtained from this study for the UV samples and previous studies.
18ε UV(±1σ )/‰ 17EUV(±1σ )/‰ Reference 6.0 ± 3.0 (DC 04) 1.0 ± 0.2 Frey et al. (2009)a 9.0 ± 2.0 (DC 09) 2.0 ± 0.6 Frey et al. (2009)a 8.7 ± 2.4 2.0 ± 1.0 Erbland et al. (2013)b 12.5 ± 6.7 2.2 ± 1.4 This studyc
aDetermined by Frey et al. (2009) at Dome C during the summer campaigns in 2004
and 2007.bAn average value determined by Erbland et al. (2013) for the East
Antarctic Plateau.cAn average value determined by this study for all the UV samples.
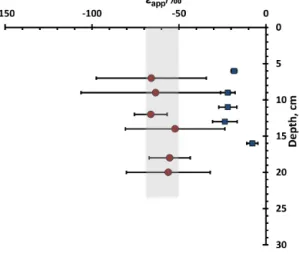
4.3 Depth dependence of isotopic fractionations
For the samples collected at a depth of 7–20 cm from all batches and then binned together according to depth, the derived isotopic fractionations at each depth are shown in Fig. 11. We have calculated a nitrogen isotopic fractiona-tion value ranging from −7.8 to −23.6 ‰ for the control samples in the 7–16 cm depth range. However, the UV sam-ples exhibited more highly negative fractionations ranging from −52.2 to −65.9 ‰ with depth. The average 15εapp
value of −59.9 ± 24.7 ‰ derived for these samples is in good agreement with the average apparent isotopic fractionation of
−67.9 ± 12.0 ‰ derived from the experimental UV-exposed pit. The large error bars in Fig. 11 are due to the small sam-ple size and the relatively large uncertainty in the depth mea-surement, as all the layers might not have been at exactly the same depth during each sampling event, which may have led to the mixing of layers. The depth could also have changed over the course of the study due to the compaction of the snow with time. The insensitivity of15εapp with depth
im-plies that, even if the number of photons decreases with depth in the snowpack, the spectrum of the solar actinic flux is not strongly altered, at least to the depth considered in this study. Berhanu et al. (2014) also observed a similar depth insensi-tivity of the nitrogen isotopic fractionations in their labora-tory study, where snow from Dome C was irradiated with a UV lamp closely matching the solar irradiance encoun-tered at Dome C. From their measurement of actinic flux with depth in a snow column, a uniform attenuation of in-coming flux was observed, leading to almost constant 15ε
values with depth in the snow column. The insensitivity of
15ε with depth is a useful feature for the analysis of δ15N
records obtained from deep ice cores used to understand past atmospheric changes, simplifying the interpretation of the
δ15N records associated with solar UV photolysis at differ-ent depths. Differdiffer-ent modeling studies (such as the TRAN-SIT model (Erbland et al., 2015)) are currently attempting to use ice core δ15N(NO−3)records to constrain historic varia-tions in atmospheric oxidation capacity, changes in the ozone column and solar variability.
The18εand17Evalues derived with depth also have a very weak Rayleigh fitting at lower depth (below 10–15 cm), and
Figure 11. The depth profile of15εfor the UV pit. The15εwas calculated from samples collected at the same depth during each sampling event. Error bars are calculated using the least square fit method as in Frey et al. (2009). The shaded region represents the measured15εrange of −50 to −70 ‰.
are associated with large uncertainties. This is mainly due to the minor change in the oxygen isotopic signal, in stark con-trast to the N isotopes, where relatively strong signals were obtained. Further studies will be required to better constrain the isotopic fractionations, especially for oxygen isotopes.
5 Conclusions
In this experimental study from Dome C, Antarctica, we in-vestigated the effect of photolysis on the concentration and stable isotope ratios of nitrate in snow by comparing two identical snow pits, with one of the two exposed to solar UV. Using the combined concentration and δ15N signals, we have determined an average 15εapp value of −67.8 ± 12 ‰
for UV-exposed samples collected at a 10-day frequency between 1 December 2011 and 30 January 2012. These values were fairly stable throughout the season and are in good agreement with previously determined isotopic frac-tionations at Dome C. These values are significantly dif-ferent from the15εapp values obtained for the control
sam-ples (−12.3 ± 1.7 ‰). Considering the fact that the two experimental pits were exposed to identical physical pro-cesses, the difference in their apparent isotopic fractionation (−55.8 ± 12.0 ‰) should be considered as the best estimate of isotopic fractionation due to photolysis. While mass loss seems to be smaller at depth in the UV-exposed pit, a stronger change in δ15N was observed. This is a direct consequence of the high-fractionation factor of the photolysis process in which a small change in concentration is translated into a high variation in the isotope ratios.
When compared to the15εphoto values of −47.9 ± 6.8 ‰
obtained in a laboratory experiment by Berhanu et al. (2014), where the photolytic process was isolated, the measured
val-ues for the UV-exposed samples are slightly lower (i.e., more highly negative but still within the mutual error intervals). This difference might be associated with experimental de-sign, as the laboratory conditions do not exactly replicate the solar spectrum, even if better control is possible in terms of temperature stability, and product removal relative to the field experiment. Other confounding factors may include dif-ferences in the chemical domain of nitrate (Meusinger et al., 2014) or changes due to the temperature dependence of the nitrate absorption cross section. It should also be noted that the field experiments show small influences due to non-photolytic processes such as desorption, deposition and/or contamination by windblown snow.
We have also determined the depth dependence of the iso-topic fractionations from the UV-exposed snow pit samples that were binned together according to depth and observed that the15εappvalues are nearly insensitive to depth. Despite
the fact that the15εappvalues derived at different depths are
associated with larger error bars, the observations are in good agreement with a previous laboratory study (Berhanu et al., 2014). In addition, previous studies did not show a strong change in spectral distribution of UV light as light propagates through the snow (Meusinger et al., 2014). Further study is necessary to validate such conclusions, for example via sam-pling different sites with same depth profiles and determining the isotopic fractionations.
It is important to reiterate some of the possible limita-tions of this experiment. Due to the unavoidable mechani-cal modification of the snow during the filling of the sam-ple pits with windblown snow, the snow used in this study did not have exactly the same physical properties (grain size, density, compactness, optical properties, etc.) as the natural snowpack. This may have resulted in a modification of light scattering within the snowpack. Additionally, the snow used in this study possessed a nitrate concentration more than 1 order of magnitude higher than what is normally measured in snow pits at Dome C, and this may have impacted nitrate chemistry in the experimental snow pits. However, to the best of our knowledge, our study is the first to attempt a replica-tion of field constraints (natural shape and size, natural con-centration and exposure, natural location of the nitrate in the snow grains, as well as meteorological conditions). Finally, we have not included some of the data points in the top lay-ers of both pits due to possible complications due to multiple processes (mixing, sublimation, desorption, contamination, etc.). Hence, this procedure may also have introduced a small underestimation in our15εappvalues, and this should be kept
in mind when using the values obtained in this study. The results obtained here, together with results described previously in the literature (Frey et al., 2009; Erbland et al., 2013; Berhanu et al., 2014), represent a strong body of ev-idence that solar UV photolysis is the most relevant post-depositional process modifying stable isotope ratios of snow nitrate at low-accumulation sites, where most deep ice cores are drilled.
The Supplement related to this article is available online at doi:10.5194/acp-15-11243-2015-supplement.
Acknowledgements. The research leading to these results has
received funding from the European Community’s Seventh Frame-work Programme (FP7/2007-2013) under the grant agreement number 237890. LEFE-IMAGO, a scientific program of the Institut National des Sciences de l’Univers (INSU/CNRS), has also provided partial funding for this study. We would like to thank INSU for its financial support for lab experiments through its LEFE program. The Agence nationale de la recherche (ANR) is gratefully acknowledged for its financial support through the OPALE project (contract NT09-451281). The Institute Polaire Paul-Emile Victor (IPEV) supported the research and polar logistics through the program SUNITEDC No. 1011. This work has been partially supported by a grant from Labex OSUG@2020 (Investissements d’avenir – ANR10 LABX56). We would also like to thank Erwan Vince for his significant contribution in sample analysis.
Edited by: T. Bartels-Rausch
References
Aristidi, E., Agabi, K., Azouit, M., Fossat, E., Vernin, J., Travouil-lon, T., Lawrence, J. S., Meyer, C., Storey, J. W. V., Halter, B., Roth, W. L., and Walden, V.: An analysis of temperatures and wind speeds above Dome C, Antarctica, Astron. Astrophys., 430, 739–746, doi:10.1051/0004-6361:20041876, 2005.
Berhanu, T. A., Meusinger, C., Erbland, J., Jost, R., Bhattacharya, S. K., Johnson, M. S., and Savarino, J.: Laboratory study of nitrate photolysis in Antarctic snow. II. Isotopic effects and wavelength dependence, J. Chem. Phys., 140, 244306, doi:10.1063/1.4882899, 2014.
Blunier, T., Floch, G. L., Jacobi, H. W., and Quansah, E.: Isotopic view on nitrate loss in Antarctic surface snow, Geophys. Res. Lett., 32, L13501, doi:10.1029/2005gl023011, 2005.
Bohlke, J. K., Mroczkowski, S. J., and Coplen, T. B.: Oxy-gen isotopes in nitrate: new reference materials for O-18 : O-17 : O-16 measurements and observations on nitrate-water equilibration, Rapid Commun. Mass Sp., 17, 1835–1846, doi:10.1002/Rcm.1123, 2003.
Casciotti, K. L., Sigman, D. M., Hastings, M. G., Bohlke, J. K., and Hilkert, A.: Measurement of the oxygen isotopic composition of nitrate in seawater and freshwater using the denitrifier method, Anal. Chem., 74, 4905–4912, doi:10.1021/Ac020113w, 2002. Chen, G., Davis, D., Crawford, J., Nowak, J. B., Eisele, F.,
Mauldin, R. L., Tanner, D., Buhr, M., Shetter, R., Lefer, B., Arimoto, R., Hogan, A., and Blake, D.: An investigation of South Pole HOx chemistry: Comparison of model results
with ISCAT observations, Geophys. Res. Lett., 28, 3633–3636, doi:10.1029/2001gl013158, 2001.
Cliff, S. S. and Thiemens, M. H.: High-Precision Isotopic Deter-mination of the O-18 / O-16 and O-17 / O-16 Ratios in Nitrous-Oxide, Anal. Chem., 66, 2791–2793, doi:10.1021/Ac00089a031, 1994.
Crawford, J. H., Davis, D. D., Chen, G., Buhr, M., Oltmans, S., Weller, R., Mauldin, L., Eisele, F., Shetter, R., Lefer, B., Arimoto, R., and Hogan, A.: Evidence for photochemical production of ozone at the South Pole surface, Geophys. Res. Lett., 28, 3641– 3644, doi:10.1029/2001gl013055, 2001.
Dibb, J. E., Talbot, R. W., Munger, J. W., Jacob, D. J., and Fan, S. M.: Air-snow exchange of HNO3 and NOy at
Sum-mit, Greenland, J. Geophys. Res.-Atmos., 103, 3475–3486, doi:10.1029/97jd03132, 1998.
Domine, F. and Shepson, P. B.: Air-snow interactions and atmospheric chemistry, Science, 297, 1506–1510, doi:10.1126/Science.1074610, 2002.
Erbland, J., Vicars, W. C., Savarino, J., Morin, S., Frey, M. M., Frosini, D., Vince, E., and Martins, J. M. F.: Air–snow transfer of nitrate on the East Antarctic Plateau – Part 1: Isotopic evi-dence for a photolytically driven dynamic equilibrium in sum-mer, Atmos. Chem. Phys., 13, 6403–6419, doi:10.5194/acp-13-6403-2013, 2013.
Erbland, J., Savarino, J., Morin, S., France, J. L., Frey, M. M., and King, M. D.: Air–snow transfer of nitrate on the East Antarctic plateau – Part 2: An isotopic model for the interpretation of deep ice-core records, Atmos. Chem. Phys. Discuss., 15, 6887–6966, doi:10.5194/acpd-15-6887-2015, 2015.
France, J. L., King, M. D., Frey, M. M., Erbland, J., Picard, G., Preunkert, S., MacArthur, A., and Savarino, J.: Snow optical properties at Dome C (Concordia), Antarctica; implications for snow emissions and snow chemistry of reactive nitrogen, At-mos. Chem. Phys., 11, 9787–9801, doi:10.5194/acp-11-9787-2011, 2011.
Frey, M. M., Savarino, J., Morin, S., Erbland, J., and Martins, J. M. F.: Photolysis imprint in the nitrate stable isotope signal in snow and atmosphere of East Antarctica and implications for reactive nitrogen cycling, Atmos. Chem. Phys., 9, 8681–8696, doi:10.5194/acp-9-8681-2009, 2009.
Gallet, J.-C., Domine, F., Arnaud, L., Picard, G., and Savarino, J.: Vertical profile of the specific surface area and density of the snow at Dome C and on a transect to Dumont D’Urville, Antarc-tica – albedo calculations and comparison to remote sensing products, The Cryosphere, 5, 631–649, doi:10.5194/tc-5-631-2011, 2011.
Grannas, A. M., Jones, A. E., Dibb, J., Ammann, M., Anastasio, C., Beine, H. J., Bergin, M., Bottenheim, J., Boxe, C. S., Carver, G., Chen, G., Crawford, J. H., Dominé, F., Frey, M. M., Guzmán, M. I., Heard, D. E., Helmig, D., Hoffmann, M. R., Honrath, R. E., Huey, L. G., Hutterli, M., Jacobi, H. W., Klán, P., Lefer, B., McConnell, J., Plane, J., Sander, R., Savarino, J., Shepson, P. B., Simpson, W. R., Sodeau, J. R., von Glasow, R., Weller, R., Wolff, E. W., and Zhu, T.: An overview of snow photochemistry: evi-dence, mechanisms and impacts, Atmos. Chem. Phys., 7, 4329– 4373, doi:10.5194/acp-7-4329-2007, 2007.
Hastings, M. G., Jarvis, J. C., and Steig, E. J.: Anthropogenic Im-pacts on Nitrogen Isotopes of Ice-Core Nitrate, Science, 324, 1288–1288, doi:10.1126/Science.1170510, 2009.
Honrath, R. E., Peterson, M. C., Guo, S., Dibb, J. E., Shepson, P. B., and Campbell, B.: Evidence of NOxproduction within or upon
ice particles in the Greenland snowpack, Geophys Res Lett, 26, 695–698, doi:10.1029/1999gl900077, 1999.
Kaiser, J., Hastings, M. G., Houlton, B. Z., Rockmann, T., and Sigman, D. M.: Triple oxygen isotope analysis of nitrate using
the denitrifier method and thermal decomposition of N2O, Anal. Chem., 79, 599–607, doi:10.1021/Ac061022s, 2007.
Legrand, M. R. and Kirchner, S.: Origins and Variations of Nitrate in South Polar Precipitation, J. Geophys. Res.-Atmos., 95, 3493– 3507, doi:10.1029/Jd095id04p03493, 1990.
Mack, J. and Bolton, J. R.: Photochemistry of nitrite and nitrate in aqueous solution: a review, J. Photoch. Photobio. A, 128, 1–13, doi:10.1016/S1010-6030(99)00155-0, 1999.
McCabe, J. R., Boxe, C. S., Colussi, A. J., Hoffmann, M. R., and Thiemens, M. H.: Oxygen isotopic fractionation in the photo-chemistry of nitrate in water and ice, J. Geophys. Res.-Atmos., 110, D15310, doi:10.1029/2004jd005484, 2005.
Meusinger, C., Berhanu, T. A., Erbland, J., Savarino, J., and John-son, M. S.: Laboratory study of nitrate photolysis in Antarc-tic snow. I. Observed quantum yield, domain of photoly-sis, and secondary chemistry, J. Chem. Phys., 140, 244305, doi:10.1063/1.4882898, 2014.
Michalski, G., Savarino, J., Bohlke, J. K., and Thiemens, M.: Deter-mination of the total oxygen isotopic composition of nitrate and the calibration of a Delta O-17 nitrate reference material, Anal. Chem., 74, 4989–4993, doi:10.1021/ac0256282, 2002.
Miller, C. E.: Photo-induced isotopic fractionation of stratospheric nitrous oxide, Abstr. Pap. Am. Chem. S., 219, U312–U312, 2000. Morin, S., Savarino, J., Frey, M. M., Yan, N., Bekki, S., Bottenheim, J. W., and Martins, J. M. F.: Tracing the Origin and Fate of NO(x) in the Arctic Atmosphere Using Stable Isotopes in Nitrate, Sci-ence, 322, 730–732, doi:10.1126/Science.1161910, 2008. Morin, S., Savarino, J., Frey, M. M., Domine, F., Jacobi, H. W.,
Kaleschke, L., and Martins, J. M. F.: Comprehensive isotopic composition of atmospheric nitrate in the Atlantic Ocean bound-ary layer from 65◦S to 79◦N, J. Geophys. Res.-Atmos., 114, D05303, doi:10.1029/2008jd010696, 2009.
Röthlisberger, R., Hutterli, M. A., Wolff, E. W., Mulvaney, R., Fis-cher, H., Bigler, M., Goto-Azuma, K., Hansson, M. E., Ruth, U., Siggaard-Andersen, M. L., and Steffensen, J. P.: Nitrate in Greenland and Antarctic ice cores: a detailed description of post-depositional processes, Ann. Glaciol.-Ser., 35, 209–216, doi:10.3189/172756402781817220, 2002.
Savarino, J., Kaiser, J., Morin, S., Sigman, D. M., and Thiemens, M. H.: Nitrogen and oxygen isotopic constraints on the origin of atmospheric nitrate in coastal Antarctica, Atmos. Chem. Phys., 7, 1925–1945, doi:10.5194/acp-7-1925-2007, 2007.
Savarino, J., Morin, S., Erbland, J., Grannec, F., Patey, M. D., Vicars, W., Alexander, B., and Achterberg, E. P.: Iso-topic composition of atmospheric nitrate in a tropical marine boundary layer, P. Natl. Acad. Sci. USA, 110, 17668–17673, doi:10.1073/pnas.1216639110, 2013.
Schmidt, J. A., Johnson, M. S., and Schinke, R.: Isotope effects in N2O photolysis from first principles, Atmos. Chem. Phys., 11,
8965–8975, doi:10.5194/acp-11-8965-2011, 2011.
Sigman, D. M., Casciotti, K. L., Andreani, M., Barford, C., Galanter, M., and Bohlke, J. K.: A bacterial method for the nitro-gen isotopic analysis of nitrate in seawater and freshwater, Anal. Chem., 73, 4145–4153, 2001.
Sofen, E. D., Alexander, B., Steig, E. J., Thiemens, M. H., Kunasek, S. A., Amos, H. M., Schauer, A. J., Hastings, M. G., Bautista, J., Jackson, T. L., Vogel, L. E., McConnell, J. R., Pasteris, D. R., and Saltzman, E. S.: WAIS Divide ice core suggests sustained changes in the atmospheric formation pathways of sulfate and ni-trate since the 19th century in the extratropical Southern Hemi-sphere, Atmos. Chem. Phys., 14, 5749–5769, doi:10.5194/acp-14-5749-2014, 2014.
Turnbull, J. C., Sweeney, C., Karion, A., Newberger, T., Lehman, S. J., Tans, P. P., Davis, K. J., Lauvaux, T., Miles, N. L., Richardson, S. J., Cambaliza, M. O., Shepson, P. B., Gurney, K., Patarasuk, R., and Razlivanov, I.: Toward quantification and source sector identification of fossil fuel CO2emissions from an urban area:
Results from the INFLUX experiment, J. Geophys. Res.-Atmos., 120, 292–312, doi:10.1002/2014jd022555, 2015.
Vicars, W. C., Morin, S., Savarino, J., Wagner, N. L., Erbland, J., Vince, E., Martins, J. M. F., Lerner, B. M., Quinn, P. K., Coff-man, D. J., Williams, E. J., and Brown, S. S.: Spatial and diur-nal variability in reactive nitrogen oxide chemistry as reflected in the isotopic composition of atmospheric nitrate: Results from the CalNex 2010 field study, J. Geophys. Res.-Atmos., 118, 10567– 10588, doi:10.1002/Jgrd.50680, 2013.
Werner, R. A. and Brand, W. A.: Referencing strategies and tech-niques in stable isotope ratio analysis, Rapid Commun. Mass. Sp., 15, 501–519, doi:10.1002/Rcm.258, 2001.
Wolff, E. W.: Nitrate in polar ice, Nato ASI Ser. Ser. I, 30, 195–224, 1995.
Wolff, E. W.: Ice sheets and nitrogen, Philos. T. R. Soc. B, 368, 20130127, doi:10.1098/Rstb.2013.0127, 2013.
Yung, Y. L. and Miller, C. E.: Isotopic fractionation of stratospheric nitrous oxide, Science, 278, 1778–1780, doi:10.1126/Science.278.5344.1778, 1997.
Zhou, M. Y., Zhang, Z. H., Zhong, S. Y., Lenschow, D., Hsu, H. M., Sun, B., Gao, Z. Q., Li, S. M., Bian, X. D., and Yu, L. J.: Observations of near-surface wind and tempera-ture structempera-tures and their variations with topography and lati-tude in East Antarctica, J. Geophys. Res.-Atmos., 114, D17115, doi:10.1029/2008jd011611, 2009.