HAL Id: hal-00328480
https://hal.archives-ouvertes.fr/hal-00328480
Submitted on 9 Feb 2007
HAL is a multi-disciplinary open access
archive for the deposit and dissemination of
sci-entific research documents, whether they are
pub-lished or not. The documents may come from
teaching and research institutions in France or
abroad, or from public or private research centers.
L’archive ouverte pluridisciplinaire HAL, est
destinée au dépôt et à la diffusion de documents
scientifiques de niveau recherche, publiés ou non,
émanant des établissements d’enseignement et de
recherche français ou étrangers, des laboratoires
publics ou privés.
valleys of the French Alps. I: EC/OC fractions
G. Aymoz, J. L. Jaffrezo, D. Chapuis, J. Cozic, W. Maenhaut
To cite this version:
G. Aymoz, J. L. Jaffrezo, D. Chapuis, J. Cozic, W. Maenhaut. Seasonal variation of PM10 main
constituents in two valleys of the French Alps. I: EC/OC fractions. Atmospheric Chemistry and
Physics, European Geosciences Union, 2007, 7 (3), pp.675. �hal-00328480�
© Author(s) 2007. This work is licensed under a Creative Commons License.
Chemistry
and Physics
Seasonal variation of PM
10
main constituents in two valleys of the
French Alps. I: EC/OC fractions
G. Aymoz1,*, J. L. Jaffrezo1, D. Chapuis2, J. Cozic1,**, and W. Maenhaut3
1Laboratoire de Glaciologie et G´eophysique de l’Environnement, 54 rue Moli`ere, 38402 Saint Martin D’H`eres Cedex, France
2L’Air de l’Ain et des Pays de Savoie (Air-APS), 430 rue de la Belle Eau, ZI des Landiers Nord, 73000 Chamb´ery, France
3Department of Analytical Chemistry, Institute for Nuclear Sciences, Ghent University, Proeftuinstraat 86, BE-9000 Gent,
Belgium
*now at: INERIS, Parc technologique Alata, BP 2, 60550 Verneuil-en-Halatte, France
**now at: Paul Scherrer Institute (PSI), CH-5232 Villigen, Switzerland
Received: 3 May 2006 – Published in Atmos. Chem. Phys. Discuss.: 12 July 2006 Revised: 16 January 2007 – Accepted: 5 February 2007 – Published: 9 February 2007
Abstract. Daily PM10 samples were collected at two
ur-ban sites within two valleys in the French Alps (Chamonix and St Jean de Maurienne) during a period of two and a half years. The carbonaceous species EC (elemental car-bon) and OC (organic carcar-bon) were analysed to investigate the possible sources of EC and OC, and their seasonal varia-tions. Mean OC concentrations are in the very high range of concentrations measured for other European sites, and
rep-resent at least one third of the PM10 mass on each site. On
the basis of the comparison between EC and OC concentra-tions with several tracers, we were able to show that their main sources are local primary combustion sources. Biomass burning emissions (residential heating) have a significant im-pact on OC concentrations while heavy duty traffic emissions have an impact only on EC concentrations. Finally, we esti-mated the contribution of SOA (secondary organic carbon) to OC, using the EC-to-OC primary ratio method (Castro et al., 1999) and demonstrated that the calculation of SOA mass with this method is highly uncertain, if the hypothesis of a constant primary EC-to-OC ratio is not very closely exam-ined.
1 Introduction
The morphology of deep valleys in mountainous areas, the local meteorology, and high concentration of emis-sion sources create potential conditions for intense pollu-tion episodes in these sensitive areas. Previous programs in European alpine areas include TRANSALP (Ambrosseti et al., 1998), TRACT (L¨offler-Mang et al., 1998), POL-LUMET (Lehning et al., 1996), the Bolzano project (Dosio
Correspondence to: G. Aymoz
et al., 2001), VOTALP I (Wotawa and Kromp-Kolb, 2000; Furger et al., 2000) and VOTALP II (http://www.boku.ac.at/ imp/votalp/votalpII.pdf), a program over the Grenoble area (France) (Couach et al., 2003), and a study around the “Mas-sif du Mont Blanc” (Espace Mont Blanc, 2003). However, none of these programs really focused on multiphase atmo-spheric chemistry with emphasis on aerosol, while particle loadings are often one of the most critical aspects of pollution episodes in this kind of environment (Ward et al., 2004). This
last point fosters questions on the origin and fate of PM10, as
well as on the characteristics of the particles, in order to pro-mote countermeasures for reducing the atmospheric load.
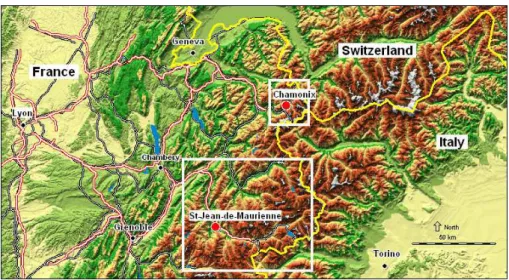
Following the accident in the Mont Blanc Tunnel in the French Alps (cf. Fig. 1) on 24 March, 1999, all interna-tional traffic between France and Italy was stopped through the Chamonix valley and mostly transferred to the Mauri-enne valley. Traffic in this last valley increased from an av-erage of 2150 trucks per day before the accident up to 4250 trucks per day after, on average, under the Frejus Tunnel be-tween France and Italy. In the Chamonix valley, residual traf-fic after the accident amounted to about 750 trucks per day, mainly local traffic. These very large changes of the traffic patterns created an interesting situation to perform studies for the evaluation of the impact of vehicles emission, partic-ularly those of heavy duty traffic. International transit under the Mont Blanc Tunnel resumed without any restrictions on March 1st, 2003. The program POVA (Pollution des Vall´ees Alpines) started in May 2000. The objectives were to de-velop atmospheric modelling at the sub meso scale (Brulfert et al., 2005), in order to perform scenarios studies of the impact on air quality of changes of traffic and of local de-velopments, taking into account gas and particles emissions. One aspect of the program consisted in a longer-term daily sampling at one site in each valley for a set of properties
Fig. 1. Sampling areas in the French Alps.
including chemistry of the PM10. The goals were to better
constrain large-scale processes influencing atmospheric con-centrations, including regional transport, meteorological fac-tors, and seasonal variations in the type and strength of the emission sources.
In this paper, we are presenting the results of the PM10
speciation for carbonaceous species (elemental carbon (EC) and organic carbon (OC)), conducted during this long-term sampling at the two sites. The general importance of this or-ganic fraction in the particulate phase is well synthesized in Kanakidou et al. (2004) and Putaud et al. (2004). Results are completed with data on regulated atmospheric components
(O3, NO, NOx, PM10, SO2), and with meteorological and
traffic data. Results obtained by ionic chromatography (Jaf-frezo et al., 2006a) for concentrations of soluble potassium
(K+)in PM
10 are also presented. K+is used as a tracer for
biomass burning emissions. We are aiming at an evaluation of the variability of the contributions of the carbonaceous
components to the PM10mass, with some assessment of the
main sources and factors driving the variability of its concen-trations in the very specific context of these alpine valleys.
2 Experimental
2.1 Sites and traffic
One sampling site was located in the Chamonix valley. This valley is rather short (23 km long) and narrow (1 to 2 km wide on average on the bottom part), with an average altitude of 1000 m above sea level (masl) at the valley floor. It is sur-rounded by mountains culminating with the Mont Blanc peak (4807 masl). There are no industries or waste incinerators in the valley, and the main anthropogenic sources of emissions are the traffic, residential heating (mostly with fossil fuel and wood burning), and some agricultural activities. The resident
population is about 12,000 but tourism brings in many peo-ple (about 10 000 per day on average), mainly for short term visits. There is only one main road supporting all of the traf-fic in and out of the valley, but many secondary roads spread over all of the valley floor and on the lower slopes. During the closing of the Mont Blanc Tunnel leading to Italy, the traffic at the entrance of the valley was mostly composed of cars (90% of the total, including 50% diesel powered), with a low contribution of local trucks (5%) and of buses for tourism (1%). Natural emission sources are limited to the forested ar-eas. The sampling site was located in the downtown area of
the Chamonix town (6◦52’16” E; 45◦55’26” N; altitude 1038
masl), about 10 meters from a street. It can be considered as a kerbside site.
The second sampling site was located in the Maurienne valley, with Saint Jean de Maurienne being about 80 km from Chamonix, on the SSW (cf Fig. 1). This valley is much longer (about 80 km long) and wider (about 3–5 km wide on average at the valley floor) than the Chamonix one. The surrounding mountains are also lower, peaking at 3852 masl at the Grande Casse. The altitude of the valley mouth is 330 masl, increasing up to 2081 masl at the Col du Mont Ce-nis, leading to Italy. The lower 30 km of the valley up to the town of Saint Jean de Maurienne support some heavy indus-tries, with among others steel transformation, and aluminium and phosphorus production. Other anthropogenic emissions are linked to the traffic, with a large share of it (95% of the trucks and 55% of the cars) taking place on the 50 km of the highway leading from the valley mouth up to Modane where is located the entrance of the Tunnel du Fr´ejus lead-ing to Italy. The valley also supports agricultural activities, and some large natural areas. The total population of the valley is about 45 000, with most of it concentrated in the lower 40 km. Tourism is not as important as in Chamonix and brings in people mostly during the winter season and
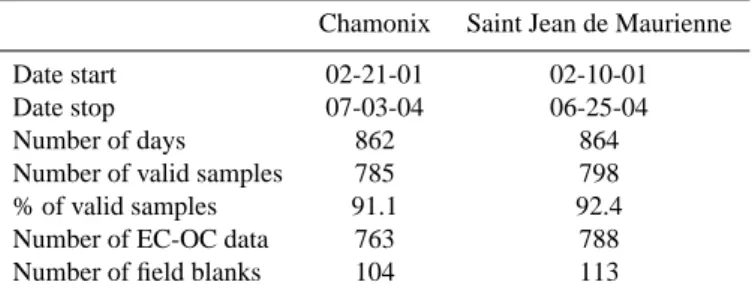
Table 1. Sampling dates, and statistics on sampling at both sites.
Chamonix Saint Jean de Maurienne Date start 02-21-01 02-10-01
Date stop 07-03-04 06-25-04
Number of days 862 864
Number of valid samples 785 798 % of valid samples 91.1 92.4 Number of EC-OC data 763 788 Number of field blanks 104 113
mostly in the upper part of the valley. The sampling site was located in a residential urban area of Saint Jean de
Mauri-enne (6◦21’04” E; 45◦16’34” N; altitude 555 masl), about
2 km from the highway and of some large aluminium plants. It can be considered as an urban background site.
2.2 Sampling
Both sites are permanent stations maintained by the local Air Quality Agency, l’Air de L’Ain et des Pays de Savoie
(http://www.atmo-rhonealpes.org/). Continuous
measure-ments at the stations were performed on a 15 min basis and
included NOx(Environnement SA, AC31M), O3
(Environ-nement SA, O341M), SO2 (Environnement SA, AS21M),
and PM10(TEOM1400, R and P). The TEOMs were heated
at 50◦C. Air intakes for all these instruments were located
about 4 m above ground on the roofs of the shelters. For this program, we added automatic aerosol sampling with Accu samplers (R and P) on the by-pass flow of the TEOMs. These samplers where kept (together will all of the other instruments) in a non-heated shelter. All the tubing of the Accu systems were replaced with Teflon coated lines. We used stainless steel filter holders with a conical shape to in-sure homogeneous deposit on the filters. Sampling was con-ducted on a daily basis, from midnight to midnight (local
time), at a flow rate of 0.85 m3.hr−1. The samplers were
ser-viced once a week, with the collection of 7 samples and one field blank. We used Whatman QM-A quartz fibre filters. These were pre-washed for 3 days in 3 successive bathes of Milli-Q water for lowering blanks for ionic species. Then, after drying at low temperature in an oven, they were fired
for 1 h at 800◦C to lower the blank levels for EC and OC.
Filters were kept and transported to the field by packs of 20 in leak proof glass jars before sampling. After sampling, ex-posed filters were downloaded directly in the field and stored
at –5◦C in individual Petri slides wrapped up in aluminium
foil in sealed bags, until analysis. All handling procedures were designed to reduce potential contaminations.
Sampling was maintained between 21 February 2001 and 3 July 2003 in Chamonix and between 10 February 2001 and 25 June 2003 in Saint Jean de Maurienne. The number of
samples and field blanks are presented in Table 1. More than 760 concentrations for EC and OC were determined for each site. While the data series are not totally continuous, the numbers of samples are high enough to give a very good rep-resentation of the variability of the concentrations over the sampling periods.
2.3 Analysis for EC and OC
Samples were analyzed for EC and OC using the Thermo-Optical Transmission (TOT) method on Sunset Lab analyzers (Birch and Cary, 1996). Operating principles of this analyser are now well known. The main difficulty is in the correct sep-aration between EC and OC: several temperature programs and results of intercomparison exercises are described in the literature (Chow et al., 2001; Schmid et al., 2001; Schauer et al., 2003). These studies generally show that the sensitivity of the separation between EC and OC using a TOT analysis method depends mainly on the temperature program and on the type of samples analysed. Our sampling sites are located in urban or sub-urban areas, in mountainous region. Thus, our samples are ”urban samples” and are also influenced by wood burning, notably used in these regions for residential heating. TOT methods with temperature program similar to that of the NIOSH or the “base case” ACE Asia methods (see Table 2) are adapted for urban aerosol samples (Schmid et al., 2001; Schauer et al., 2003). It should be noted that methods reaching lower maximum temperature during the OC part of the analysis (i.e., under pure helium) could be used in or-der to reduce OC charring (see Table 2: method “alternate 3” ACE Asia). However, Schauer et al. (2003) demonstrated that EC measurements on wood smoke samples were signifi-cantly biased with this type of temperature program. Finally, we used a temperature program very close to that proposed by NIOSH or that used in the ACE Asia experiment:
temper-ature up to 870◦C for the analysis of OC in 100% He, and
up to 900◦C for the analysis of EC in 98% He + 2% O2(cf
Table 2).
Automatic split time was always used for the distinction between EC and pyrolysed OC, except for the blank sam-ples, that was manually corrected. We analyzed fractions of
Table 2. Temperature protocols used for the thermal analysis of EC and OC in different studies of carbonaceous aerosol. 1: this study, 2: Chow al., 2001, 3: Schauer et al., 2003.
Method POVA
1 NIOSH2 ACE Asia3
(base case)
ACE Asia2 (alternate 3) T (◦C) Time (s) T (◦C) Time (s) T (◦C) Time (s) T (◦C) Time (s)
100% He 250 60 250 60 340 60 120 60 500 50 500 60 500 60 250 60 650 60 650 60 615 60 450 60 870 50 850 90 870 90 550 90 Mix He / O2 600 30 650 30 575 45 575 45 700 30 750 30 625 45 625 45 850 40 850 60 700 45 700 45 900 75 940 120 775 45 775 45 850 45 850 45 900 120 900 120
Table 3. Statistics for daily atmospheric concentrations of PM10mass, OC, and EC over the campaign. All concentrations are in µg m−3.
Mean: arithmetic mean. C. O. V.: coefficient of variation (=standard deviation over mean).
PM10 OC EC OC / PM10 EC / PM10 Chamonix Mean 26.6 8.97 1.89 38.4 7.72 Standard dev. 14.7 5.22 1.43 17.9 4.46 C.O.V. 55.5 58.2 75.7 48.7 57.8 Median 23.0 7.22 1.34 35.2 6.56
Saint Jean de Maurienne
Mean 21.4 6.32 0.95 32.8 4.64
Standard dev. 11. 5 3.08 0.66 11.9 2.46
C.O.V. 53.4 48.7 69.5 36.2 53.0
Median 19.0 5.49 0.77 30.7 4.19
1.5 cm2of the filters, without any preparation. A subset of
samples (approximately 5%) was analyzed 3 times to check for the even repartition of particles on the filters. This test in-dicated a really good reproducibility of the deposition, with results within 3% of each other.
A first batch of analyses covering the first year of sam-pling took place in Gent (Belgium), while the remaining se-ries was later analyzed in Grenoble (France) on the same type of instrument. The temperature programs were iden-tical in both cases. We performed duplicate analyses on both instruments for roughly 10% of the samples, to ensure the continuity in the data series. Again, the results of these tests indicated a very good reproducibility between the two se-ries. Arithmetic average of the concentrations of the field blanks were taken into account for the calculation of atmo-spheric concentrations. Field blank concentrations
(equiva-lent to concentrations of OC=0.45±0.27 µgC/m3 and EC =
0.05±0.06 µgC/m3for a typical sample of 20 m3of air)
ac-count for 6.6 and 4.4% of average atmospheric summer con-centrations for OC and EC, respectively.
Finally, OC concentrations were not corrected to give or-ganic matter (OM) concentrations. This is not useful in our
study, as we do not try to reconstruct the mass of PM10. Also,
we did not attempted any correction for the possible arte-facts on OC sampling, for the results presented in this paper. Therefore, one should keep in mind that this can certainly af-fect our measurements and especially the comparisons with other studies (Huebert and Charlson, 2000). We will return to these points in the following discussions.
2.4 Final data set
The final data set for this long term sampling campaign in-cludes the data for EC and OC concentrations, as well as
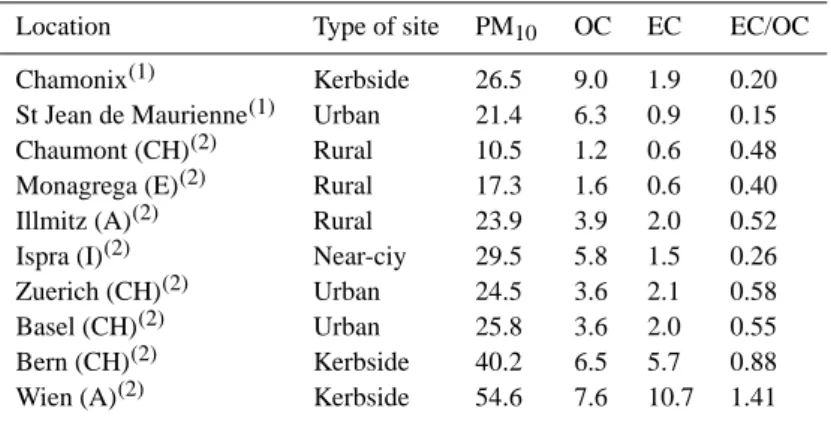
Table 4. Measurements of PM10mass, OC, EC and EC/OC covering at least one year. All concentrations are in µg m−3. (1): this study;
(2): Putaud et al. (2004).
Location Type of site PM10 OC EC EC/OC
Chamonix(1) Kerbside 26.5 9.0 1.9 0.20 St Jean de Maurienne(1) Urban 21.4 6.3 0.9 0.15 Chaumont (CH)(2) Rural 10.5 1.2 0.6 0.48 Monagrega (E)(2) Rural 17.3 1.6 0.6 0.40 Illmitz (A)(2) Rural 23.9 3.9 2.0 0.52 Ispra (I)(2) Near-ciy 29.5 5.8 1.5 0.26 Zuerich (CH)(2) Urban 24.5 3.6 2.1 0.58 Basel (CH)(2) Urban 25.8 3.6 2.0 0.55 Bern (CH)(2) Kerbside 40.2 6.5 5.7 0.88 Wien (A)(2) Kerbside 54.6 7.6 10.7 1.41
daily data for ionic species that were obtained from the same
filters (Jaffrezo et al., 2006a). Daily data for NO, NOx, O3,
SO2, and PM10 mass concentrations were also obtained, by
averaging the 15-min measurements. The data base also
includes meteorological informations obtained from M´et´eo France (temperature, precipitation, wind speed) from the sta-tions in Chamonix and Saint Jean de Maurienne, with hourly measurements averaged to get daily values. We obtained traffic countings from regional administrations and highway companies, for the sites of Tunnel des Chavants (at the lower entrance of the Chamonix valley) and Saint Michel de Mauri-enne (10 km upward of Saint Jean de MauriMauri-enne). These are daily data sets, with separate countings for individual cars and trucks.
3 Results and discussion
3.1 Seasonal variations of the concentrations and mass
fractions
Table 3 presents annual statistics for the concentrations of
PM10mass and carbonaceous species at both sites. PM10
an-nual average mass concentrations are rather similar at the two sites, and are comparable to annual average concentrations (see Table 4) measured in the background of some much larger urban areas in Europe, like London, Basel, Zurich, or Ispra (Van Dingenen et al., 2004), despite much lower popu-lation and activity in the valleys. There are more differences in the concentrations of OC and EC, with a factor of two be-tween the two sites for the latter species.
There are still few studies in the literature presenting EC and OC concentrations series covering at least one full year for European areas, and the majority of those are compiled in Putaud et al. (2004). Comparison of results (presented in Tabl 4) must take into account that measurements of EC and OC are dependant upon the sampling and analytical
ods. Therefore, only results obtained with the same meth-ods or with intercalibrated methmeth-ods can really be compared. As an example, this is not the case for the results from Bologna, collected with a 6-stage Berner impactor (Putaud et al., 2004). For other urban and sub-urban results, reported in Table 4, the methods used for EC and OC analysis (EGA and coulometry) give results very close to that obtained with the method used in our study for this type of sample (Schmid et al., 2001). Further, sampling was generally performed with high volume samplers in the studies compiled by Putaud et al. (2004). Key parameters to assess the comparability of differ-ent total filters sampling are the face velocity (McDow and Huntzicker, 1990; Turpin et al., 1994, 2000) and the dura-tion of the sampling (Turpin et al., 1994). According to these last authors, the differences in the face velocity between most methods used in Putaud et al. (2004) and that of our study (40
cm.s−1and 20 cm.s−1, respectively) should lead to an
over-estimation of OC in our study that could reach 20%, also in agreement with findings by ten Brink et al. (2004). Con-versely, all studies, including ours, used daily sampling and are comparable in this respect. Taking this into account, Ta-ble 4 shows that our OC concentrations are in the high range of those measured at urban sites in Europe (Putaud et al., 2004). In Chamonix, they are even close to concentrations measured at kerbside sites in Bern or in Vienna. In turn, EC concentrations at our two sites are closer to those measured in urban background of the large cities mentioned earlier.
Mean values of the EC-to-OC ratios are 0.19±33% and 0.14±46% in Chamonix and St Jean de Maurienne, respec-tively. Comparison of EC-to-OC ratios between different studies is even more difficult than direct comparison of EC and OC concentrations, as this ratio is more sensitive to the separation between EC and OC performed by the analyti-cal method. Table 4 indicates that the mean ratios measured in Chamonix and St Jean de Maurienne are systematically lower than ratios reported for other sites. The differences with respect to urban and kerbside sites respectively are high
#" "0, !" "0, #" A5" !" A5" #" . 2 !" . 2 #" A5" !" A5"
Fig. 2. Daily concentrations of EC and OC at both sites.
enough (a factor higher than 4 for Chamonix compare to kerbside sites, and 3 for St. Jean compare to urban sites) that it cannot be explained only with sampling and analysis un-certainties. This is an indication that it certainly reflects real differences. A more detailed examination of the information brought in by these ratios is proposed in the next section.
For both sites, the variability of OC concentrations (as described by the coefficient of variation) is close to that of
PM10 mass (cf. Table 3), while that of EC is much higher,
underlining much larger day-to-day changes in the concen-trations of the primary species EC compared to that of OC
or PM10. These variabilities are well described in Fig. 2
that presents the daily concentrations of OC and EC during the whole sampling period for Chamonix and Saint Jean de Maurienne, respectively. This figure also shows that the daily variability is lower, for both species and both sites, than the strong seasonal variations of the concentrations, with large maxima during winter. The amplitudes of these seasonal cy-cles are larger in Chamonix than in Saint Jean de Maurienne. These cycles are similar, albeit more pronounced, to that of the PM10 concentrations (Aymoz, 2005). Such seasonal cy-cles with maxima in winter can also be recalculated for many European sites (like for Ispra, Zurich, Barcelona, Bern, or Vi-enna) from the data provided in Putaud et al. (2004) (Aymoz, 2005). In our case, several hypotheses can be proposed to explain such large seasonal variations, including an impact of the meteorology, a change in the sources between summer and winter, or (for OC) the impact of physicochemical pro-cesses. Each of these aspects is discussed in the following sections.
At both sites, OC is by far the larger component of the
PM10 mass, on average, with annual mean contributions
above 30% (cf. Table 3). It dominates the sulphate contri-bution (Jaffrezo et al., 2006a), even without counting a mass conversion factor between OC and organic matter. OC
con-tribution to PM10is slightly larger in Chamonix than in Saint
Jean de Maurienne. These contributions are much larger than those reported in Putaud et al. (2004) for any European city, and in the high range of the values presented by Na et al.
(2004) for TC (= EC + OC) in PM2.5for studies worldwide.
However, they can compare with values up to 60% reported by Ruellan and Cachier (2001) for a kerbside site on a busy highway in Paris, or to values between 30 and 40% reported by Ward et al. (2004) for a town in a valley of the Rocky
Mountains (USA). The mass fraction of EC to PM10is also
larger in Chamonix than in Saint Jean de Maurienne, and the annual mean value, up to 7%, is again in the range of those from urban background of large European cities. A more thorough discussion on these comparisons would require, as mentioned above, a detailed examination of the sampling and analysis techniques used in each study, including those for
the PM10measurements.
Figure 3 indicates that the mass fractions of OC and EC
to PM10 vary seasonally, with maxima during winter time.
These seasonal cycles are stronger at the kerbside site (Cha-monix) than at the urban background site (Saint Jean de Mau-rienne). The influence of strong differences in the respective climate of the valleys (induced by a much narrower valley at higher altitude in the case of Chamonix) is not excluded to explain this difference of seasonality, on top of that of the nature of the sampling site. It is particularly striking that
dur-ing winter the PM10 fraction of EC in Chamonix can reach
very high values, up to 14% on a monthly average, indicating a much stronger impact of combustion sources on the com-position of the aerosol at that time. It is also striking that no
large increase of the PM10 mass fraction is seen for OC in
summer, when the formation of Secondary Organic Aerosol (SOA) is expected to be favoured (Kanakidou et al., 2004).
3.2 Concentrations, mass fractions, and meteorological
conditions
The strong seasonal variations depicted in Figs. 2 and 3 call for a close examination of the impact of meteorologi-cal conditions on the concentrations. Particularly, the rela-tionship with temperature is interesting, all the more in our context with large amplitudes between summer and winter conditions. Figure 4 shows the evolution of EC and OC concentrations according to the temperature, for Saint Jean and Chamonix. As expected from Fig. 2, the concentrations largely increase for lower temperatures, for both sites and
#"-@+ "0, #"-@+ . 2
!"-@+ "0, !"-@+ . 2
Fig. 3. Monthly arithmetic average mass fraction of EC and OC at both sites and standard deviation.
B (" B (" B (" B (" B (" B (" C (" #" "0, !" '> ) "0, A5-B (" B (" B (" B (" B (" B (" C (" #" . 2 !" '> ) . 2
A5-Fig. 4. Average concentrations of EC and OC according to the temperature in Chamonix and St Jean de Maurienne.
both species. The increases in EC concentrations are much larger in Chamonix (a factor of 4.2) than in Saint Jean (a
factor of 3.0) for changes in the temperature between T◦C
<-5◦C and 10 < T◦C< 15, while those in OC are closer
(factors of 3.1 and 2.7 for the two sites, respectively) for the same temperature ranges. One hypothesis to explain this dif-ference between the two sites could be in difdif-ferences in the sources of particulate matter they experience as the tempera-ture changes. For the warmer temperatempera-ture ranges, small in-creases in average OC concentrations are seen at both sites, which are not associated with changes in EC concentrations. They could be linked either with the formation of SOA, in agreement with a smaller increase at the site close to sources (Chamonix) than further away from direct emissions (Saint Jean), or with an increase of the impact of primary sources with low EC to OC ratios.
Figure 5 presents the evolution of the mass fraction of EC
and OC to the PM10according to the temperature ranges at
the two sites. Despite the much larger concentrations for the lower temperatures mentioned above, the maxima in the mass fraction of both EC and OC are not measured for the coldest conditions. Further, these maxima are not found for the same temperature range for the two sites, but between
–5◦C and 0◦C in Chamonix and between 0◦C and 5◦C in
Saint Jean. A first hypothesis to explain these results would be that some chemical species other than EC or OC are mak-ing up an increasmak-ing fraction of the mass as the temperature
decreases. However, the PM10mass fractions of sulphate and
nitrate (the only other major components of the aerosol mass) do not increase at low temperature (Jaffrezo et al., 2006a) and therefore cannot explain the missing mass. Another hypothe-sis is that the OC-to-OM conversion factor is higher at lower temperatures, with the mass fraction of OM increasing pro-portionally. Very few data are available in the literature on the evolution of this conversion factor, and a value of 1.4 is generally considered for urban sites (Turpin and Lim, 2001). This assumption is discussed later, in relation with potential changes in the sources of EC and OC in the valleys.
Figure 6 shows the evolution of EC-to-OC ratios according to the temperature. Values reported for St Jean are system-atically lower than that for Chamonix for each temperature interval. This could be in agreement with an ”older” aerosol at this site (i.e., in agreement with our assumptions on the re-spective proximity of the sources for the two sites), or more generally with different chemical emission profiles between the two valleys. Also, the evolution of this ratio with respect to the temperature is indicative of changes in the relative in-fluences of different sources of EC and OC to the atmosphere of our sites. This ratio is maximum for intermediate temper-atures. It is noted that this maximum does not appear for the same range of temperature at the two sites. This dif-ference seems difficult to explain, even if this temperature difference is of the same order of magnitude as the average deviation of the mean annual temperature between the two
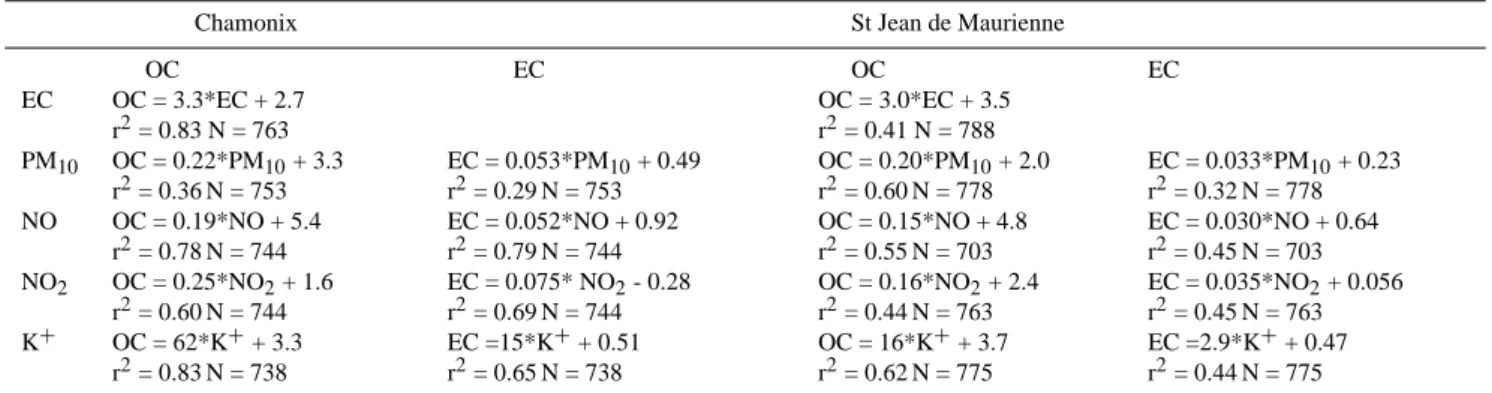
Table 5. Linear correlation parameters between the concentrations of OC, EC and PM10 mass, NO, NO2and K+. All concentrations in
µg.m−3.
Chamonix St Jean de Maurienne
OC EC OC EC EC OC = 3.3*EC + 2.7 r2= 0.83 N = 763 OC = 3.0*EC + 3.5 r2= 0.41 N = 788 PM10 OC = 0.22*PM10+ 3.3 r2= 0.36 N = 753 EC = 0.053*PM10+ 0.49 r2= 0.29 N = 753 OC = 0.20*PM10+ 2.0 r2= 0.60 N = 778 EC = 0.033*PM10+ 0.23 r2= 0.32 N = 778 NO OC = 0.19*NO + 5.4 r2= 0.78 N = 744 EC = 0.052*NO + 0.92 r2= 0.79 N = 744 OC = 0.15*NO + 4.8 r2= 0.55 N = 703 EC = 0.030*NO + 0.64 r2= 0.45 N = 703 NO2 OC = 0.25*NO2+ 1.6 r2= 0.60 N = 744 EC = 0.075* NO2- 0.28 r2= 0.69 N = 744 OC = 0.16*NO2+ 2.4 r2= 0.44 N = 763 EC = 0.035*NO2+ 0.056 r2= 0.45 N = 763 K+ OC = 62*K++ 3.3 r2= 0.83 N = 738 EC =15*K++ 0.51 r2= 0.65 N = 738 OC = 16*K++ 3.7 r2= 0.62 N = 775 EC =2.9*K++ 0.47 r2= 0.44 N = 775 B (" B (" B (" B (" B (" B (" B (" C (" !"-@+ "0, !"-@+ . 2 B (" B (" B (" B (" B (" B (" B (" C (" #"-@+ "0, #"-@+ . 2
Fig. 5. Average mass fractions of EC and OC at both sites according to the temperature.
sites (approximately 5◦C warmer in St. Jean de Maurienne)
(Jaffrezo et al., 2005).
At both sites, the EC-to-OC ratio tends to decrease with higher temperatures. An assumption is that the increase in slope breezes with an increase in the temperatures promotes vertical mixing and increases the influence of more remote sources, bringing less primary aerosols (more typical of ru-ral sites, i.e., lower EC-to-OC ratio). It is also possible that some agricultural practises (burning of meadows) and burn-ing of organic waste by inhabitants (with low EC-to-OC ra-tios) in summer are at the origin of this evolution. Two as-sumptions can be proposed to explain the tendency to the de-crease of the EC-to-OC ratio with the lowest temperatures. A first assumption is the possible impact of the condensation of semi-volatile organic species, a process favoured at low temperatures. This is well known to be one of the governing processes for the modulation of particulate concentrations of chemical species like PAHs or POPs (Leach et al., 1999) and of SOA (Sheeman and Bowman, 2001). It is however dif-ficult to evaluate with the data we have in hand the impact of such a process on the EC-to-OC ratio in our case. A sec-ond hypothesis (non exclusive of the first one) could be a change in the sources of carbonaceous matter between sea-sons, with an increasing importance of the sources having
a low EC-to-OC ratio at low temperature. This tendency is compatible with a probable increasing influence of emissions from wood combustions, with emissions characterized by a low EC-to-OC ratio, typically between 20 and 40 (Schauer et al., 2001; Oros and Simoneit, 2001a, b). This would also have an impact on the evolution of the OC-to-OM conversion factor (mentioned above), as it is generally believed (Turpin and Lim, 2001) that this ratio is higher for biomass burning emissions. The importance of this source is further discussed below (Sect. 3.5), using soluble potassium as an additional tracer.
The temperature is the most prominent parameter related with the changes in concentrations of EC and OC in the val-ley. However, evolution of concentrations according to the wind speed measured at each site shows, without too much surprise for sites located close to sources, that concentrations tend to be higher during conditions of low dispersion, that this feature is more pronounced at the kerbside site than at the urban background site and, further, is way more pronounced for EC than for OC (Aymoz, 2005). Again, this is associated with an increase of the mass fractions of both EC and OC
to the PM10for low wind speed, well pronounced for EC in
Chamonix, indicative of the predominance of the emissions from local combustion sources in the formation of the aerosol
B (" B (" B (" B (" B (" B (" B (" C (" !"-#" "0, !"-#" . 2
Fig. 6. Average EC-to-OC ratio at both sites according to the tem-perature.
load for these two sites.
Overall, all of these observations do not allow delineat-ing the respective impacts, on the concentrations of EC and OC, of the factors mentioned in the previous section. Par-ticularly, it is challenging to evaluate the respective roles for the seasonal cycles of the concentrations of the changes in emission sources and of the impact of the local meteorology characterized by an increase of the frequency of the inversion layers in winter. Nevertheless, the quantification of the im-pact of meteorology on the observed concentrations is out of the scope of this paper, and we attempted rather to determine the sources of carbonaceous matter in the aerosol. The goal of the next sections is to examine successively the role of known combustion sources on the concentrations of organics and to test the method of the “primary ratio” (Turpin et al., 1991) to evaluate the SOA formation and contribution to OC.
3.3 The influence of combustion sources
Table 5 presents the correlations between the concentrations
of OC, EC, and PM10mass, NO, and NO2for the two sites.
These tables indicate that both EC and OC are closely
cor-related with NO and NO2. To the best of our knowledge, no
such data sets are available in the literature, for comparison. These close links between gaseous and particulate concentra-tions are most probably due in part to a common impact of local meteorological conditions on all atmospheric species, as described above. However, the correlations with NO and
NO2 being much higher for EC and OC than for PM10 are
a strong indication that local combustion sources represent a main factor in the modulation of EC and OC concentrations. Two of the main combustion sources in the valleys are the traffic and the biomass burning.
3.4 The influence of heavy duty traffic
A direct comparison between any series of concentrations and traffic data do not lead to significant correlations (Ay-moz, 2005), despite the favourable conditions of our study
* @/ # # @+ #" !" .# 1? # "0 $ ,
. $ 2 $ 90 $5 D $
. $ $ D %
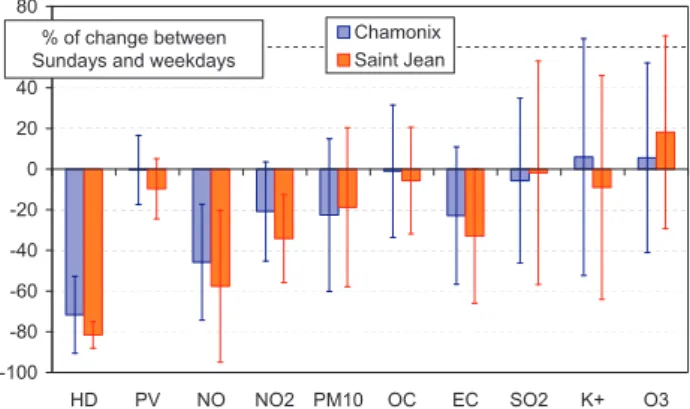
Fig. 7. Aritmetic mean and standard deviation of the percentage of change between values on Sunday and the weekday of the same week, for HD (number of heavy duty trucks), PV (number of per-sonal vehicules), and concentrations of OC, EC, PM10mass, NO, NO2, SO2, K+, and O3for the whole study.
considering the limited systems of the valleys. This results from the large influence of other parameters, as mentioned above. However, we can take advantage of the strong weekly cycle of the heavy duty traffic (that is forbidden on weekends in France) to try to evaluate its impact on atmospheric con-centrations. Figure 7 shows the average differences between the averages on Sunday and on workdays of the same week for several parameters during the whole study. In Chamonix and St Jean de Maurienne, the decreases of the number of heavy duty trucks (HD) amount to 72% and 82%, respec-tively, due to the regulation of traffic for this type of vehi-cles. This represents a large change in the emissions, either directly from the combustion exhaust, or indirectly with the resuspension of soil dust. Conversely, the traffic of personal cars is the same between the two types of periods. Further, it is very likely that emissions from other main sources are also stable between weekdays and weekends, including that from residential heating with wood burning and that from
indus-tries, as indicated by small changes, on average, in K+ and
SO2concentrations, respectively (cf. Fig. 7).
Therefore, the important decreases of NO and NO2
con-centrations at both sites (58 and 34% for Saint Jean, respec-tively) on Sundays shown on Fig. 7 are probably mainly linked with the changes in the HD source. The decreases are larger in Saint Jean (for a site closer to the highway, with a much larger traffic in the valley) than in Chamonix, and
larger for NO than NO2(again, in agreement with the
loca-tion of the sites only a couple of km away from the highways supporting this heavy duty traffic). The decreases are lower,
but still significant for PM10 mass, with values about 20%
for both sites, associated with large standard deviation. The changes are also well marked for EC (averages decreases of 23 and 33% for Chamonix and Saint Jean, respectively), but are not significant for OC (changes below 5% for both sites). These results are similar to those presented by R¨o¨osli et al.
1? . 2 1? "0, $5
Fig. 8. Daily concentrations of K+ at both sites.
(2001) for a study in Basel (Switzerland), with changes in concentrations between Sundays and weekdays being larger
for EC than for PM10mass and OC.
According to the emission rates for EC and OC for heavy duty diesel trucks proposed by Schauer et al. (1999) (these species representing about 31 and 20% of the fine particle mass emitted, respectively), the decreases observed on aver-age for EC on Sundays should lead to a change of about 3% of the average OC mass for both sites, which is compatible with our observations. It shows that Heavy Duty traffic is a major source of EC in the valleys, but is not so important for OC. Finally, it should also be pointed out that the decreases
in the PM10mass on Sundays (changes of 6.1 and 4.0 µg/m3
on a yearly average for Chamonix and Saint Jean, respec-tively) are far from being totally explained by the decreases of the two main components (EC and OC). These decreases of the aerosol load on weekends are also not associated to large changes in sulphate or nitrate concentrations (Jaffrezo et al., 2006a). The influence of the resuspension of soil dust should therefore be suspected (R¨o¨osli et al., 2001) but ele-mental compositions were not investigated in our study. This difference between EC and OC weekly cycles, associated with the “primary” character of EC and OC previously ob-served, and with the weak EC-to-OC ratio confirm that there is not a unique source of carbonaceous matter in the valleys. One important point is that the impact of HD source on OC concentrations is clearly limited. We can investigate the po-tential impact of another source of OC represented by the biomass burning.
3.5 Influence of wood combustion
Wood combustion is a known source of particles in the val-ley, as demonstrated with measurements of molecular tracers performed during short term campaigns conducted during the POVA program (Marchand et al., 2004; 2006). We can try to get more information on the influence of this source during all seasons, using soluble potassium as an additional tracer.
Potassium in aerosol samples has several natural sources in-cluding the marine and crustal ones. It was also detected in biomass burning plumes (Andreae et al., 1988; Echalar et al., 1995) then used as tracer of this type of source in natural sites (Ruellan et al., 1999; Allen and Miguel, 1995) or in remote ice core records (Savarino et Legrand, 1998). However, in a study of emission profiles from different sources (vehicular, biomass combustions, crustal matter and coal combustion)
Watson et al. (2001) showed that soluble potassium (K+)is
also an unambiguous tracer of biomass burning emissions in
areas influenced by human activity. K+ was subsequently
used to investigate the role of biomass burning in such areas, like the mega-cities Beijing in China (Duan et al., 2004) or Dhaka in Bangladesh (Salam et al., 2003).
Jaffrezo et al., 2005b investigate the size distribution of
K+ on the sites of our study. Authors show that the size
distributions of soluble potassium in winter and summer are monomodal, with mass median diameters centred in the in-terval 0.40 to 0.65 µm. This sub-micronic mode is a very strong indication that soluble potassium originate from com-bustion and not from sea-salt, soils or re-suspension of dust. In our case, soluble potassium was measured with ion chromatography in 738 and 775 of the samples from the Cha-monix and St Jean de Maurienne series, respectively
(Jaf-frezo et al., 2006a). Mean annual concentrations of K+
amount to 166 and 90 ng/m3 for Chamonix and St Jean de
Maurienne, respectively. However, large seasonal cycles
with well defined maxima in winter are experienced at both sites (Fig. 8). These cycles are somewhat weaker than that of
EC, but larger than that of OC and PM10mass.
Table 3 presents correlation between K+, OC and EC.
The correlation between OC and K+ is high and stronger
in Chamonix (r2 = 0.83) than in St Jean de Maurienne (r2
= 0.62). It indicates that biomass combustion is a very im-portant source of OC, particularly in Chamonix. Correlation
between EC and K+ is also significant, but weaker at the
two sites (r2= 0.65 and 0.44 for Chamonix and St Jean de
Maurienne, respectively). This indicates that EC concentra-tions are less influenced by biomass burning emission than OC concentrations. Emissions from biomass combustion are generally characterised by low EC-to-OC ratios, compared to those from diesel and gasoline vehicle emissions. Ratios re-ported for diesel engines (between 1.0 and 1.3 (Schauer et al., 2002)) and recent gasoline engines (between 0.25 and 0.45 (Schauer et al., 1999; Rogge et al., 1993)) are highs com-pared to those reported for biomass or coal burning emis-sions (between 0.025 and 0.05 (Schauer et al., 2001; Oros and Simoneit, 2000, 2001a, 2001b)). We can thus conclude that EC concentrations are linked both with HD and biomass burning emissions, while OC concentrations are much more influenced by biomass burning emissions with an impact of HD emission being not obvious.
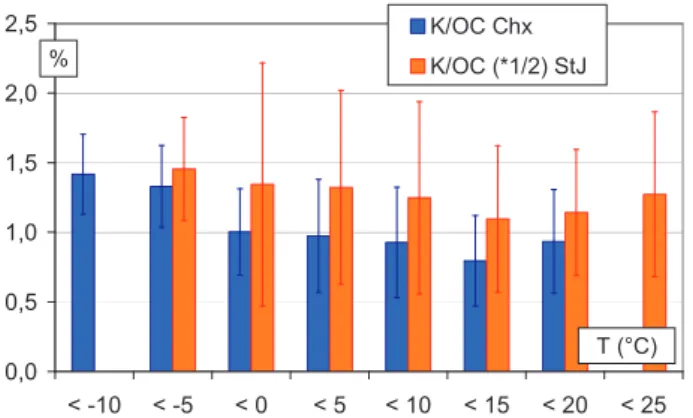
Mean K+-to-EC and K+-to-OC ratios at both sites are
re-spectively 5.2 and 1.0% in Chamonix, and 19.0 and 2.4% in St Jean de Maurienne. The differences observed between
E E E E E E B B B B B B B B 1-#" "0, 1-#" '> - ) . 2 & '(")
Fig. 9. Average K+-to-OC ratio at both sites according to the tem-perature.
Chamonix and St Jean de Maurienne can tentatively be ex-plained by differences in the type of biomass burned. In-deed, there are no specific values of these ratios ascribed to biomass burning emissions, because they vary notably with the type of wood burnt and the amount of branches and fo-liage (Oros and Simoneit, 2000, 2001a, b). Nevertheless, the ratios we observed in the valleys are close to those reported in Chow et al. (1994) for different urban sites in Los Angeles
(CA, USA), with mean K+-to-EC and K+-to-OC comprised
in the range 4–20% et 1–5%, respectively.
Figure 9 shows the evolution of the K+-to-OC ratio
ac-cording to the temperature at both sites. The ratio shows an evolution, relatively similar at both sites, with maximum val-ues for the lowest temperature (rather marked in Chamonix), and for highest temperature (rather marked in St Jean de Maurienne). For the lowest temperature ranges, it confirms that the impact of biomass burning on OC concentrations is maximum because of residential heating in winter. This is in agreement with lower EC-to-OC ratios at this temperature, as seen in the Sect. 3.2 and Fig. 6. It can also explain the
evolu-tion of the OC-to-PM10ratio (cf Fig. 5). According to Turpin
and Lim (2001), wood burning emissions show OC-to-OM conversion factors that can exceed 2.4. Conversion factors that are considered characteristic of other primary sources are generally lower, with a value of 1.4 or less generally admit-ted for vehicle emissions, for example. Thus, the decrease of
OC-to-PM10ratio observed at low temperature does not
nec-essarily mean a decrease of the actual contribution of OM
to PM10 mass, and can hide stability, or even an increase
of this contribution. For the ranges of the highest temper-atures, a hypothesis to explain the weak increase observed
for the K+-to-OC ratio is possibly linked with local
agricul-tural practices and more generally burning of garden waste in summer. As for low temperatures, it could also explain, at least partially, the observed decreases of EC-to-OC and
OC-to-PM10 ratios (cf. Figs. 5 and 6). However, and compared
to the lowest temperature, the increase of K+-to-OC is weak.
Other processes are possibly implicated in the evolution of these ratios, like the formation of SOA. We examine in the next section the possibility to evaluate this contribution in our study.
3.6 Calculation of SOA formation
Evidence of the influence of SOA transported or formed in the valley in summer conditions are presented in Jaffrezo et al. (2005) on the basis of the evolution of dicarboxylic acids concentrations. However, the total mass of these last species represents only a few percent of OC, even in summer, and it does not allow to fully appreciate the real influence of the secondary source on OC concentrations. Actually, no ex-perimental method exists to measure directly this fraction, but calculation methods of this fraction from data sets of EC and OC are proposed in the literature. The principle of these calculations is that EC, emitted by combustion sources, can be used as a tracer of primary fraction of OC (Turpin et al., 1991). It means that we make the assumption that, for a given site, there is an EC-to-OC ratio, noted (EC/OC)pri, represen-tative of the primary emissions of these two species. Then, many authors, of which Turpin and Huntzicker (1991) use a very simple expression of primary OC, noted OCpri, and of secondary OC, noted OCsec, starting from the concentrations of EC and total OC, noted OCtot:
(OCpri) = (EC) / (EC/OC)pri (OCsec) = (OC)tot - (OCpri).
Several methods are proposed in the literature to determine (EC/OC)pri. A first one consists in measuring this ratio for each source then, starting from an inventory of the emissions and by taking into account the variations in time of the influ-ence of each source, to calculate the resulting primary ratio for a given receptor site. For example, Gray et al. (1986) calculated a primary ratio of 0.42 in a study concerning the Los Angeles area. However, this approach requires a de-tailed study of emission sources and a reliable inventory of the emissions of ECpri and OCpri. These conditions are not met in our study. A second method consists in measuring in-situ the primary ratio in the atmosphere for days when the secondary production of OC is expected to be minimal. In a study in the Los Angeles area, Turpin and Huntzicker (1991) estimated this ratio by using only measurements of EC and OC when the weather conditions were unstable (no sun and no drizzle) or with minimal photochemical activity (deter-mined by low ozone levels). Alternatively, a last method used in Castro et al. (1999) consists in determining systematically the minimum ratio for each study and each site (or an aver-age of the minimum ratios) and using it as the primary ratio. For the two last methods, and in agreement with Castro et al. (1999), the result is then subjected to several assumptions: i) (EC/OC)pri does not evolve significantly over the period of the study,
ii) the effective contribution of SOA is negligible for the samples used in the determination of the primary ratio,
#". 9 "*F #". 9 .&2
&("
A5"-Fig. 10. Concentration of secondary organic carbon calculated at each site according to the temperature. Details of the calculation are given in the text.
iii) the contribution to the primary OC of sources other than combustion sources is low or constant,
iv) the contribution of semi-volatile OC to the primary OC is low compared to the contribution of the non-volatile or-ganic species.
These assumptions are quite constraining and probably not respected in most of the cases. It is obvious in our case that the first assumption is definitely wrong, as we saw in the previous sections that variations of the EC-to-OC ratios are related with changes in the relative influence of different combustion sources to the total amount of OC. However, we performed the calculation of OCsec according to the third method in order to evaluate the level of uncertainties that such a method can bear.
Therefore, OCsec are calculated with a (EC/OC)pri ratio determined for each site for the whole sampling period as the arithmetic mean of the 5% of the highest values of this ratio. This ratio is 0.32 and 0.36 in Chamonix and St. Jean de Maurienne, respectively. This is in the range generally presented in the literature (Na et al., 2004, and references therein). However, it is striking that, if these lower ratios are found essentially in winter, they are not obtained in the conditions that would be seen as the most favourable for the influence of local sources. For example, the average daily
values for these episodes are 2.7±2.8◦C, 35.9±21.4 µg.m−3
and 18.7 ±8.0 µg.m−3 for temperature, NO, and SO2
con-centrations for Chamonix, as opposed to mean values of –
1.6±5.7◦C, 50.5± 41.1µg.m−3 and 26.6±12.0 µg.m−3for
the same parameters from 1/12/01 to 20/03/02, the winter period concerning most of the episodes with high EC-to-OC ratios. This is a strong indication that the primary ratio of lo-cal emissions in winter is indeed higher than the (EC/OC)pri determined by this method, due certainly to the high propor-tion of biomass burning at that time.
Figure 10 shows the evolution of OCsec according to the temperature, using these primary ratios. At the two sites, OCsec concentrations present a very large maximum for the
colder temperatures, while only a weak increase of the con-centrations is observed for the warmer temperatures. The tendency observed for the lowest temperature is clearly in-fluenced, at the two sites, by the increase of the influence of biomass burning emission, and seems totally inconsistent with a real production of secondary organic carbon. It ap-pears clearly that this method is inappropriate in this case. We can then wonder whether the increase we observe for the warmer temperatures, apparently coherent with the forma-tion of SOA, is an acceptable estimaforma-tion of its concentraforma-tion.
Indeed, the observation of the evolution of K+-to-OC in the
previous section indicated that biomass combustion emission can possibly influence (OC/EC)pri for the range of tempera-ture. Although less drastic than for the lower temperature, it is thus possible that a change of primary sources explains at least a fraction of OCsec calculated for the warmer tempera-tures.
Because of the large range of conditions encompassed in our study, we can easily show in this case that if the assump-tion of a constant (EC/OC)pri is not exactly respected, the result for the calculation of SOA formation is not reliable. More generally, if this assumption is not closely examined, the validity of the results given by the calculation of the pri-mary and secondary fractions of OC with this type of method is really questionable. The amplitude of the error induced by the variation of the primary EC-to-OC ratio could, in many studies, lead to OCsec concentrations that would be more or less coherent with an expected result and interpreted as well. Thus, this type of method can only be applied in stud-ies where primary sources of EC and OC are extremely well known, together with their contributions to total EC and OC measured on the receptor site. In all other cases, probably a high majority, this potential error, added to all other un-certainties in the determination of OC concentrations, as de-scribed in Huebert and Charlson (2000), makes the result of the calculation of OCsec dubious.
4 Conclusions
Daily PM10samples were collected at two urban sites in
val-leys of the French Alps (Chamonix and St Jean de Mauri-enne) during a period of two and a half years. The car-bonaceous species EC (elemental carbon) and OC (organic carbon) were analysed to investigate the possible sources of EC and OC, and their seasonal evolutions. Mean EC and
OC concentrations were respectively 1.9 and 9.0 µg/m3 in
Chamonix and 1.0 and 6.4 µg/m3in St Jean de Maurienne.
Mean OC concentrations are in the very high range of con-centrations measured for other European sites, and represent
33 and 38% of PM10 mass for Chamonix and St Jean de
Maurienne, respectively, without correction to calculate OM (organic matter) concentrations. Concentrations of EC and OC for both sites show a clear seasonal cycle, with
importance of local primary combustion sources. The strong increase of EC and OC concentrations as the temperature de-creases is probably largely linked with the increase of the fre-quency and strength of atmospheric inversion layers during winter time in these deep valleys. Nevertheless, the evolution of the EC-to-OC ratio with the temperature demonstrates that the relative contribution of different sources of EC and OC is also changing according to the temperature ranges.
The impacts of heavy duty traffic and residential heating are highlighted by the relations between EC and OC con-centrations and the number of heavy duty vehicles (HDV)
circulating in the valleys and K+ concentrations used as a
tracer for biomass combustions, respectively. On the one hand, changes in EC concentrations are linked with that of HDV number, which is not the case for OC. On the other
hand, the correlation between concentrations of OC and K+
is very large and stronger than that between concentrations
of EC and K+. Although other potential sources, like
pri-mary emissions by cars, or possible impact of semi-volatile organic species condensation with low temperature could not be estimated, it appears clearly that biomass burning emis-sions have a significant impact on OC concentrations (and
consequently on PM10 mass concentrations), especially for
low temperatures. The impact of this source on PM10mass
is probably stronger than that of the HDV source. This can explain both the evolutions of the EC-to-OC ratio and of
OC- and EC- to-PM10 ratios observed for low temperatures.
Further quantification of the contributions of these sources would require measurements of specific tracers (Marchand et al., 2006).
Finally, our data show that the formation of SOA could
have an impact on PM10 mass during summer time. The
EC-to-OC primary ratio method, based on several hypothe-ses (Castro et al., 1999), was applied to the overall data set to evaluate this SOA fraction. It appears clearly that the SOA mass calculated in our study is largely biased by the variations of the primary EC-to-OC ratio. More generally, it demonstrates that the calculation of SOA mass with this method is highly uncertain, if the hypothesis of a constant primary EC-to-OC ratio is not very closely examined.
Acknowledgements. The program POVA is supported by R´egion Rhˆone-Alpes, ADEME (Agence pour le D´eveloppement et la Maˆıtrise de l’Energie), METL (Minist`ere de l’Equipement, des Transports et du Logement), MEDD (Minist`ere de l’Environnement et du D´eveloppement Durable), and Programme Primequal 2. The work at Ghent University is funded by the Belgian Federal Science Policy Office. We would like to thank M´et´eo France for providing the meteorological data, and DDE 73 and 74 and SFTRF for providing the traffic data.
Edited by: A. Petzold
References
Allen, A. G. and Miguel, A. H.: Biomass burning in the Amazon: Characterization of the ionic component of aerosols generated from flaming and smouldering rainforest and savannah, Environ. Sci. Technol., 29, 486-493, 1995.
Ambrosetti, P., Anfossi, D., Cieslik, S., Graziani, G., Lamprecht, R., Marzorati, A., Nodop, K., Sandroni, S., Stingele, A., and Zimmermann, H.: Mesoscale transport of atmospheric trace con-stituents across the central Alps: TRANSALP tracer experi-ments, Atmos. Environ., 32, 1257-1272, 1998.
Andreae, M. O., et al.: Biomass-burning emissions and associated haze layers over Amazonia, J. Geophys. Res., 93, 1509–1527, 1988.
Aymoz, G.: Etude de la fraction carbon´ee de l’a´erosol atmo-sph´erique `a Chamonix et St Jean de Maurienne : ´evolutions saisonni`eres, sources et caract´eristiques chimiques. Th`ese de doctorat de l’universit´e Joseph Fourier, Grenoble I, 290 pp, 2005. Available at http://tel.ccsd.cnrs.fr/tel-00008918
Birch, M. E. and Cary, R. A.: Elemental carbon-based method for monitoring occupational exposures to particulate diesel exhaust, Aerosol Sci. Technol., 25, 221–241, 1996.
Brulfert, G., Chemel, C., Chaxel, E., and Chollet, J. P.: Modelling photochemistry in Alpine valleys, Atmos. Chem. Phys., 5, 2341– 2355, 2005,
http://www.atmos-chem-phys.net/5/2341/2005/.
Castro, L. M., Pio, C. A., Harrison, R. M., and Smith, D. J. T.: Carbonaceous aerosol in urban and rural European atmospheres: estimation of secondary organic carbon concentrations, Atmos. Environ., 33, 2771–2781, 1999.
Chan, Y. C., Simpson, R. W., Mctainsh, G. H., Vowles, P. D., Co-hen, D. D., and Bailey, G. M.: Source apportionment of visibility degradation problems in Brisbane (Australia) using the multiple linear regression techniques, Atmos. Environ., 33, 3237–3250, 1999.
Chow, J. C., Watson, J. G., Crow, D., Lowenthal, D. H., and Mer-rifield, T.: Comparison of IMPROVE and NIOSH carbon mea-surements, Aerosol Sci. Technol., 34, 23–34, 2001.
Couach, O., Balin, I., Jim´enez, R., Ristori, R., Kirchner, F., Perego, S., Simeonov, V., Calpini, B., and Van den Bergh, H.: Investiga-tion of the ozone and planetary boundary layer dynamics on the topographically-complex area of Grenoble by measurements and modelling, Atmos. Chem. Phys., 3, 549–562, 2003,
http://www.atmos-chem-phys.net/3/549/2003/.
Dosio, A., Emeis, S., Graziani, G., Junkermann, W., and Levy, A.: Assessing the meteorological conditions of a deep Italian Alpine valley system by means of a measuring campaign and simula-tions with two models during a summer smog episode, Atmos. Environ., 35, 5441–5454, 2001.
Duan, F., Liu, X., Yu, T., and Cachier, H.: Identification and esti-mate of biomass burning contribution to the urban aerosol or-ganic carbon concentrations in Beijing, Atmos. Environ., 38, 1275–1282, 2004.
Echalar, F., Gaudichet, A., Cachier, H., Artaxo, P.: Aerosol emis-sions by tropical forest and savanna biomass burning: character-istic trace elements and fluxes, Geophys. Res. Lett., 22, 3039– 3042, 1995.
Espace Mont Blanc: Technical report of the study Air Espace Mont Blanc, 147 pp. Available at http://www.espace-mont-blanc.com, 2003.
Furger, M., Dommen, J., Graber, W. K., Poggio, L., Pr´evˆot, A. S. H., Emeis, S., Trickl, T., Gomisscek, B., Neininger, B., and Wotawa, G.: The VOTALP Mesolcina Valley Campaign 1996 – concept, background and some highlights, Atmos. Environ., 34, 1395– 1412, 2000.
Gray, H. A., Cass, G. R., Huntzicker, J. J., Heyerdahl, E. K., and Rau, J. A.: Characteristics of atmospheric organic and elemen-tal carbon particles concentrations in Los Angeles, Environ. Sci. Technol., 20, 580–589, 1986.
Huebert, B. J. and Charlson, R. J.: Uncertainties in data on organic aerosols, Tellus 52B, 1249–1255, 2000.
Jaffrezo, J. L., Aymoz, G., Delaval, C., and Cozic, J.: Seasonal evolution of the soluble fraction of particulate organic carbon in Alpine Valleys, Atmos. Chem. Phys., 5, 2809–2821, 2005a. Jaffrezo J. L., Aymoz, G., and Cozic, J.: Size distribution of EC and
OC in Alpine valleys during summer and winter. Atmos. Chem. Phys., 5, 2915–2925, 2005b.
Jaffrezo, J. L., Aymoz, G., and Cozic, J.: Seasonal variation of PM10 main constituents in two valleys of the French Alps. II-Ionic constituents. In preparation for Atmos. Chem. Phys. Disc., 2006.
Kanakidou, M., Seinfeld J. H., Pandis S. N., et al.: Organic aerosol and global climate modelling: a review, Atmos. Chem. Phys., 5, 1053–1123, 2004,
http://www.atmos-chem-phys.net/5/1053/2004/.
Leach, K. B., Kamens, R. M., Strommen, M. R., and Jang, M.: Par-titioning of semivolatile organic compounds in the presence of a secondary organic aerosol in a controlled atmosphere, J. Atmos. Chem., 33, 241–264, 1999.
Lehning, M., Richner, H., and Kok, G. L.: Pollutant transport over complex terrain: flux and budget calculations for the POL-LUMET field campaign, Atmos. Environ., 30, 3027–3044, 1996. L¨offler-Mang, M., Zimmermann, H., and Fiedler, F.: Analysis of ground based operational network data acquired during the September 1992 TRACT campaign, Atmos. Environ., 32, 1229– 1240, 1998.
Marchand, N., Besombes, J. L., Chevron, N., Masclet, P., Aymoz, G., and Jaffrezo, J. L.: Polycyclic aromatic hydrocarbons (PAHs) in the atmospheres of two French alpine valleys: sources and temporal patterns, Atmos. Chem. Phys., 4, 1167–1181, 2004, http://www.atmos-chem-phys.net/4/1167/2004/.
Marchand, N., Aymoz, G., Jaffrezo, J. L., Masclet, P., and Be-sombes, J. L.: Biomass burning indicators in the aerosol of Alpine valleys, in preparation for Atmos. Chem. Phys., 2006 McDow, S. R. and Huntzicker, J. J.: Vapor adsorption artefact in
the sampling of organic aerosol: face velocity effects, Atmos. Environ., 24A, 2563–2571, 1990.
Na, K., Sawant, A. A., Song, C., Cocker, III D. R.: Primary and secondary carbonaceous species in the atmosphere of Western Riverside County, California, Atmos. Environ., 38, 1345–1355, 2004.
Oros, D. R. and Simoneit, B. R. T.: Identification and emission rates of molecular tracers in coal smoke particulate matter, Fuel, 79, 515–536, 2000.
Oros, D. R. and Simoneit, B. R. T.: Identification and emission fac-tors of molecular tracers in organic aerosols from biomass burn-ing Part 1. Temperate climate conifers, Applied Geochemistry, 16, 1513–1544, 2001a.
Oros, D. R. and Simoneit, B. R. T.: Identification and emission
fac-tors of molecular tracers in organic aerosols from biomass burn-ing Part 2. Deciduous trees, Applied Geochemistry, 16, 1545– 1565, 2001b.
Putaud, J. P., Raes, F., Van Dingenen, R., et al.: A European aerosol phenomenology - 2: chemical characteristics of particulate mat-ter at kerbside, urban, rural and background sites in Europe, At-mos. Environ., 38, 2579–2595, 2004.
Rogge, W. F., Hildemann, L. M., Mazurek, M. A., and Cass. G. R.: Sources of fine organic aerosol. 2. Noncatalyst and catalyst-equiped automobiles and heavy duty diesel trucks, Environ. Sci. Technol., 27, 636–651, 1993.
R¨o¨osli, M., Theis, G., K¨unzli, N., Staehelin, J., Mathys, P., Oglesby, L., Camenzind, M., and Braun-Fahrl¨ander, Ch.: Temporal and spatial variation of the chemical composition of PM10 at urban and rural sites in the Basel area, Switzerland, Atmos. Environ., 35, 3701–3713, 2001.
Ruellan,, S., Cachier, H., Gaudichet, A., Masclet, P., and Lacaux, J.: Airborne aerosols over central Africa during the Experiment for Regional Sources and Sinks of Oxidants (EXPRESSO), J. Geophys. Res., 104, 30 673–30 690, 1999.
Ruellan, S. and Cachier, H.: Characterisation of fresh particulate vehicular exhaust near a Paris high flow road, Atmos. Environ., 35, 453–468, 2001.
Salam, A., Bauer, H., Kassin, K., Ullah, S. M., and Puxbaum, H.: Aerosol chemical characteristics of a mega-city in South-east Asia (Dhaka-Bangladesh), Atmos. Environ., 37, 2517–2528, 2003.
Savarino, J. and Legrand, M.: High northern latitude forest fires and vegetation emissions over the last millennium inferred from the chemistry of a central Greenland ice core, J. Geophys. Res., 103, 8267–8280, doi:10.1029/97JD03748, 1998.
Schauer, J. J., Kleeman, M. J., Cass, G. R., and Simoneit, B. R. T.: Measurement of emissions from air pollution sources. 2. C1 through C30 organic compounds from medium diesel trucks, En-viron. Sci. Technol., 33, 1578–1587, 1999.
Schauer, J. J., Kleeman, M. J., Cass, G. R., and Simoneit, B. R. T.: Measurement of emissions from air pollution sources. 3. C1-C29 organic compounds from fireplace combustion of wood, Environ. Sci. Technol., 35, 1716–1728, 2001.
Schauer, J. J., Kleeman, M. J., Cass, G. R., and Simoneit, B. R. T.: Measurement of emissions from air pollution sources. 5. C1-C32 organic compounds from Gasoline-Powered Motor Vehicles, En-viron. Sci. Technol., 36, 1169–1180, 2002.
Schauer, J. J., Mader B. T., DeMinter J. T. et al.: ACE-Asia inter-comparison of a thermo-optical method for the determination of particle-phase organic and elemental carbon, Environ. Sci. Tech-nol., 37, 993–1001, 2003.
Schmid, H., Laskus, L., Abraham, H. J., et al.: Results of the “car-bon conference” international aerosol car“car-bon round robin test stage I, Atmos. Environ., 35, 2111–2121, 2001.
Sheeman, P. E., and Bowman, F. M.: Estimated effects of tempera-ture on Secondary Organic Aerosol concentrations, Environ. Sci. Technol., 35, 2129–2135, 2001.
ten Brink, H., Maenhaut, W., Hitzenberger, R., Gnauk, T., Spindler, G., Even, A., Chi, X., Bauer, H., Puxbaum, H., Putaud, J. P., Tursic, J. and Berner, A.: INTERCOMP2000: the comparability of methods in use in Europe for measuring the carbon content of aerosol, Atmos. Environ., 38, 6507–6519, 2004.
or-ganic aerosol in the Los Angeles basin: a descriptive analysis of organic and elemental carbon concentrations, Atmos. Environ., 25A, 207–215, 1991.
Turpin, B. J., Huntzicker, J. J., Larson, S. M., and Cass, G. R.: Los Angeles summer midday particulate carbon: primary and secondary aerosol, Environ. Sci. Technol., 25, 1788–1793, 1991. Turpin, B. J. and Huntzicker, J. J.: Investigation of organic aerosol sampling artefacts in Los Angeles basin, Atmos. Environ., 28, 3061–3071, 1994.
Turpin, B. J., Saxena, P., and Andrews, E.: Measuring and sim-ulating particulate organics in the atmosphere: problems and prospects, Atmos. Environ., 34, 2983–3013, 2000.
Turpin, B. J., and Lim, H. J.: Species contributions to PM2.5 mass concentrations: revisiting common assumptions for estimating organic mass, Aerosol Sci. Technol. 35, 602–610, 2001. Van Dingenen, R., Raes, F., Putaud, J.-P., et al.: A European aerosol
phenomenology - 1: physical characteristics of particulate matter at kerbside, urban, rural and background sites in Europe, Atmos. Environ., 38, 2561–2577, 2004.
Ward, T. J., Hamilton Jr, R. F., and Smith G. C.: The Missoula, Montana, PM2.5 speciation study – seasonal average concentra-tions, Atmos. Environ., 38, 6371–6379, 2004.
Watson, J. G., Chow, J. C., and Houck, J. E.: PM2.5 chemical source profiles for vehicle exhaust, vegetative burning, geolog-ical material, and coal burning in Northwestern Colorado during 1995, Chemosphere, 43, 1141–1151, 2001.
Wotawa, G., and Kromp-Kolb, H.: The research project VOTALP – general objectives and main results, Atmos. Environ., 34, 1319– 1322, 2000.