HAL Id: hal-00299174
https://hal.archives-ouvertes.fr/hal-00299174
Submitted on 30 Sep 2004
HAL is a multi-disciplinary open access
archive for the deposit and dissemination of
sci-entific research documents, whether they are
pub-lished or not. The documents may come from
teaching and research institutions in France or
abroad, or from public or private research centers.
L’archive ouverte pluridisciplinaire HAL, est
destinée au dépôt et à la diffusion de documents
scientifiques de niveau recherche, publiés ou non,
émanant des établissements d’enseignement et de
recherche français ou étrangers, des laboratoires
publics ou privés.
Use of resistivity measurements to detect urban caves in
Mexico City and to assess the related hazard
R. G. Antonio-Carpio, M. A. Pérez-Flores, D. Camargo-Guzmán, A.
Alanís-Alcantar
To cite this version:
R. G. Antonio-Carpio, M. A. Pérez-Flores, D. Camargo-Guzmán, A. Alanís-Alcantar. Use of resistivity
measurements to detect urban caves in Mexico City and to assess the related hazard. Natural Hazards
and Earth System Science, Copernicus Publications on behalf of the European Geosciences Union,
2004, 4 (4), pp.541-547. �hal-00299174�
SRef-ID: 1684-9981/nhess/2004-4-541
© European Geosciences Union 2004
and Earth
System Sciences
Use of resistivity measurements to detect urban caves in Mexico City
and to assess the related hazard
R. G. Antonio-Carpio1, 2, M. A. P´erez-Flores1, D. Camargo-Guzm´an2, and A. Alan´ıs-Alcantar3
1Depto. de Geofisica Aplicada, CICESE, Ensenada, M´exico
2Profesionistas en Geocontrol Co., M´exico
3Depto. de Reabilitaci´on de Minas, Delegaci´on Alvaro Obreg´on, M´exico City, M´exico
Received: 12 November 2003 – Revised: 6 September 2004 – Accepted: 12 September 2004 – Published: 30 September 2004
Abstract. In the XIX century when Mexico City was much
smaller than at present, there was non-regulated mining of building materials in a region of tuffs northwest of the city in an inhabited countryside. With the growth of the city during the XX century, this region was increasingly populated and in the 1970’s many two-level bricks houses were built, without regard for underground caves created by the earlier extrac-tions. Some ground sinkings in adjacent areas alarmed the residents who now are worried about this permanent hazard. An association of residents contracted a private company for a geophysical study in order to know the distribution of the caves.
Resistivity measurements were taken in the area to de-tect the caves in order to alert city authorities. Resistivity data along most of the streets were collected with the array pole-dipole that consisted of three grounded electrodes. We performed 2-D dimensional inversions to the data in order to get a 2-D resistivity image of every street. This is sim-ilar to a resistivity cross-section of the ground but obtained from the inversion of pole-dipole and Schlumberger resistiv-ity data simultaneously. Using the information of previous drills we modified our programming code in order to per-form constrained inversion and to get more accurate resistiv-ity models in agreement with the drills. From the resistivresistiv-ity models obtained for every street it was possible to produce a map which shows the horizontal distribution of the resis-tive bodies at a depth of 12 m. These resisresis-tive bodies show coherent alignments that seem to correspond with a distribu-tions of interconnected caves or tunnels used for extracting the sandy-tuffs. From these kind of interpretation method it was intended to get a more accurate horizontal distribution of the excavated areas in order to better know the urbanized area affected and lead the authorities to remedy the area with refill material.
Correspondence to: M. A. P´erez-Flores ([email protected])
1 Introduction
The area of study is located northwest of Mexico City (colo-nia Prados La Providencia, Delegaci´on Alvaro Obreg´on), close to Sierra de Las Cruces, which is constituted of small volcanoes of andesites, breccias and tuffs of basaltic compo-sition. The area of study is a small plateau with a sequence of clays and sands with tuffs, surrounded by 20 m deep ravines. The plateau is flat and slightly dipping toward SE.
Around 1870 this area was in the countryside and it was not included in the metropolitan area of Mexico City. The area was widely used by small companies to extract mate-rial for making bricks. Historical records report that most of these materials were sold in capitol. Many of Mexico City’s buildings at that time used these bricks. At that time, there was no regulation over the extraction techniques and no record of the precise locations of the caves was taken. The extraction was carried out using picks, shovels and donkeys in the caves, according to the technique of “Rooms and Pil-lars”. This technique consists of digging a room and leaving an intact pillar of material at the center to support the roof. The rooms can be of irregular shape and interconnected with others.
The ravines were used as access to reach the sandy tuffs located close to their bottom. In this area the entrances to the mines were on the cliffs but at other sites digging was started from the surface.
Almost 60 km2of this region was affected by man-made
caves in order to extract construction materials for the growth of Mexico City. Throughout the XX century the city grew but only in 1970 it did reach this region. In the 1960’s the extrac-tion over the region was stopped and the caves were finally abandoned. With a paucity of regulation and the cheap prices for the land, many people began to build brick houses of one and two levels. The only regulation forbade further extrac-tion, but that had already stopped. The plateau is now full of masonry houses and streets with 15 years old pavement (Fig. 1).
542 G. Antonio-Carpio et al.: Use of resistivity measurements to detect urban caves L SE-17 SE-19 SE-22 M AN DADO R C E SE-18 I SE-6 SE-15 K J SE-10 SE-1 H G SE-8 SE-7 SE-2 D F SE-21 SE-20 N S A N SE-16 M AR C O S SE-12 A B SE-11 SE-3 SE-9 SE-13 SE-14 SE-5 SE-4 28 27 25 26 24 23 20 22 21 19 18 17 16 15 14 13 12 11 10 9 8 7 6 5 4 3 2 1 2 1 4 3 5 6 8 7 11 10 9 16 15 14 13 12 18 17 21 20 19 22 23 24 27 25 26 28 29 30 31 32 33 34 40 39 38 37 36 35 41 42 43 44 45 46 47 48 49 50 29 30 31 32 33 34 35 36 37 38 39 40 45 44 43 42 41 1 2 3 4 5 6 7 8 9 10 11 12 13 14 15 16 17 18 19 20 21 22 23 24 25 26 27 28 29 30 31 32 33 34 35 36 37 38 39 40 41 42 43 1 2 3 4 5 6 7 8 9 10 11 12 13 14 15 16 17 18 19 20 2 23 24 25 26 27 28 29 30 31 1 2 3 4 5 6 7 8 9 10 11 12 13 14 15 16 17 18 19 20 21 22 23 24 25 26 27 28 29 30 31 32 33 34 35 1 2 3 4 5 6 7 8 9 10 11 12 13 14 15 16 17 18 19 20 21 22 23 24 25 26 27 28 21 20 19 18 17 16 15 14 13 12 11 10 9 8 7 1 2 3 4 5 6 26 9 16 28 21 48 44 45 46 47 42 41 39 40 38 37 36 35 34 33 32 31 30 27 26 25 24 23 20 19 18 17 12 13 14 10 11 1 2 4 3 7 6 5 8 17 14 21 11 20 9 7 8 6 5 2 3 1 4 10 12 13 15 16 22 18 19 25 24 23 F 0 10 25 50 S CALE N LEGEND S E-22 NOT FOUND 2 1 23 4 FOUND VES POLE-DIPOLE LINE HOUSES AVENIDA DEL ROSAL C A L L E C A L L E C A L L E LI R IO S G A RD EN IA S CR IS AN TE M O S CALLE PAJUIL ANDADORSANMARCOS CALLE HALCONCILLOS COL. TEPEACA C A L L E CA LL E C E R R A D A C ER R AD A G IR A S O L PE N S A M IE N T O AV E D EL P A R AI S O M AR G AR IT A S CE RR A D A DE L RO SA L Mexico USA Mexico City Rabine Rabine Clif f Clif f Cliff Cliff
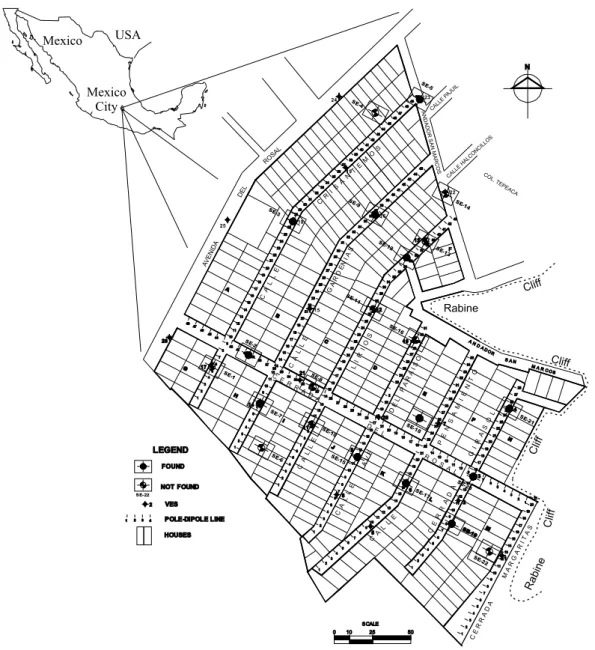
Fig. 1. The prospecting area is located Northwest of Mexico City. Data consisted of pole-dipole arrays along 8 streets of the urban sector and 26 vertical electrical soundings (VES; Schlumbergers). From the first interpretation 22 sites were proposed for drillings and 12 cut caves (filled circles).
The uncharted labyrinth of caves represents a real danger to the area’s residents. It is presumed that the tunnels run be-tween 10 and 15 m of depth because this is the depth where the exploitable sandy tuff layer is located. The caves preser-vation status is unknown; they could be fractured or even partially collapsed. The entrances were located on the cliffs, but were intentionally buried by the residents in order to stop thieves when the area began to be urbanized. The bottom of the ravines is now covered by garbage, material debris and vegetation. The caves must be interconnected to form tun-nels. Knowledge of the distribution of the tunnels is crucial for evaluating the areas of greater hazard and to put rem-edy through civil engineering. To do so, however an accu-rate determination of the spatial distribution of the tunnels is needed.
In 2001 a residents association contracted a private com-pany to apply geophysics in order to determine the location of the caves. The company applied the direct current (DC) resistivity method. They used pole-dipole profiles along the streets and vertical electrical soundings (VES or Schlum-berger) at specific sites of the streets (Fig. 1). The streets have concrete pavement, so the field crew needed to drill small holes to introduce the electrodes to have good galvanic contact with the soil below the pavement. They used four electrodes, two as sources and two as receivers. One source electrode was grounded far enough to neglect its effect in the receivers. The constant distance between receiver trodes was of 5 m. The distance between the source elec-trode and the nearest receiver elecelec-trode varied with 5, 10, 15, 20,. . . and 55 m. The Schlumberger soundings had a maxi-mum source distance (AB) of 120 m.
The equipment consisted of a transmitter GEOELEC model Tlali T-1500 with a maximum of 10 amperes of cur-rent. As a receiver, a digital multimeter with a natural poten-tial suppressor was used. The maximum current used in field did not exceed 2 amperes.
The prior interpretation of the Schlumberger soundings (Antonio-Carpio, 2003) considered a stratified subsurface (layers). The pole-dipole pseudo-sections were interpreted qualitatively (Antonio-Carpio, 2003). From this interpreta-tion twenty-two sites were suggested for drilling, and 12 of them were successful in their prediction cutting cavities (1 m in average, except SE-7 with 2 m). These drills reached a maximum of 21 to 25 m of depth.
Data seem consistent, of good quality and with low level of noise, but the interpretation has implicit errors because of the qualitative interpretation of the pseudo-sections. Pole-dipole is an asymmetric array and the geometry of the pseudo-section depends on the direction of the array, showing an inclination in the anomalies that does not exist. Those asym-metries can cause additional misunderstandings when inter-preting directly from the pseudo-section.
In this work, we reinterpreted those data, using the more advanced techniques for 2D interpretation of DC resistivity data in order to get more realistic. As a result, we were able to map the tunnel distribution.
2 Geological background
The Colonia prados la Providencia is located in the east-ern part of the Mexico city, within the Mexican Basin tec-tonic province. This basin is located in the central part of the Trans-Mexican Volcanic belt and it has an approximate
area of 9000 km2. The basin altitude of 2200 m above sea
level constitutes the highest valley in the region, and it is surrounded by mountains that reach elevations over 5000 m above sea level.
The Basin of Mexico is a high altitude volcanic structure that is bounded by the Sierrra Nevada and Rio Frio at the east, the Sierra de las Cruces at the west, the Sierras Tezont-lalpan and Pachuca to the north and the Sierra Chichinautzin to the south. The basin contains a thick volcano-sedimentary sequence, including lake sediments. Within the basin, there are several volcanic structures, such as Sierra Santa Catarina and the volcanoes La Estrella, Pe˜non Viejo, Chimalhuac´an, Xico. Some of these volcanic structures have been quar-ried for construction materials in the past and additionally the area provides part of the ground water supply for Mex-ico City (Urrutia-Fucugauchi, 1995). The closest structure to Colonia Prados la Providencia is Sierra de las Cruces, who had Upper Quaternary through Lower Tertiary volcanic ac-tivity, driving out pumice ash to the NE (Fries, 1960).
This mixture of soft volcanic material constitutes the Tarango formation that covers the area of interest (Mooser, 1975). In Table 1 the stratigraphic column for the area is shown. Layer 3, which is located between 12 to 14 m depth in the area of study, was the most used during the years of
Table 1. Description of the Tarango formation.
1 Toltosingo soil. Dark color with high content of organic material.
2 Tacubaya and Becerra soils: sandy-clays inter-digitized with caliche and pumice tuff. Mainly dark yellow.
3 Lahar with sharp clasts of 2.5 to 10 cm in a sandy matrix of blue to gray color.
4 Clay-tuff of yellow to brown color with caliche bands. 5 Coarse sandy-tuff of dirt white color, unconsolidated. 6 Clay-tuff of yellow to brown color with caliche bands.
exploitation. Layer 5 was also exploitable in other areas, but this did not occur at Prados La Providencia since it is located below the bottom of the ravines.
3 Method
Resistivity inversion can be solved by the Laplace differen-tial equation, using finite differences (Sasaki, 1989) or fi-nite elements. Another way is by mean of Integral Equa-tions. In this branch, several authors have used the scattering equation (Hohmann, 1975) and then approximation for low-resistivity contrast (Loke and Barker, 1996; Li and Olden-burg, 1992). We use a non-linear integral equation (G´omez-Trevi˜no, 1987) with the same assumption for low-resistivity contrasts (Cavazos-Garza and Gomez-Trevi˜no, 1989; P´erez-Flores et al., 2001). In P´erez-P´erez-Flores et al. (2001) the equa-tion has more physical meaning because the unknown resis-tivity (logarithm of ρ) of the ground is directly related with
the apparent resistivity (ρa) conventionally measured merely
through a weighting function (K),
log ρa(xA, XB, XM, XN) =
Z Z
K (XA, XB, XM, XN, X, Z)log ρ(x, z)dxdz, (1)
where (xA, xB) are the position of the source electrodes,
(xM, xN)for the receivers and ρ(x, z)is the unknown
resis-tivity of the ground that can vary in the horizontal direction
xand with depth z. Equation (1) was defined for a
conven-tional four electrodes array as dipole-dipole, Schlumberger and Wenner. Resistivity in Eq. (2) does not change in y direc-tion, thus this equation assumes that the bodies are elongated in that direction; they are bidimensional bodies (2D). More details of Eq. (1) are found in P´erez-Flores et al. (2001).
For many apparent resistivities taken on surface, a linear system of equations can be defined,
O = GP, (2)
where O is the logarithm of all the apparent resistivities taken along a line or along a street in our case, G the weight-ing function for all the observations and unknowns and P the logarithm of the unknown resistivities under the ground.
544 G. Antonio-Carpio et al.: Use of resistivity measurements to detect urban caves 20 40 60 80 100 120 -20 -10 5 10 15 20 25 30 35 40 45 50 55 DISTANCE (m). P SE U D O -D E PT H (m ) 4 8 12 16 20 24 AP PARE NT RE S IS TI V IT Y (o hm -m )
Fig. 2. Pole-dipole pseudo-section for the Girasol Street. Resis-tive anomalies are assumed to be associated with caves or tunnels. This array is asymmetrical and shows an inclination in the apparent resistivity anomalies. 0 20 40 60 80 100 120 -20 -10 0 10 20 30 40 50 60 70 80 90 100 110 120 130 140 150 160 170 180 190 200 DE PT H (m ). RE SI S TIV IT Y (o hm -m ) 0 4 8 12 16 20 24 20 40 60 80 100 120 -20 -10 19 20 21 22 23 24 25 26 27 28 29 30 31 32 33 34 35 DISTANCE (m). S EUDO -DE PT H (m ). AP PA RE NT RE SI S TI VI TY (o hm -m ) 4 8 12 16 20 24 ( a ) ( b )
Fig. 3. (a) Model proposed after three drillings cutting caves in Gi-rasol Street. It consists of three resistives within a homogeneous half-space obtained from the average of the data. (b) Response computed for the model in the form of pseudo-section as in Fig. 2. The small resistives are not enough to justify the anomalies shown in Fig. 2.
Equation (2) is solved by means of quadratic programming (QP; Gill et al., 1986). This kind of optimization method (QP) allows equality and inequality constraints over the un-knowns as follows,
ρl ≤ρ ≤ ρu, (3)
where ρl are the lower and ρu the upper value that certain
unknown resistivity can take.
The program for Inversion of bidimensional bodies with Eq. (2) for dipole-dipole data is available at no cost on http: //arcada.cicese.mx/geofisica/dc/direct-current.html.
Pole-dipole array was used for detecting the caves under the ground. Theoretically, one electrode is taken to infinity. Practically, one electrode is grounded very far from the mea-surements area, in order to close the source circuit and not affect the measurements. Numerically, it is equivalent to tak-ing off one point source. We modified Eq. (1) to work with
one source electrode (xA)and two receivers (xM, xN),
lead-ing to the equation,
log ρa(xA, XM, XN) =
Z Z
K3(XA, XM, XN, X, Z)log ρ(x, z)dxdz. (4)
The weighting function from Eq. (4) is different from Eq. (3) and its calculation saves approximately 40% of time.
With Eq. (4) and the constraints of Eq. (3) it was possible to introduce the information reported by the 22 drillings.
0 20 40 60 80 100 120 -20 -10 DE PT H (m .) 0 4 8 12 16 20 24 ( a ) 20 40 60 80 100 120 -20 -10 DISTANCE (m). PSE U DO -D E PT H (m ). 5 10 15 20 25 30 35 40 45 50 55 60 AP PA RE NT RE S IS TI V IT Y (o hm -m ). 4 8 12 16 20 24 010 20 30 40 50 60 70 80 90 100 110 120 130 140 150 160 170 180 190 200 R ES IS TIV IT Y (o hm -m ). ( b )
Fig. 4. (a) Best model obtained for Girasol Street. It shows the three caves and with dashed line the top of other wider resistives. (b) Response for the model in the form of apparent resistivity pseudo-section (Fig. 2). From figure 4 From figure 3 Data 102 101 101 AB/2 (m) RESISTIVITY (ohm-m) From figure 4 From figure 3 Data 102 101 101 AB/2 (m) RESISTIVITY (ohm-m) From figure 4 From figure 3 Data 102 101 101 AB/2 (m) RESISTIVITY (ohm-m) VES-2 VES-3 VES-4
Fig. 5. Comparison for the three Schlumbergers measured in Gira-sol Street and the responses of two different models. Diamonds are the data. Circles show the response for the model in Fig. 3. Solid line represents the response for the model in Fig. 4.
4 Models obtained for the profiles
Figure 2 shows the apparent resistivity pseudo-section for Girasol Street. This was the image first used for the pre-diction of the caves location. There are several resistives with a consistent inclination. This inclination is due to the asymmetry of the pole-dipole array. This additional feature difficult more the direct interpretation from the apparent re-sistivity pseudo-section. Bidimensional inversion takes this
0 10 20 30 40 50 60 70 80 90 10 0 110 120 130 140 015 160 170 180 190 200 RESISTIVITY (ohm-m). 0 20 40 60 80 100 120 140 160 180 200 -20 -10 DISTANCE (m.) DE PT H (m .) 0 4 8 12 16 20 24 28 32 36 40 VES-12 SE-11 SE-10 VES-6 VES-13 SE-13 SE-12 SW NE
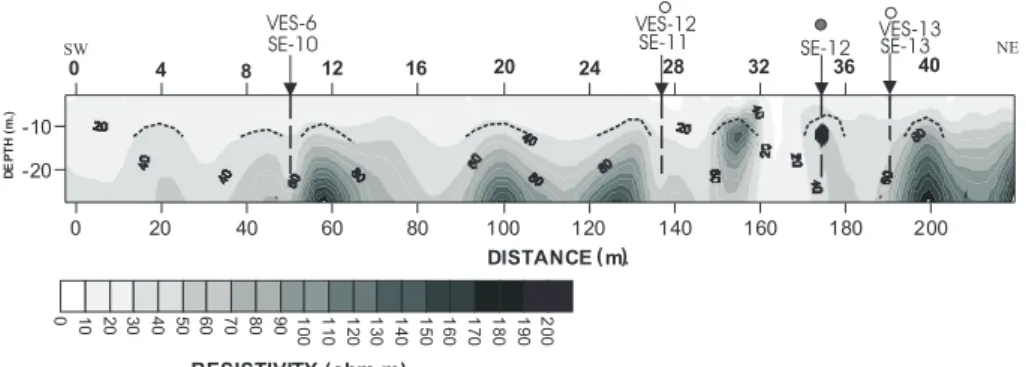
Fig. 6. Resistivity image obtained from the inversion at Lirios street.
asymmetry into account. Three successful drillings in Gira-sol Street were done, encountering caves at depth between 8 and 14 m depth, which is the presumed level of extraction. The drill reached at depth of 20 to 22, but no more caves were found.
As a first test, we did forward modeling assuming a con-stant half-space perturbed by the three caves reported by the drillings. The average resistivity obtained from the pseudo-section was used for assuming the constant resistivity host rock (Tarango formation) as shown in Fig. 3a. The com-puted response (Fig. 3b) is different from the data (Fig. 2). In Fig. 5 we compare the Schlumberger responses (circles) and the data (diamonds), interpreting bidimensionally by Eqs. (1) and (2). Neither the Schlumberger soundings resembles to the data, thus more resistives must exist in order to justify the whole pseudo-section.
Therefore, the inversion of the pole-dipole data was per-formed by means of Eq. (4). The linear system of equations was solved (Eq. 2) with quadratic programming, minimizing the difference between the data and the response of the best model obtained plus one parameter that controls the rough-ness of the model (Constable et al., 1987).
Joint inversion of the Schlumberger soundings by Eq. (1) and pole-dipole inversion with Eq. (4) were performed at the same time. This procedure solves the linear system of equations (Eq. 2), minimizing their respective differences be-tween the data and the best model response. The information obtained from the 22 drillings was incorporated in Eq. (2) by mean of equality constraints. For example, in Girasol Street one of three drills cut an empty space between 5 and 6 m and then the drill continued until 22 m. The affected cells were identified for the inversion process: from 0 to 5 m anything but not a resistive is allowed, from 5 to 6 a 1000 ohm-m a resistive and from 6 to 22 m a non-resistive. In cases where the drill did not find a cavity, the inversion was informed, al-lowing a non-resistive. This was possible by manipulating equality and inequality constraints.
Proceeding with this method, we obtained the best model shown in Fig. 4a. In Fig. 4b the apparent resistivity response for that model is shown. Comparing Figs. 4b and 2 a very good match is demonstrated. In Fig. 5 the Schlumberger responses for the three soundings (line) are shown. Again, there is a good fit with the data (diamonds).
It was demonstrated that subsurface is more complex than the simplest assumption of three holes in a constant subsur-face (Fig. 3) and that other resistive bodies must exist in or-der to account for the whole data. In other words, other caves must exist.
The dash line (Fig. 4a) indicates all the resistives that rise between 10 and 14 m (depth reported for the third layer in Tarango formation). In the resistivity image (Fig. 4a) the re-sistives look wider and deeper. We know that caves were not designed to be very wide, but the resistive anomaly can re-flect a complete loop of tunnels as miners used the Room and Pillar technique. The deeper part of the anomaly seems re-sistive, meaning that the data (Fig. 2) did not show the end of the resistive caves. Maybe, current injected was not suffient or it did find high resistance obstacles to reach deeper parts.
5 Resistivity image for a street profile and tunnel
distri-bution
The model obtained for Lirios Street (Fig. 6) consists of data from a pole-dipole section and the vertical electrical sound-ings (VES-6, VES-12 and VES-13), as well as four drillsound-ings (SE-10, SE-11, SE-12 and SE-13). The inversion took all the data and constrains with the drillings available. Only drilling SE-12 cut a cave. This cave is not enough to produce the whole anomaly measured. There are other resistive bodies under stations 12, 20, 26, 31 and 40. The drillings SE-10, SE-11 and SE-13 did not cut a cave, but SE-12 did it. The program code was informed as inequality and equality con-straints, respectively.
The other profiles were processed in the same way as it was done in Lirios and Girasol Streets. It is not the intention to describe each other. All the profiles show that several re-sistives are present in those resistivity cross-sections. Imme-diately, we can suspect that those resistives associated with the caves can exhibit a spatial regular pattern.
6 Tunnels distribution
The eight-resistivity sections with the corresponding Carte-sian coordinate for every station were taken and an interpo-lated map of resistivities (slice) at 12 m was drawn (Fig. 7).
546 G. Antonio-Carpio et al.: Use of resistivity measurements to detect urban caves 60 70 80 90 100 110 120 130 R ESIST IV IT Y (o hm -m ) L SE -17 C E R R A D A G IR AS O L C A L L E A V E D E L P A R A IS O C A L L E C D A. M A R G A R IT AS SE -19 SE -22 M CO L. TEPEACA A N D A D OR C C A L L E C R I S T A N T E M O S C A L L E G A R D E N IA S E SE -18 I C A L L E L IR IO S SE-6 SE -15 K J SE -10 C E R R A D A D E L RO SA L SE-1 H G SE-8 SE-7 SE-2 D P E N S A M I E N T O S F SE-21 SE-20 N S A N SE -16 M A R COS SE -12 AV EN I D A DE LR OS AL A B SE -11 SE-3 SE-9 SE-13 SE -14 SE-5 AN D AD OR SA N M ARCO S SE-4 AV EN I DA DE LR O SAL CALLE PAJU IL CALLE HALCO NCILL OS 28 27 25 26 24 23 20 22 21 19 18 17 16 15 14 13 12 11 10 9 8 7 6 5 4 3 2 1 2 1 4 3 5 6 8 7 11 10 9 16 15 14 13 12 18 17 21 20 19 22 23 24 27 25 26 2829 3031 32 3334 40 39 38 37 36 35 41 42 43 44 45 4647 48 4950 29 30 31 32 33 34 35 36 37 3839 40 45 44 43 42 41 1 2 3 4 5 6 7 8 9 10 11 12 13 14 15 16 17 18 19 20 21 22 23 24 25 26 27 28 29 30 31 3233 34 35 36 37 3839 4041 4243 1 2 3 4 5 6 7 8 9 10 11 12 13 14 15 16 17 18 19 20 21 22 23 24 25 26 27 28 29 30 31 1 2 3 4 5 6 78 9 1011 1213 14 15 16 17 18 19 20 21 22 23 24 25 26 27 28 29 30 31 32 33 34 35 1 2 3 4 5 6 7 8 9 10 11 12 13 14 15 16 17 18 19 20 21 22 23 24 25 26 27 28 21 20 19 18 17 16 15 14 13 12 11 10 9 8 7 1 2 3 4 5 6 26 9 16 28 21 48 44 45 46 47 42 41 39 40 38 37 36 35 34 33 32 31 30 27 26 25 24 23 20 19 18 17 12 13 14 10 11 1 2 4 3 7 6 5 8 17 14 21 11 20 9 7 8 6 5 2 3 1 4 10 12 13 15 16 22 18 19 25 24 23 F' C 0 10 25 50 SCALE N LEGEND SE-22 NOT FOUND 2 FOUND 1 2 3 4 VES POLE-DIPOLE LINE HOUSES
Rabin
Rabin
Cliff
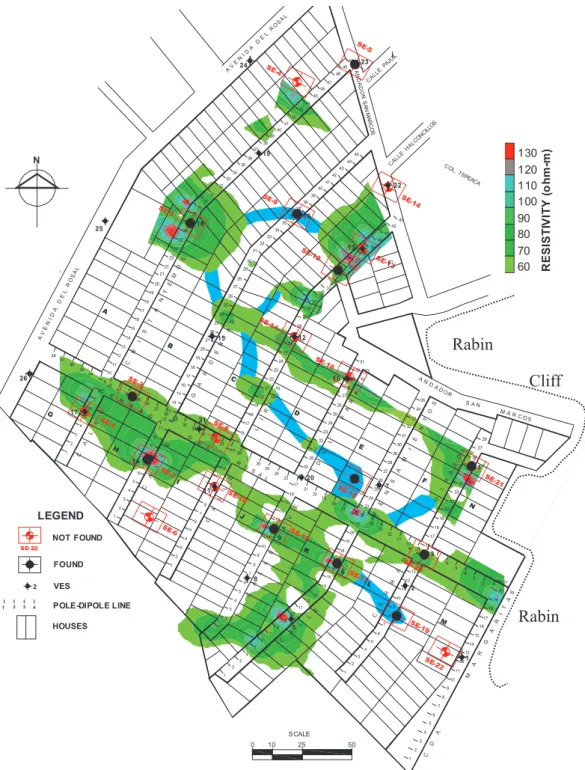
Fig. 7. Resistivity slices at 12 m depth over the streets map. Only resistive contours are shown. Plot suggests that resistive distribution may correspond with tunneling. Wider anomalies may correspond to Room and Pillars loops. Blue thick lines are suggested connections between resistives, representing the areas of greater hazard.
This map or horizontal slice was used to visualize the linear correlation between the profiles of the streets.
Figure 7 shows the resistivity slice at 12 m depth, where the caves or tunnels are located. From the linear trends we can infer that the caves form tunnels or interconnected rooms and pillars. Only the high resistivity contours were plotted over the street map. Regions with no data, which appeared at the border of the area, were erased from the interpolated
map. Despite the distance of 30 to 35 m between two streets, there is a consistent linear correlation between their respec-tive resistivity cross-sections. A thick blue line was drawn where we believe that there is a correlation between resis-tives, although the krigging interpolator found the size of the resistives to be small. At the SE of the area there is a linear trend that ends at the ravine. This likely corresponds to a tun-nel entrance on the cliff close to Margarita Street. This linear
trend runs 240 m toward the NW and is consistent in all pro-files. The trend was plotted to Crisantemos Street (at the NW), but it may continue further. This seems to be the main tunnel or a set of rooms and pillars in the area. At the south of this trend there is another resistive centered in Pensamientos Street (station 6 to 10). We suggest that these are several tun-nels or Rooms connected to the principal. From Pensamien-tos Street almost to the North there is another path connect-ing the main tunnel with a large resistive under station 29 in Crisantemos Street. This path is supported for three resis-tives that cross in Paraiso, Lirios and Gardenias streets and a cave was detected near station 25 at Pensamientos street. The wide resistive in station 28 at Crisantemos Street suggests a complex of Room and Pillars. Close to station 26 in Gira-sol Street another resistive trend begins. This may continue to the cliff and be another entrance. Despite main entrances were erased 40 years ago, some holes are shown over the
cliff, but they are small in size (0.5 m2)and collapsed.
7 Conclusions
In Fig. 7 we estimate a total length of 1100 m of tunnels. Considering linear paths we initially estimate a volume of
4400 m3 of extracted material based on the following
as-sumptions. The width and height of the original tunnel is not known, but considering a person and a donkey in movement, we estimate dimensions of 2×2 m. Further, the room and pillars technique support a maximum width of 6 m.
Consid-ering linear paths we initially estimated a volume of 4400 m3
of extracted material but considering at least two sides for
the rooms, the volume may increase to 8800 m3. Also, there
is the possibility that narrower tunnels not detected were presents. The volume may be a little bigger. This quantity is important for a priory estimation of refill material needed to remedy this hazardous area.
After more than 100 years from the beginning of the ex-tractions and 50 years since its abandonment, the condition of the tunnels continues to be unknown.
The roofs are the most susceptible for cracking producing an upward propagation and posterior collapsing.
If we consider that the top of the tunnel is located
approx-imately at 12 m depth with an average density of 2.2 gr/cm3,
there is a compression of approximately 30 ton/m2 on the
roofs of tunnels. The later construction of two level-houses
added 2 to 3 ton/m2, representing a 10% excess. Humidity,
seismic activity, traffic and lithostatic weight plus the excess of mass of the houses can precipitate cracking around the tunnels. Presently, there are no surface evidences of fracting (sidewalks, roads or houses), but collapses before the ur-banization may have occurred, and those affectations to the surface refilled by the people, showing presently an undis-turbed surface. It is unnecessary to wait for surface evi-dences of cracking in order to alert authorities to the hazard posed in this urbanized zone of Mexico City. Unfortunately, there are no records of the exploitation, only people’s nar-ratives collected by authorities. Today, there are some
col-lapsed holes on the cliff walls. Main entrances to the tunnels have been erased and there is vegetation and garbage over the ravines. Through joint inversion of Schlumberger and pole-dipole data constrained by the drillings it was possible to get a sharper image of the subsurface and to identify and map the horizontal distribution of the tunnels through the resis-tivity slice at 12 m (Fig. 8). Future work to identify narrower tunnels can occur during the remediation drilling using wider drilling and descents with topographical equipment as it has done in other sites.
Acknowledgements. We want to thank CONACYT for their
financial support; F. Su´arez for their valuable comments over the geology; profesionistas en Geocontrol Company for the permission for using the data; for the useful comments of the reviewers; H. Ben´ıtez for his help with the drawings; F. Camarillo (Delegaci´on Alvaro Obreg´on) for facilitating the historical records of the area and to K. Englander for reviewing the manuscript.
Edited by: F. Guzzetti
Reviewed by: V. Lapenna and another referee
References
Antonio Carpio, R. G.: Application of the DC geoelectrical method for detecting caves in colonia Prados La Providencia, Mexico City, Bachelor Thesis, Mexican Polytechnic Institute, 2003. Cavazos Garza, R. and G´omez-Trevi˜no, E.: Hacia la inversi´on
tridi-mensional de anomal´ıas de resistividad y polarizaci´on inducida, Geof´ısica Internacional, 28, 481–505, 1989.
Constable, S. Parker, R., and Constable, C.: Occam’s inversion: A practical algorithm for generating smooth models from electro-magnetic data, Geophysics, 52, 289–300, 1987.
Fries, C.: Geolog´ıa del estado de Morelos y de partes adyacentes de M´exico y Guerrero, regi´on central meridional de M´exico, Bol. del Instituto de Geolog´ıa, UNAM, 60, 236–242, 1960.
Gill, P., Hammarling, S., Murray, W., Saunders, M., and Wright, M.: User’s guide for LSSOL, A package for constrained linear least-squares and quadratic programming, Stanford Univ. Tech-nical Report SOL-886-1, 1986.
G´omez-Trevi˜no, E.: Nonlinear integral equation for electromag-netic inverse problems, Geophysics, 52, 1297–1302, 1987. Hohmann, G. W.: Three-dimensional induced polarization and
elec-tromagnetic modeling, Geophysics, 40, 309–324, 1975. Li, Y. and Oldenburg, W. D.: 3-D inversion of induced polarization
data, Geophysics, 65, 1931–1945, 1992
Loke, M. H. and Barker, R. D.: Rapid least-squares inversion of ap-parent resistivity pseudosections using a quasi-Newton method, Geophysical Prospecting, 44, 131–152, 1996.
Mooser, F.: Historia geol´ogica de la Cuenca de M´exico, Technical report, System of deep drainage in Mexico City, book I, 7–38, 1975.
P´erez-Flores, M. A., Mendez-Delgado, S., and G´omez-Trevi˜no, E.: Imaging low-frequency and dc electromagnetic fields using a simple linear approximation, Geophysics, 66, 1067–1081, 2001. Sasaki, Y.: Two-dimensional joint inversion of magnetotelluric and dipole-dipole resistivity data, Geophysics, 54, 256–262, 1989. Urrutia-Fucugauchi, J.: Paleomagnetic constraints on
spatial/tem-poral volcanic activity in the Santa Catarina-chalco region South-eastern basin of Mexico, Geof´ısica Internacional, 34, 1, 55–66, 1995.