HAL Id: hal-02457314
https://hal.univ-lorraine.fr/hal-02457314
Submitted on 23 Jun 2020HAL is a multi-disciplinary open access archive for the deposit and dissemination of sci-entific research documents, whether they are pub-lished or not. The documents may come from teaching and research institutions in France or abroad, or from public or private research centers.
L’archive ouverte pluridisciplinaire HAL, est destinée au dépôt et à la diffusion de documents scientifiques de niveau recherche, publiés ou non, émanant des établissements d’enseignement et de recherche français ou étrangers, des laboratoires publics ou privés.
case study of the Tamariu granite, Catalunya, Spain
Lionel Bertrand, Yves Géraud, Edouard Le Garzic, Joachim Place, Marc
Diraison, Bastien Walter, Sébastien Haffen
To cite this version:
Lionel Bertrand, Yves Géraud, Edouard Le Garzic, Joachim Place, Marc Diraison, et al.. A multiscale analysis of a fracture pattern in granite: A case study of the Tamariu granite, Catalunya, Spain. Journal of Structural Geology, Elsevier, 2015, 78, pp.52-66. �10.1016/j.jsg.2015.05.013�. �hal-02457314�
Accepted Manuscript
A multiscale analysis of a fracture pattern in granite: A case study of the Tamariu granite, Catalunya, Spain
Lionel bertrand, Yves geraud, Edouard Le Garzic, Joachim Place, Marc Diraison, Bastien Walter, Sébastien Haffen
PII: S0191-8141(15)00112-1 DOI: 10.1016/j.jsg.2015.05.013
Reference: SG 3229
To appear in: Journal of Structural Geology Received Date: 28 November 2014
Revised Date: 24 April 2015 Accepted Date: 13 May 2015
Please cite this article as: bertrand, L., geraud, Y., Le Garzic, E., Place, J., Diraison, M., Walter, B., Haffen, S., A multiscale analysis of a fracture pattern in granite: A case study of the Tamariu granite, Catalunya, Spain, Journal of Structural Geology (2015), doi: 10.1016/j.jsg.2015.05.013.
This is a PDF file of an unedited manuscript that has been accepted for publication. As a service to our customers we are providing this early version of the manuscript. The manuscript will undergo copyediting, typesetting, and review of the resulting proof before it is published in its final form. Please note that during the production process errors may be discovered which could affect the content, and all legal disclaimers that apply to the journal pertain.
M
ANUS
CR
IP
T
AC
CE
PTE
D
A multiscale analysis of a fracture pattern in granite: A case study of the
Tamariu granite, Catalunya, Spain.
Lionel BERTRAND * a, Yves GERAUD a, Edouard LE GARZIC a, Joachim PLACE b, Marc DIRAISON c, Bastien WALTER a, Sébastien HAFFEN a.
a
GeoRessources, UMR 7359 ENSG -Université de Lorraine/ CNRS/CREGU, 2 rue du Doyen Marcel Roubault, Vandoeuvre-les-Nancy Cedex 54518, France.
b
Department of Earth Sciences, Uppsala Universitet, Villavägen 16, SE-752 36 Uppsala, Sweden.
c
Institut de Physique du Globe (IPG), UMR 7516 CNRS-Université de Strasbourg/EOST, 5 rue René Descartes, Strasbourg Cedex 67084, France.
Emails : [email protected] +33 3 83 59 64 55 France [email protected] [email protected] [email protected] [email protected] [email protected] [email protected] Keywords :
fracture network in granite; reservoir analogue; multiscale analysis; length distribution; relation between 1D and 2D sampling method
M
ANUS
CR
IP
T
AC
CE
PTE
D
AbstractThe in-depth investigation of fractured reservoirs is mainly limited to geophysical data that is in 3D and mostly on the scale of hundred meters to several kilometers or boreholes data that is in 1D and at meter to lower scale. The study of outcropping analogs of buried reservoirs is therefore a key tool for the characterization of the fault and fracture network at the reservoir scale. Tamariu granite has been the subject of this study with the aim to analyze faults and fractures from seismic to borehole scale. With the combination of satellite picture at different resolution and field study, we perform a statistical analysis focused of the length and orientation from infra centimeter crack to hundred kilometer length fault. On the whole range of scale studied, i.e. on 7 orders of magnitude, we have defined a length distribution following a power-law with an exponent a= -2. On the contrary to the length that can be modeled with a unique law, the orientation data shows a variation depending on the scale of observation: as the fault and fracture sets are suitable from the regional faults to the centimeter crack, the proportion of the sets varies at each scale of observation.
M
ANUS
CR
IP
T
AC
CE
PTE
D
1. IntroductionFracture networks are known to be a main fluid flow pathways in a large set of geological formations, and notably, in crystalline or in low porosity sedimentary rocks. In this particular type of rock, the hydrothermal alteration or weathering can significantly enhance the matrix porosity, but in a non-altered rock mass, the matrix has in general a low porosity and permeability. As a consequence, in a poorly altered basement reservoir, the fracture network controls the fluid flow (Nelson, 2001). Fractured systems in crystalline rocks are therefore the subject of studies nowadays due to the large applications in CO2 storage, water resources,
geothermal or petroleum reservoirs, nuclear wastes storage (Genter and Castaing, 1997;
Luthi, 2005; Rempe, 2007; Cuong and Warren, 2009; Géraud et al., 2010; Marques et al.,
2010). To model and predict the fluid flow in such reservoirs, it is thus essential to
characterize the fracture network properties (Long and Witherspoon, 1985; de Dreuzy et al.,
2001a & b; de Dreuzy et al., 2002). Behind the fractures and fault zones hydraulic properties,
several geometric parameters are required, such as the distribution of the length, spacing, aperture or density of the fractures over the largest possible scale ranges (De Dreuzy et al.,
2004; Berg and Øian, 2007). Even though various measurement methods and tools exist, the
data are rarely available over the whole scale of the fractured system. In addition, the link between varied measurements and scales is not conspicuous and has been the subject of different studies (Gillespie et al., 1993; Pickering et al., 1995; Marret et al., 1999; Ehlen,
2000; Bour et al., 2002; Peacock et al., 2003; Zimmermann et al., 2005; Davy et al., 2006a;
Manzocchi et al., 2009; Riley et al., 2011). Multi-scale studies have been undertaken mostly
in sedimentary rocks (Castaing et al., 1996; Odling, 1997; Marret et al., 1999; Cello et al.,
2001; Gillespie et al., 2001; Soliva et al., 2005; Fagerend, 2011), and few of them were
M
ANUS
CR
IP
T
AC
CE
PTE
D
Garzic et al., 2011). These data allow mostly a 2D characterization of the fracture network.
For deep rock body analysis, the only available information about fracture networks are boreholes data that are 1D and between millimetres to tens of centimetres in scale, and seismic lines data that are 2D, sometimes 3D, from hundred of metres to several kilometres in scale. In addition, fractures and faults in crystalline rocks are poorly investigated with seismic methods and their detection requires specific data processing. Given that the interval between the borehole and seismic scales constitutes what is the reservoir, it is therefore essential to analyse it, even tough there is no tool to characterize and visualize fractures ranging in this interval.
So as to enhance the knowledge about fracture networks between the various scales and dimensions, it is paramount to study fractured reservoirs field analogues (McCaffrey et al.,
2003). Crystalline rock outcrops expose in few favourable cases the fracture pattern and allow
the study in 1D, 2D or 3D at different scales between the sample and the regional fracture and faults network. Many outcrop studies focus on the interaction between the fracture network properties and the rock mass permeability and porosity at different scales (e.g. Géraud et al., 2006; Forster et al., 1997; Bellot 2008; Manda et al., 2008). However, on many outcrops, the fractures are only exposed in a limited area and the study of the fracture system in a large-scale range becomes impossible. With the aim to propose the largest ranging large-scale analysis for a fracture network, we have combined the analysis at metre scale and lower of the Tamariu outcrop in the Catalonian Coastal Ranges, in Spain (this study) and previous studies undertaken by Le Garzic (2010) and Place (2010) which provide a structural network on both regional and local scales. At the regional scale, faults between approximately 1 km and 100 km in length were analysed, and the regional structural context of the Tamariu area was defined (Le Garzic, 2010). The second study has highlighted a complex fracture and fault network on the Tamariu outcrop, which is controlled at the kilometre scale by the regional
M
ANUS
CR
IP
T
AC
CE
PTE
D
deformation (Place, 2010). In this paper, we will attempt to define the fracture network on the scale under tens metres belonging to Tamariu outcrop. Due to the lack of motion markers along the fractures in the granite at the outcrop scale, the term fracture will be used in this article for any planar brittle discontinuity (faults, joints, or veins) (Bonnet et al., 2001;
Peacock et al., 2003). Measurements will be performed in the field using 1D scan lines and
2D fracture maps and, at more a precise scale on a 10 by 20 cm sample. This will enable us to integrate fracture lengths information between the seismic scale and the borehole scale with a sub-centimeter precision.
2. Geological settings
The Catalonian Coastal Ranges (CCR) are a part of the Valencia Trough, which corresponds to the NW part of the Mediterranean margin along the Spanish coast (Fig. 1a). They are composed of two sub-parallel mountain belts with an approximately N060°E elongation; formed by heads of tilted blocks separated by Neogene sediments and basaltic volcanism (Enrique, 1990; Julivert and Duràn, 1990). The basement of the sediments is composed of metasediments dated from Cambro-Ordovician to early Carboniferous intruded by granites at the end of the hercynian orogen (late Carboniferous to early Permian), (Enrique, 1990; Julivert and Durán, 1990). These granites have a mantellic origin with various degrees of continental contamination and a geochemical signature of post-collisionnal magmatism (Enrique, 1990; Julivert and Durán, 1990; Ferrés-Hernàndez, 1998). As a consequence of their late emplacement, they are poorly affected by the hercynian deformation, aside from some wide late Hercynian strike-slip faults NW-SE to NNW-SSE and NE-SW to ENE-WSW in direction (Arthaud and Matte, 1975).
M
ANUS
CR
IP
T
AC
CE
PTE
D
Since the end of the hercynian orogen, the CCR were deformed by several geological events: the Permian extension phase, the opening of the Tethisian Ocean between the late Permian and Jurassic times, and the formation of the Pyrenees during the Eocene and lower Oligocene N-S compression. Those tectonic events have reactivated the late Hercynian strike-slip faults, with different rates and motions, and created new faults in the sedimentary cover (Bixel, 1987; Salas and Casas, 1993; Guimerà, 1994; Alsaker et al., 1996; Beaumont et al.,
2000; Stampfli et al., 2002; Vergès et al., 2002; Juez-Larré and Andriessen, 2006; Diez et al.,
2007).
In the late Oligocene, the propagation towards the SW of the West European Rift and the accretion of the Burdigalian oceanic crust induced the formation of the Catalan margin. Their geometry is now a set of horst and grabens limited by inherited Hercynian faults E-W in direction and tertiary faults NE-SW to ENE-WSW in directions, with the Hercynian material that outcrops at the head of the tilted blocks (Batrina et al., 1992; Roca and Guimera, 1992;
Watts and Torné, 1992; Salas and Casas 1993; Mauffret et al., 1995; Séranne et al., 1995;
Goula et al., 1999; Roca et al., 1999; Lewis et al., 2000; Parcerisa et al., 2007) (Fig. 1a).
Moreover, wide transfer zones, oriented N120°-130°E approximately, compartmentalized the Valencia Trough, like the Catalan Transform fault (CTZ) (Maillard et al., 1992). Thus, the CCR are divided in two zones depending on the geometry and kinematics of the extensional and compressional structures (Roca et al., 1999). On the one hand, the north zone, which is the onshore extension of the CTZ with NW-SE faults directions. On the other hand, the south zone, which is the Catalan margin primary shoulder, is structured by Hercynian faults reactived during Tertiary and forming tilted blocks with a NNW direction (Fig. 1b).
The Tamariu granite is a batholith that outcrops in the Northern sector in the Sant Feliu horst (SFb Fig. 1b). The outcrop is along the Mediterranean coast between Cala Tamariu and Cala Pedrosa and has approximately 1 km in length (Fig. 3b). It is chiefly a
M
ANUS
CR
IP
T
AC
CE
PTE
D
biotite granodiorite with K-feldspar megacrysts dated from 288.4 ±2 Ma (Ferrés-Hernàndez,
1998), with some Permian spessartite dykes that intrude the granitic body (Solé et al., 2002).
3. Large-scale fault and fracture network
3.1. Regional scale
A regional analysis of the faults was undertaken at different scales from the large CCR faults to the more local fault on the Sant Feliu horst using regional maps, satellite pictures, DTM data and field studies (Le Garzic, 2010). Four orders of faults are defined depending on their characteristics and scales: 1) the first order faults composed of the lithospheric and crustal faults measuring approximately 100 km in length, forming crustal scale deformation clusters of few kilometres width, and make the main structure of the Catalan margin, 2) the second order with faults measuring approximately 20-30 km in length and that control the horst and graben structures of the CCR 3) the third order with faults measuring around 10 km in length that decompose the horst or grabens blocks in third order blocks and form the main eroded valleys visible on the DTM datas, and finally 4) the fourth order faults measuring less than 1 km in length were the fault core and damaged zone can be found on the field associated with a fracture network between them.
At all scales, two different tectonic systems have been identified: the faults trending between N000°E and N100°E are associated with the main thinning of the Catalonian margin, whereas faults trending between N100°E and N150°E are the onshore extension of the Catalonian transform fault (Roca et al., 1999; Le Garzic, 2010). Those two systems are expressed differently depending on the observation scale.
M
ANUS
CR
IP
T
AC
CE
PTE
D
On the map of the Catalan margin compiled from published data onshore and offshore (Fig. 2a), At the first order scale, the first geological system is represented by faults in the first order scale with N050°E and N060°E directions (grey arrows on the orientation
diagram, Fig. 2a). These faults are linked to the margin extension. The second system is the
extension onshore of the Catalonian transform fault, which reactivates the N140°E direction (black arrows, Fig. 2a). At the scale of the CCR, the faults traces have been mapped from DTM data and can be associated mostly to the second order of faults (Fig. 2b). These second order’s fault set is composed almost by faults with the same orientations than those of the first order, but with only a shift of 10° for the rift faults (grey arrows, Fig. 2b) and a new secondary fault direction linked to the CTZ (white arrows, Fig. 2b).
There is a significant change in the fault network at the scale of the Sant Feliu horst, that is a block delimited by first order of scale faults, i.e. a first order structural block. The map of the block is an compilation of published data (Fontboté et al., 1990; Pous et al., 1990; Banda
and Santanach, 1992; Roca and Guimerà, 1992; Tassone et al., 1994; Cabrera and Calvet,
1996; Goula et al., 1999; Roca et al., 1999; Mapa Geològic de Catalunya 1: 50 000; Mapa
Geològic de Catalunya 1: 250 000) and the faults traces identified on the DTM data (Fig. 2c).
The faults of first and second orders controlling the basin structures coexist with the Hercynian reactived faults ≈E-W in direction (black arrows, Fig. 2c). At this scale, the faults linked to the CTZ show several different faults directions indicating that the fault network is more complex (white arrows, Fig. 2c).
With help of geomorphological and structural observations on the field compared to the DTM data, a second order block has been mapped in the area of Sant-Feliu (Fig. 2d). At this scale, only the third and fourth orders of faults have been mapped, and the orientation diagram confirms the observations of the whole Sant-Feliu horst: fracture and fault network within the internal part of the block is mostly controlled by ≈E-W direction (black arrows, Fig. 2d).
M
ANUS
CR
IP
T
AC
CE
PTE
D
3.2. Palafrugell area and Tamariu outcrop
With a combination of DTM data and the geological map (Cartographic Institute of
Catalonia, 1:50 000), Place (2010) has mapped the third order of faults in the Palafrugell
second order block, where Tamariu outcrop is located (Fig 1c & 3a). As in the Sant Feliu block, the main direction of the fault network is ≈E-W (black arrow, Fig. 3a) with several secondary directions linked to the CTZ system (white arrows, Fig. 3a).
Tamariu outcrop is located in the South of the Palafrugell second order block, and forms a third order block limited by a ≈NW-SE third order fault to the North (Cala Tamariu) and a
≈E-W one to the South (Cala Pedrosa) (Fig. 3b). This block outcrops along the Mediterranean
coast with an approximately N-S trending and offers a transect through the whole block. From image analysis and the field mapping, ≈E-W fourth order faults have been recognized and divide the Tamariu block into four fourth order blocks (Place, 2010).
Within a fourth order structural block, faults are subdivided into two groups: the main faults with fault core and damage zone up to 1 m in width and the minor faults with a damage zone of less than 10 cm in width (black lines, Fig. 3b). The main faults are mostly ~N080°E in direction (black arrows, Fig. 3b), while the set between N040°E and N080°E in directions are more represented at the scale of the minor faults (grey arrows, Fig. 3b). In addition, the fractures on this scale have been mapped on a high-resolution satellite picture (Fig. 3c). On this map, the main lineament direction is around N110°-N120°E and are linked to a spessartite dyke and associate fractures particularly visible on this scale, in particular in the block 1 & 4 (black arrows, Fig. 3c). Within blocks, fractures’ directions N040°E N065 and N075°E are also present, with a newly observed N020°E direction (grey arrows, Fig. 3c). We can however note that the approximately N-S fracture orientation is certainly underestimated due to the N-S trending of the outcrop.
M
ANUS
CR
IP
T
AC
CE
PTE
D
4. MethodsTo undertake the characterization of the fracture system between decametre and centimetre length scale, we decided to focus on the fourth order block n°3, and more specifically on the
black frame, in Fig. 3b. This targeted area was chosen because the mean fault and fracture
distribution are representative of the whole outcrop. Indeed, the block exposure led us to draw sub-horizontal scan lines, with orientations summarized in table 1, intersecting enough fractures to permit a statistical analysis. The studied area is cut by a main fault outlined by
Place, 2010 (Fig. 3b & 4a), having a decametre wide fault core filled by carbonates and
granite breccias.
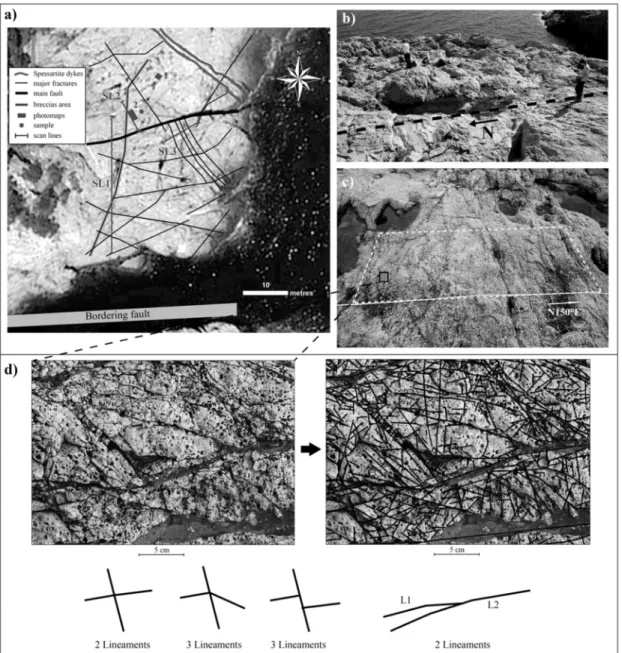
In order to analyse the fracture network at various scales and dimensions, we combine 1D and 2D data (Gillespie et al., 1993; Bonnet et al., 2001; Gillespie et al., 2001). A general map of the 60 by 40 m area was drawn from a GoogleEarth© view, in order to localize the largest fractures (Fig. 4a). All fractures drawn on this map were longer than 10 m. With the aim to identify fractures with a length comprised between a decimetre and a metre, we drew 3 scan lines on the outcrop. Their orientations were selected in order to sample the main sets of fractures observed on the general map (Fig. 4a), i.e. perpendicular to the main orientations of the fractures (Table 1). The first scan line starts on the structural block bordering fourth order of fault, trending N000°E, over 30 m in length (SL1, Fig. 4a). This scan line is long enough to procure a good statistical view of the fracture network, with more than 600 measured fractures (Ehlen, 2000). The N-S orientation was chosen to cut the main fractures direction of ~N060°E to ~N110°E (Fig. 4a), and for being perpendicular to the main structure orientation identified by Place (2010) (Fig. 2b). The second scan line is oriented N150°E with 7.33 m long (SL2,
Fig. 4a). It begins on the main fault that passes through the outcrop. This scan line was
designed in order to study the influence of this fault on the fracture density. The third scan line, oriented N060°E with 9 m length, was created in order to take into account the NW-SE
M
ANUS
CR
IP
T
AC
CE
PTE
D
family of fractures in the eastern part of the area (SL3, Fig. 4a). On each scan line, all fractures ranging between 1 cm and approximately 10 m long were measured in terms of orientation, length and thickness.
In order to sample the short fractures in detail, we created fracture maps by taking photographs of the outcrop (Fig. 4c). A 50 mm focal lens was used to minimize the distortion of the fractures. The photographs were taken in the absence of sunlight on the outcrop to avoid any light effect in fracture identification (Odling, 1997). The maps were then georeferenced in order to allow the calculation of lineament length and orientation using ArcGIS©. To establish the fracture maps, all fractures were manually traced, averaging the fracture roughness, with help of brown carbonate in the thickest fractures (Fig. 4d). All fractures have been picked, from the several decimetre lengths to the millimetre cracks visible cross-cutting only few minerals. On the fractures intersections, the lineaments are traced continuously if there is no significant change in fractures orientation (Fig. 4d).
The map 1 represents a 1.2 m side square and is located far from the influence of the main fault (1, Fig. 4a). The map 2 measures 1.2 m per 2.4 m and is limited by SL2 on its west side (2, Fig. 4a). This area is under the influence of the structural block main fault, with an area of higher fracture density compared to map 1. Finally, a sample was collected near the map 2 in an area where intense N090°E direction structures were identified (grey point, Fig. 4a) with very short fractures easily identifiable with the help of brown mineralization. It was photographed in order to construct map 3 measuring 20 cm per 10 cm. This permits us to extend the study further to a very small scale and define very short fractures, millimetre to decimetre in length.
M
ANUS
CR
IP
T
AC
CE
PTE
D
5. ResultsThe number of fractures for each scan lines and maps of fractures are summarized in the
Table 1.
5.1.Scan lines:
Fracture orientation distributions have been represented as histograms (Fig. 5). The orientation is plotted against cumulative length so as to not underestimate long fractures against shorter fractures. With the intention to obtain a better visibility, they have been grouped in 10° bins. The black zones represent the zones where fracture orientation is not represented, since for the fractures with orientations within a cone of 10° on each side of the scan line orientation, the fracture density is highly underestimated. Outside of these directions, the sampling effects of the fractures against the scan line orientations are corrected with the Terzaghi’s coefficient (Terzaghi, 1965; Peacock et al., 2003; Davy et al., 2006a). The correction has been made with Spheristat©, by applying an angular correction coefficient on each fracture depending on the angle between the fracture and the SL orientation as described in Goodman (1976). From SL1 and SL2, we have calculated the density distribution along the lines and plotted the length distribution against the cumulative fracture number (Bonnet et al., 2001) (Fig. 5). The density is calculated on each centimetre of the scan line with a window of 2 m. Breccias zones are areas with a fracture density too high to permit the picking of individual fractures. On SL3 the small number of fractures measured does not allow the density and length distribution calculation.
On SL1 and SL2, the fractures orientation follows mainly the N050-N070°E directions (white arrows, Fig. 5a &b), which are consistent with the minor faults orientation observed at the scale of the Tamariu entire outcrop (Fig. 2b) (Place, 2010). Secondary fractures directions
M
ANUS
CR
IP
T
AC
CE
PTE
D
are also present, such as N020-040°E, N100°E, and N120°E (black arrows, Fig. 5a & b). No density increase is observed on the southern part of the SL1, which is located near the fault bounding the structural block. We can even notice a relatively low fracture density in the first 6 m of the SL compared to the average density (Fig. 5a). The highest fracture density area is located south of the breccia zone at approximately 10 m. This area corresponds to the intersection between a N110°E major fracture zone and the N030°E breccia structure (Fig.
4a). With the exception of these two areas, the fracture density is relatively homogenous with
an average density of 26 frac/m if we exclude the “no data” zone, between 12.5 m and 13.5 m. SL2 starts at the main fault within the structural block (Fig. 4a). Its fracture density shows a slight decrease when moving away from this main fault (Fig. 5b), but the average fracture density is relatively high (46 frac/m) compared to SL1. Outside the biases due to the sampling method, i.e. truncation and censoring, the length distribution of the two SL shows a power-law distribution (Fig. 5). Truncation is the underestimation of the short fractures linked to the resolution limitations of the map or the visual limitation on a SL. Censoring is due to the long fractures that intersects the border of the map and are therefore underestimated in length or those that are too long for measuring the length, and those that are not included in the sampling area (Pickering et al., 1995; Bonnet et al., 2001). The exponent of the power-law is similar for the two SL and is around 1, and the lower cut-off between the fitted and the biased data is around fracture length of 20-30 cm.
SL3, with a N060°E orientation, reveals a fractures set oriented N150°E, a direction seldom presents on SL1 and SL2 because of their orientations, but very dense in this part of the outcrop (grey arrow, Fig. 5c). This orientation is predominant here, and is consistent with a family of fractures remarkably straight as observed on the general map (Fig. 4a).
M
ANUS
CR
IP
T
AC
CE
PTE
D
5.2.Fractures Maps 5.2.1. Description of MapsThe map 1 is located far away from the main fractures at the outcrop scale (Fig. 4a). Nevertheless, the raw map indicates intense fractured areas, chiefly on the NW part of the map (Fig. 6a). This area is in fact on the intersection between a cluster of N060-070°E fractures and ~N030-040°E fractures with thick carbonates mineralization that crosscut the whole map. In this part of the map, the fracture density is very high and can result in some small breccia areas (highly fractured area, fig. 6a). In the rest of the map, the granite seems less fractured, but in details there is many short fractures (less fractured area, Fig. 6a). With all these short fractures, the fracture average fracture density of the whole map reaches to 7208 frac/m2. The diagram of the fracture orientations, regrouped in 5° bins, highlights three
fracture families: N030-055°E, N060-090°E and N120-140°E with a nearly symmetrical distribution around the centre of the fracture set (Fig. 6b). The length distribution plotted in fig 6c expose a power law distribution outside of the sampling biases. This power-law has an exponent a= -1,86 and is valid for fractures length approximately between 2 cm to 120 cm, that is the map width.
Contrary to the map 1, the map 2 is located near the main fault of the area of study and the N000°E to N030°E breccia zone (Fig. 4a). The raw map outlines intense fracturing, primarily in the northern end of the map, where a cluster of N070-080°E fractures intersects a ~N090°E one (Fig. 7a). On the rest of the map, the main fractures create a network of carbonates veins mainly visible in the southern part. Despite of the localisation of the map near the fault zone, the whole fracture density is comparable to the map 1 with 6601 frac/m². The fracture orientation presents once again a symmetrical distribution around main fracture sets, with mainly two sets on this map: N060°-080°E and N140°-N160°E (Fig. 7b). As the map 1, the length distribution of the fractures follows a power-law outside of the biased fracture lengths,
M
ANUS
CR
IP
T
AC
CE
PTE
D
roughly between 3 cm and 1 m (Fig. 7c). The exponent of this power-law is a little higher with a= -1.93.
The map 3 is a “zoom” of the northern par of the map 2 with N080°-090°E as direction of the main fracture set (Fig. 8a). At this scale, the thickest carbonate veins create areas where no fractures are mapped, but between theses veins, the granite is highly fractured. The observed fracture density is therefore very high (~79 850 frac/m²) with many fractures below millimetre lengths. On this map, the fractures orientation demonstrates, as in the maps 1 and 2 the symmetrical distribution of the orientation around the main orientation at N080°-090°E (Fig. 8b), and a length distribution following a power law with an exponent a= -1.72 from 5 mm to the 20 cm lengths.
5.2.2. Multiscale length distribution
The cumulative length distributions of each map from the CCR scale to Tamariu outcrop scale have been plotted in fig. 9a. Except of Tamariu outcrop scale map where the data form a curve that could be interpreted as an exponential law, all maps show a power law distribution outside the lengths with censoring or truncation effects. The traced lineaments on Tamariu map are ~10 m to ~100 m in length while the resolution of the satellite picture is 5 m (Place,
2010), and the width of the outcrop is often smaller than 50 m. The apparent exponential law
of the lineament population on this map could be the result of these sampling conditions.
The power-law exponent of the maps varies at each scale of observation: on the CCR and the Sant Feliu horst map it is quiet low, around a= -1.7, and progressively increase with the scale to around 2.0 for the Palafrugell area until 2.2-2.3 for Tamariu scale with the main fault and outcrop map (Fig. 9a). The cumulative fractures length of all maps has been plotted
M
ANUS
CR
IP
T
AC
CE
PTE
D
(Pickering at al., 1995). Over the whole data range, all power-law segments of the maps can be linked in a power-law extended on fractures between ~1 cm and ~100 km in length (Fig.
9b). This indicates that the fracture length distribution follows a power-law valid for all
fractures over approximately 7 orders of magnitude.
As the power-law is sufficiently clear, two length ranges are not represented (1-10 m and 100-1000 m). The first data gap is due to the absence of a map with a resolution capable of sampling the 1-10 m lengths fractures. Terrestrial LIDAR mapping or photographs with drones could help to resolve this lack of data. The second one is linked to the limited exposure along the coast of Tamariu which induces a large undersampling of the number of fractures ~N-S in orientation and of the fractures with ~E-W orientations longer than 50 m. The power-law is given with an exponent of ~2 for our 2D data, that implies their 2D representation is self-similar if the fractures and faults are assumed to have a random spatial distribution (Odling et al., 1999, Bour et al., 2002). In consequences, the probability of observing a fracture of the size of the sampling window is the same at all scales. Bour and Davy (1997) have shown that for this value of power law exponent and for a random distribution of orientations and positions, all fractures length classes have the same role on the connectivity of the fracture system.
6. Discussion
6.1.Representativeness of the maps
With our maps at almost all scale of observation between the seismic scale and the borehole scale, we have highlighted a length distribution following a power-law over 7 orders of magnitude. However the high density of small cracks visible on the map 1 to 3 should be not representative of the whole granitic rock, especially in non-fractured rock parts. This
M
ANUS
CR
IP
T
AC
CE
PTE
D
fracture density is scale dependent: the shortest fractures we can detect, higher is the apparent fracture density. For our maps, the fracture density ranges between 6601 frac/m2 for map 2
and 7208 frac/m2 for map 1, where the shorter lineaments measurement are around the
centimetre length, and 79 850 frac/m2 for map 3 with lower cut-off in lengths of millimetres,
i.e. one order of magnitude lower. These densities are similar to those obtained on fracture network analysis from outcrop down to microscopic scale,for example, Ortega and Marret (2000) studying microfractures in sandstones measured around 1.105 frac/m2 for fractures
millimetres in length by integrating fractures and cracks network analysis at outcrop and microscopic scale. Other studies, comparing microfractures and mesofractures using scan lines are also in agreement with this observation by showing extrapolated fracture densities around 103 - 104 frac/m for fractures studied at microscopic or core sample scales (Faulkner et
al., 2010; Guerriero et al., 2011; Pearce et al., 2011; Tagaki et al., 2012). Finally, Bonnet et
al. (2001) plotted the lower cut-offs of 45 fracture maps studies on natural data at various scales against the area of the maps and established a general trend of the lower cut-off limits of this type of fracture maps. For maps around the square meter of area, the typical lower cut-off is around the centimetre length as it is precisely the case on our maps 1 & 2 (Fig. 9). Theses observations are in agreement with the validity of our fracture tracing, and shows that the apparent density of our fracture are not uncommon in fractured rocks.
However, the high density of short fractures bring the question about the lower cut-off of the power-law, as a less fractured granite could have a significant lower fracture density that could reach the cut-off of the power law distribution to an higher length. As the authors know from the field, the Tamariu block 3 where the outcrop scale study has been made do not express a particularly high fracture density compared to the other blocks (Place, 2010). To test the influence of the variation of fracture densities on the length distribution, we have therefore sampled different parts of the map 2 and compare the length data in apparently low
M
ANUS
CR
IP
T
AC
CE
PTE
D
and high fracture density zones (Fig. 10). The northern part of the map is a highly fractured area with ~N090°E intersecting ~N070°E fractures and expose a total density of 8744 frac/m2.
The called middle part of the map exposes a more moderate fracture density with 6113 frac/m2. For the length distribution from these areas we can observe that the cumulative
number give a power-law with the same exponent of a= -1.96 and almost the same lower cut-off (Fig. 10). In consequence, the small change in fractures density on this map appears to have no influence on the lower cut-off of the length distribution. However, drawing fracture maps at the same scale in less fractured granite outcrops on the CCR should be interesting in order to better discus the lower cut-off of the length distribution.
6.2. Multiscale analysis
From the regional scale of the CCR to Tamariu outcrop scale, the maps and the scan lines show a heterogenous evolution in term of fault and fractures orientation. In fact, the fractures sets are consistent over the whole range of scales studied: the N060-070°E directions, marked by the bordering faults of the large scale horst and grabens structure, the ~N090°E that controls the third and fourth order blocks and Tamariu main structures, and the ~N140°E direction linked to the CTZ are found from the hundred kilometre length faults until the short centimetre cracks. However, theses orientations are not expressed with the same weight at each scale: At the first order scale, it is the N060-070°E that dominate the fault network, while there is an inversion with the ~N090°E set toward the second and the third order scale (Fig. 2). Between the fourth order scale and Tamariu block 3, there is a new inversion between these two fracture and fault sets (Fig. 3 & 5). The fault and fracture set originate from the CTZ is sometimes very important, like on the first order scale, and sometimes completely absent, like on the third order scale. Thus, as the orientation sets are consistent at
M
ANUS
CR
IP
T
AC
CE
PTE
D
the whole range of data, the expression of each set is highly dependant of the scale observation.
At the opposite, we have shown that the length distribution of the fault and fracture network can be modelled by a power-law with almost the same exponent from the centimetre to the hundred kilometre lengths. In a predictive sense, it means that we have in this case two kinds of parameters: scale dependant parameters like orientation that have to be modelled differently at each scale of observation, and scale independent parameters like the length distribution that can ben up or down scaled depending on the model resolution needed.
7. Conclusion
Tamariu outcrop and CCR basement offers the opportunity to study basement rock analogue of buried reservoirs in extensional context, with a complex structural heritage acquired since the Hercynian orogeny. In this paper, we have focused on the statistical analysis of faults and fractures, namely their length and orientation, on the largest range of scale possible. For that, we combined field observation and satellite imagery, with the combination of 1D measurement method with scan lines and 2D with maps.
1) We have demonstrated a power-law distribution of the faults and fractures length between 1 cm and 100 km, i.e. on approximately 7 orders of scales. The exponent a ≈ -2 of the law can be applied for the whole range of data.
2) Three main fault sets control the regional scale structure of the CCR: the ~N060°E horst and basin bordering faults, the ~N090°E hercynian herited faults and the ~N140°E faults linked to the CTZ. These orientations are the main orientation expressed from the regional
M
ANUS
CR
IP
T
AC
CE
PTE
D
3) As the same orientation dominate each scale of orientation, their relative proportion depends on the scale of observation. The ~N060°E faults are the main structure on the first and second order and at the outcrop scale, but at the third and fourth order scale it is the ~N090°E faults, and the ~N140°E faults density varies from very present at the first order scale to almost absent at other scales of observation.
4) In a predictive sense for modelling basement buried reservoirs, there is therefore two kinds of statistical parameter in our case: a length distribution in power-law with an exponent that can be considered as homogenous on the whole range of scale observation, and at the opposite the orientation that have to be considered independently at each scale.
Acknowledgments
We are grateful to Dr. Jonathan Long and Dr. Ekaterina A. Vsemirnova from the Geospatial Research Ltd, Durham University for their constructive comments on this paper. We also thank Mme Grenier Marie, UK for the English synthax and vocabulary correction. We want also to thank N. Odling for their valuable comments on the early version of the paper, and their constructive review with the second anonymous reviewer.
M
ANUS
CR
IP
T
AC
CE
PTE
D
Alsaker, E., Gabrielsen, R.H., Roca, E., 1996. The significance of the fracture pattern of the Late-Eocene Montserrat fan-delta, Catalan Coastal Ranges (NE Spain). Tectonophysics 266, 465-491.
Arthaud F., Matte Ph., 1975. Les décrochements tardi-hercyniens du Sud-Ouest de l’Europe, géométrie et essai de reconstitution des conditions de la déformation. Tectonophysics 25, 139-171.
Banda E., Santanach,P., 1992. The Valencia trough (western Mediterranean): An overview. Tectonophysics 208, 183-202.
Bartrina M.T., Cabrera L., Jurado M.J., Guimerà J., Roca E., 1992. Evolution of the central Catalan margin of the Valencia trough (western Mediterranean). Tectonophysics 203, 219– 247.
Beaumont C., Muñoz J.A., Hamilton J., Fullsack P., 2000. Factors controlling the Alpine evolution of the central Pyrenees inferred from a comparison of observations and geodynamical models. Journal of Geophysical Research 105 (B4), 8121-8145.
Bellot J.P., 2008. Hydrothermal fluids assisted crustal-scale strike-slip on the Argentat fault zone. Tectonophysics 450, 21–33.
Berg S.S., Øian E., 2007. Hierarchical approach for simulating fluid flow in normal fault zones. Petroleum Geoscience 13, 25-35.
Bixel F., 1987. Le volcanisme stéphano-permien des Pyrénées : Pétrographie, minéralogie, géochimie. Cuadernos Geología Ibérica 11, 41-55.
Bonnet E., Bour O., Odling N. E., Davy P., Main I., Cowie P., Berkowitz B., 2001. Scaling of fracture systems in geological media. Reviews of Geophysics 39, 347- 383.
Bour O., Davy P., 1997. Connectivity of random fault networks following a power law fault length distribution. Water Resources Research 33, 1567-1583.
M
ANUS
CR
IP
T
AC
CE
PTE
D
Bour O., Davy P., Darcel C., Odling N., 2002. A statistical scaling model for fracture network geometry, with validation on a multiscale mapping of a joint network (Hornelen Basin, Norway). Journal of Geophysical Research B: Solid Earth 107. doi:10.1029/2001JB000176. Cabrera L., Calvet F. 1996. E8 Onshore Neogene record in NE Spain: Vallès-Penedès and El-Camp half-grabens (NW Mediterranean). In: Tertiary basins of Spain: the stratigraphic record of crustal kinematics (edited by Friend, P. & Dabrio, C. J.). Cambridge University Press, Cambridge, UK, 97-105.
Caine J.S., Evans J.P., Forster C.B., 1996. Fault zone architecture and permeability structure. Geology 24, 1025-1028, doi: 10.1130/0091-7613.
Castaing C., Halawani M.A., Gervais F., Chilits J.P., Genter A., Bourgine B., Ouillon G., Brosse J.M., Martin P., Genna A., Janjou D., 1996. Scaling relationships in intraplate fracture systems related to Red Sea rifting. Tectonophysics 261, 291-314.
Cello G., Invernizzi C., Mazzoli S., 2001. Fault properties and fluid flow patterns from Quaternary faults in the Apennines, Italy. Tectonophysics 336, 63-78.
Cuong T.X., Warren J.K., 2009. Back Ho Filed, a fractured granitic basement reservoir, Cuu Long basin, offshore se Vietnam: A “buried-hill” play. Journal of Petroleum Geology 32, 129-156.
Davy P., Darcel C., Bour O., Munier R., et De Dreuzy J. R., 2006a. A note on the angular correction applied to fracture intensity profiles along drill core. Journal of Geophysical Research 111, B11408, doi:10.1029/2005JB004121.
Davy P., Bour O., De Dreuzy J.R., Darcel C., 2006b. Flow in multiscale fractal fracture networks. In: Cello G., Malamud B.D., (Eds.). Fractal Analysis for Natural Hazards. Geological Society, London, Special Publications, vol. 261, 31-45.
M
ANUS
CR
IP
T
AC
CE
PTE
D
De Dreuzy J.R., Davy P., Bour O., 2001a. Hydraulic proprieties of two-dimensional random fracture networks following a power law length distribution 1. Effective connectivity. Water Resources Research 37, 2065-2078.
De Dreuzy J.R., Davy P., Bour O., 2001b. Hydraulic proprieties of two-dimensional random fracture networks following a power law length distribution 2. Permeability of networks based on lognormal distribution of apertures. Water Resources Research 37, 2079-2095.
De Dreuzy J.R., Davy P., Bour O., 2002. Hydraulic properties of two-dimensional random fracture networks following power law distributions of length and aperture. Water Resources Research 38, 12, doi:10.1029/2001WR001009.
De Dreuzy J.R., Darcel C., Davy P., Bour O., 2004. Influence of spatial correlation of fracture centers on the permeability of two-dimensional fracture networks following a power law length distribution. Water Resources Research 40, W01502, doi:10.1029/2003WR002260.
Diez J.B., Bourquin S., Broutin J., Ferrer J., 2007. The iberian permian triassic ‘Buntsandstein’ of the Aragonian branch of the Iberian range (Spain) in the West-European sequence stratigraphical framework: a combined palynological and sedimentological approach. Bulletin de la Société Géologique de France 178, 179-195.
Ehlen J., 2000. Fractal analysis of joint patterns in granite. International Journal of Rock Mechanics and Mining Sciences 37, 909-922.
Enrique P., 1990. The Hercynian intrusive rocks of the Catalonian Coastal Ranges (NE Spain). Acta Geologica Hispanica 25, 39-64.
Escuder Viruete J., Carbonell R.., Jurado M.J., Martí D., Pérez-Estaún A., 2001. Two dimensional geostatistical modeling and prediction of fracture system in the Albala granitic pluton, SW Iberian massif, Spain. Journal of Structural Geology 23, 2011-2023.
M
ANUS
CR
IP
T
AC
CE
PTE
D
Fagerend A., 2011. Fractal vein distributions within a fault-fracture mesh in an exhumed accretionary mélange, Chrystalls Beach Complex, New Zealand. Journal of Structural Geology 33, 918-927.
Faulkner D.R., Jackson C.A.L., Lunn R.J., Schlische R.W., Shipton Z.K., Wibberley C.A.J., Withjack M.O., 2010. A review of recent developments concerning the structure, mechanics and fluid flow properties of fault zones. Journal of Structural Geology 32, 1557-1575.
Ferrés-Hernàndez M., 1998. Le complexe granitique alcalin du massif de Cadiretes (Chaînes Côtières Catalanes, NE de l’Espagne): étude pétrologique et géochronologique 40Ar/39Ar et
Rb-Sr. In : PhD. Thesis, University of Geneva, Switzerland, 198 pp.
Fontboté F.M., Guimerà J., Roca E., Sàbat F., Santanach P., Fernandez-Ortigosa F., 1990. The Cenozoic geodynamic evolution of the València trough (Western Mediterranean). Rev. Soc. Geol. Espana 3, 249-259.
Forster C.B., Caine J.S., Schultz S., Nielson D.L., 1997. Fault zone architecture and fluid flow an example from Dixie Valley, Nevada. Proceedings, Twenty-second Workshop on Geothermal Reservoir Engineering Stanford University, Stanford, California, 27-29.
Genter A. and Castaing C., 1997. Effets d’échelle dans la fracturation des granites. Tectonics 325, 439-445.
Géraud Y., Diraison M., Orellana N., 2006. Fault zone geometry of a mature active normal fault: A potential high permeability channel (Pirgaki fault, Corinth rift, Greece). Tectonophysics 426, 61–76.
Géraud Y., Rosener M., Surma F., Place J., Le Garzic E., Diraison M., 2010. Physical properties of fault zones within a granite body: Example of the Soultz-sous-Forêts geothermal site. Comptes Rendus Geoscience 242, 566-574.
M
ANUS
CR
IP
T
AC
CE
PTE
D
Gillespie P.A., Howard C.B., Walsh J.J., Watterson J., 1993. Measurement and characterisation of spatial distributions of fractures. Tectonophysics 226, 113-141.
Gillespie P.A., Walsh J.J., Watterson J., Bonson C.G., Manzocchi T., 2001. Scaling relationships of joint and vein arrays from The Burren, Co. Clare, Ireland. Journal of Structural Geology 23, 183-201.
Googman, R.E., 1976. Methods of Geological Engineering in Discontinuous Rocks, West Publishing Co., New York, 472pp.
Goula X., Olivera C., Fleta J., Grellet B., Lindo R., Rivera L.A., Cisternas A., Carbon D., 1999. Present and recent stress regime in the eastern part of the Pyrenees. Tectonophysics 308, 487–502.
Guerriero V., Iannace A., Mazzoli S., Parente M., Vitale S., Giorgioni M., 2010. Quantifying uncertainties in multi-scale studies of fractured reservoir analogues: Implemented statistical analysis of scan line data from carbonate rocks. Journal of Structural Geology 32, 1271–1278.
Guerriero V., Vitale S., Ciarcia S., Mazzoli S., 2011. Improved statistical multi-scale analysis of fractured reservoir analogues. Tectonophysics 504, 14–24.
Guimerà J., 1994. Cenozoic evolution of eastern Iberia: Structural data and dynamic model. Acta Geologica Hispanica 29, 57-66.
Heffer, K.J., Bevan, T.G., 1990. Scaling relationships in natural fractures: data, theory, and application. European Petroleum Conference, 21-24 October 1990, The Hague, Netherlands
Juez-Larré J., Andriessen P.A.M., 2006. Tectonothermal evolution of the northeastern margin of Iberia since the break-up of Pangea to present, revealed by low-temperature fission-track
M
ANUS
CR
IP
T
AC
CE
PTE
D
and (U–Th)/He thermochronology A case history of the Catalan Coastal Ranges. Earth and Planetary Science Letters 243, 159-180.
Julivert M., Durán H., 1990. The hercynian structure of the Catalonian Coastal Ranges (NE Spain). Acta Geologica Hispanica 25, 13-21.
Kim Y-S., Sanderson D.J., 2005. The relationship between displacement and length of faults : a review. Earth-Science Reviews 68, 317-334.
Le Garzic E., 2010. Distribution multi-échelle de la fracturation dans les réservoirs cristallins, influence de l’héritage structural. In : PhD thesis. University of Strasbourg, France, 268 pp.
Le Garzic E., De L’Hamaide T., Diraison M., Géraud Y., Sausse J., De Urreiztieta M., Hauville B., Champanhet J.M., 2011. Scaling and geometric properties of extensional fracture systems in the proterozoic basement of Yemen. Tectonic interpretation and fluid flow implications. Journal of Structural Geology 33, 519-536.
Lewis C.J., Vergés J., Marzo M., 2000. High mountains in a zone of extended crust: Insights into the Neogene-Quaternary topographic development of Northeastern Iberia. Tectonics 19, 86-102.
Long J.C.S., Witherspoon P.A., 1985. The relationship of degree of interconnection to permeability in fracture networks. Journal of Geophysical Research 90 (B4), 3087-3098.
Luthi S.M., 2005. Fractured reservoir analysis using modern geophysical well techniques: application to basement reservoirs in Vietnam. In: Harvey P.K., Brewer T.S., Pezard P.A., Petrov V.A., (Eds.) 2005. Petrophysical properties of crystalline rocks. Geological Society, London, Special Publications 240, 95-106.
M
ANUS
CR
IP
T
AC
CE
PTE
D
Maillard A., Mauffret A., Watts A.B., Torné M., Pascal G., Buhl P., Pinet B., 1992. Tertiary sedimentary history and structure of the Valencia trough (western Mediterranean). Tectonophysics 203, 57-75.
Manda A.K., Mabee S.B., Wise D.U., 2008. Influence of rock fabric on fracture attribute distribution and implications for groundwater flow in the Nashoba Terrane, eastern Massachusetts. Journal of Structural Geology 30, 464-477.
Manzocchi T., Walsh J.J., Bailey W.R., 2009. Population scaling biases in map samples of power-law fault systems. Journal of Structural Geology 31, 1612–1626.
Mapa geològic comarcal de Catalunya 1:50 000. 2005-2009. Institut Geològic de Catalunya.
Mapa geològic de Catalunya 1:250 000. Second edition, 2002. Institut Geològic de Catalunya.
Marques J.M., Matias M.J., Basto M.J., Carreira P.M., Aires-Barros L.A., Goff F.E., 2010. Hydrothermal alteration of Hercynian granites, its significance to the evolution of geothermal systems in granitic rocks. Geothermics 39, 152-160.
Marrett R., Ortega O.J., Kelsey C.M., 1999. Extent of power-law scaling for natural fractures in rock. Geology 27, 799-802.
Mauffret A., Pascal G., Maillard A., Gorini C., 1995. Tectonics and deep structure of the north-western Mediterranean Basin. Marine and Petroleum Geology 12, 645-666.
McCaffrey K.J.W., Sleight J.M., Pugliese S., Holdsworth R.E., 2003. Fracture formation and evolution in crystalline rocks: Insights from attribute analysis. In: Petford N., McCaffrey K.J.W., (Eds.). Hydrocarbons in crystalline Rocks. Geological Society, London, Special Publications 214, 109-124.
M
ANUS
CR
IP
T
AC
CE
PTE
D
Nelson R.A., 2001. Geological analysis of naturally fractured reservoirs. Second Edition. Gulf Professional Publishing. 332pp.
Odling N.E., 1997. Scaling and connectivity of joint systems in sandstones from western Norway. Journal of Structural Geology 19, 1257-1271.
Odling N. E., Gillespie P., Bourgine B., Castaing C., Chiles J. P., Christensen N. P., Fillion E., Genter A., Olsen C., Thrane L., Trice R., Aarseth E., Walsh J. J., Watterson J., 1999. Variations in fracture system geometry and their implications for fluid flow in fractured hydrocarbon reservoirs. Petroleum Geoscience 5, 373-384.
Ortega O., et Marret R., 2000. Prediction of macrofracture properties using microfracture information, Mesaverde Group sandstones, San Juan basin, New Mexico. Journal of Structural Geology 22, 571-588.
Parcerisa D., Gómez-Gras D., Roca E., Madurell J., Agustí, J., 2007. The Upper Oligocene of Montgat (Catalan Coastal Ranges, Spain): new constraints to the age of the opening of the western Mediterranean. Geologica Acta 5, 1-15.
Peacock D.C.P., Harris S.D., Mauldon M., 2003. Use of curved scanlines and boreholes to predict fracture frequencies. Journal of Structural Geology 25, 109-119.
Pearce M.A., Jones R.R., Smith S.A.F, McCaffrey K.J.W., 2011. Quantification of fold curvature and fracturing using terrestrial laser scanning. AAPG Bulletin 95, no. 5, 771–794.
Pickering G., Bull J.M., Sanderson D.J., 1995. Sampling power-law distributions. Tectonophysics 248, 1-20.
Place J., 2010. Caractérisation des chemins de circulations de fluides dans le réseau poreux d’un batholite granitique. In: PhD Thesis, University of Strasbourg, France, 360 pp.
M
ANUS
CR
IP
T
AC
CE
PTE
D
Pous J., Solé Sugrañes L., Badiella P., 1990. Estudio geoeléctrico de la depresión de la Selva (Girona). Acta Geologica Hispanica 25, 261-369.
Putz-Perrier M.W., Sanderson D.J., 2010. Distribution of faults and extensional strain in fractured carbonates of the North Malta Graben. The American Association of Petroleum Geologists Bulletin 94, 435–456, doi:10.1306/08260909063
Rempe, N.T., 2007. Permanent underground repositories for radioactive waste, Prog. Nucl.
Energ., 49, 365–374, doi:10.1016/j.pnucene.2007.04.002
Riley P., Tikoff B., Murray A.B., 2011. Quantification of fracture networks in non-layered, massive rock using synthetic and natural data sets. Tectonophysics 505, 44–56.
Roca E. and Guimerà J., 1992. The Neogene structure of the eastern Iberian margin: structural constraints on the crustal evolution of the Valencia trough (western Mediterranean). Tectonophysics 203, 203 – 218.
Roca E., Sans M., Cabrera L., Marzo M., 1999. Oligocene to Middle Miocene evolution of the central Catalan margin (Northwestern Mediterranean). Tectonophysics 315, 209–233.
Salas R. and Casas A., 1993. Mesozoic extensional tectonics, stratigraphy and crustal evolution during the Alpine cycle of the eastern Iberian basin. Tectonophysics 228, 33-55.
Séranne M., Benedicto A., Labaume P., Truffert C., Pascal G., 1995. Structural style and evolution of the Gulf of Lion Oligo-Miocene rifting: role of the Pyrenean orogeny. Marine and Petroleum Geology 12, 809-820.
Séranne M., 1999. The Gulf of Lion continental margin (NW Mediterranean) revisited by IBS: an overview. In: Durand B., Jolivet L., Horvàrth F., Séranne M., (Eds.) 1999. The Mediterranean Basins: Tertiary extension within the Alpine Orogen. Geological Society, London, Special Publications 156, 15-36.
M
ANUS
CR
IP
T
AC
CE
PTE
D
Solé J., Cosca M., Sharp Z., Enrique P., 2002. 40Ar/39Ar Geochronology and stable isotope geochemistry of late-hercynian intrusions from north-eastern Iberia with implications for argon loss in K-feldspar. International Journal of Earth Sciences 91, 27.223-27.237.
Soliva R., Schultz R.A., Benedicto A., 2005. Three-dimensional displacement-length scaling and maximum dimension of normal faults in layered rocks. Geophysical Research Letters 32, L16302.
Stampfli G.M., Borel G.D., Marchant R., Mosar, J., 2002. Western Alps geological constraints on western Tethyan reconstructions. Journal of the Virtual Explorer 7, 75-104.
Takagi H., Takahashi K., Shimada K., Tsutsui K., Miura R., Kato N., Takizawa S., 2012. Integrated estimates of the thickness of the fault damage zone in granitic terrain based on penetrative mesocracks and XRD analyses of quartz.
Tassone A., Roca E., Muñoz J.A., Cabrera L., Canals M., 1994. Evolución del sector septentrional del margen catalán durante el Cenozoico. Acta Geologica Hispanica 29, 3-37.
Terzaghi R. D., 1965. Sources of errors in joint surveys. Geotechnique 15, 287–304.
Vergés J., Fernàndez M., Martìnez, A., 2002. The Pyrenean orogen: pre-, syn-, and post-collisional evolution. Journal of the Virtual Explorer 8, 55-74.
Watts A.B., Torné M., 1992. Subsidence History, Crustal Structure, and Thermal Evolution of the Valencia Trough: A Young Extensional Basin in the Western Mediterranean. Journal of Geophysical research 97 (B13), 20,021-20,041.
Yielding G., Walsh J., Watterson J., 1992. The prediction of small-scale faulting in reservoirs. First Break 10, 12.
M
ANUS
CR
IP
T
AC
CE
PTE
D
Zimmermann G., Burkhardt H., Engelhard L., 2005. Scale dependence of hydraulic and structural parameters in fractured rock, from borehole data (KTB and HSDP). In: Harvey P.K., Brewer T.S., Pezard P.A., Petrov V.A., (Eds.) 2005. Petrophysical properties of crystalline rocks. Geological Society, London, Special Publications 240, 37-45.
Zygouri V., Verroios S., Kokkalas S., Xypolias P., Koukouvelas I.K., 2008. Scaling properties within the Gulf of Corinth, Greece; comparison between offshore and onshore active faults. Tectonophysics 453, 193–210.
M
ANUS
CR
IP
T
AC
CE
PTE
D
Figures:Figure 1: a) Simplified map of the NW Mediterranean Sea. The dotted areas represent the Alpine domains and the grey areas represent the sediments in the main basins of the West European rift (Séranne, 1999). b) Structural map of the CCR separating the northern and southern sectors (by Roca
et al. 1999). c) Geological map with the localization of Palafrugell area and the Tamariu outcrop (Cartographic Institute of Catalonia – Mapa geològic de Catalunya 1:250 000).
M
ANUS
CR
IP
T
AC
CE
PTE
D
Figure 2: Fault traces and orientation diagram by Le Garzic (2010) on: a) the general map of the Catalonian margin, b) the Catalonian Coastal Ranges on DTM data, c) and d) Faults on Sant Feliu
M
ANUS
CR
IP
T
AC
CE
PTE
D
Figure 3: Fault traces and orientation diagram by Place (2010) on: a) Palafrugell area map, b) Main faults on Tamariu outcrop, c) fracture traces mapped on high resolution satellite picture.
M
ANUS
CR
IP
T
AC
CE
PTE
D
Figure 4: a) Map of the studied area with the major fractures, the localization of the scan lines, the maps and the samples, b) View of one of the scan lines (SL1, Fig. 4a), c) View of the sector where a fracture map was carried out (2, Fig. 4a), d) zoom on the rock explaining the fracture map building.
M
ANUS
CR
IP
T
AC
CE
PTE
D
Figure 5: Distribution of the fractures orientation, density and length on the 3 scan lines made on the Tamariu outcrop, a) SL1, b) SL2 and c) SL3. The “lake of data” area corresponds to the zone within
M
ANUS
CR
IP
T
AC
CE
PTE
D
Figure 6: Fractures map 1 from the outcrop Photos: a) raw and fracture map map, b) orientation distribution of the fractures, c) length distribution.
M
ANUS
CR
IP
T
AC
CE
PTE
D
Figure 7: Fractures map 2 from the outcrop Photos: a) raw and fracture map, b) orientation distribution of the fractures, c) length distribution.
M
ANUS
CR
IP
T
AC
CE
PTE
D
Figure 8: Fractures map 1 from hand sample: a) raw and fracture map, b) orientation distribution of the fractures, c) length distribution.
M
ANUS
CR
IP
T
AC
CE
PTE
D
Figure 9: a) Fractures length distribution of each map from the CCR scale to the Tamariu outcrop scale, b) comparison between our data, Tamariu entire outcrop data and the regional data of the
Catalonian Coastal Ranges. Each plot corresponds to the entire data set on each map without separating the different fracture sets. The correlation line has been fitted to the different data set
M
ANUS
CR
IP
T
AC
CE
PTE
D
Figure 10: Comparison of the length distribution between a highly fractured (Northern part) and moderately fractured (Midle part) area.
Table 1: Table characteristics of the different data sets. The orientations of the maps correspond to the vertical direction on the corresponding figures.
Nb of fractures Length/area Orientation
SL1 673 30 m N000°E SL2 337 7,33 m N150°E SL3 93 7,7 m N060°E Map 1 10 380 1,2 by 1,2 m N128°E Map 2 19 011 2,4 by 1,2 m N150°E Map 3 1 597 0,2 by 0,1 m N166°E
M
ANUS
CR
IP
T
AC
CE
PTE
D
Highlights :- Statistical analysis of faults and fractures from regional to centimetre scale
- Length distribution following a power law over 7 orders of magnitude
- Combinaison of 1D measurement methods (scan lines) and 2D (maps)