HAL Id: insu-03117580
https://hal-insu.archives-ouvertes.fr/insu-03117580
Submitted on 26 Apr 2021
HAL is a multi-disciplinary open access
archive for the deposit and dissemination of
sci-entific research documents, whether they are
pub-lished or not. The documents may come from
teaching and research institutions in France or
abroad, or from public or private research centers.
L’archive ouverte pluridisciplinaire HAL, est
destinée au dépôt et à la diffusion de documents
scientifiques de niveau recherche, publiés ou non,
émanant des établissements d’enseignement et de
recherche français ou étrangers, des laboratoires
publics ou privés.
Mid-latitude lidar observations of planetary waves in the
middle atmosphere during the winter of 1981–1982
Alain Hauchecorne, Marie-Lise Chanin
To cite this version:
Alain Hauchecorne, Marie-Lise Chanin. Mid-latitude lidar observations of planetary waves in the
middle atmosphere during the winter of 1981–1982. Journal of Geophysical Research. Oceans,
Wiley-Blackwell, 1983, 88 (C6), pp.3843-3850. �10.1029/JC088iC06p03843�. �insu-03117580�
JOURNAL OF GEOPHYSICAL RESEARCH, VOL. 88, NO. C6, PAGES 3843-3849, APRIL 20, 1983
MID-LATITUDE LIDAR OBSERVATIONS OF PLANETARY WAVES IN THE MIDDLE ATMOSPHERE DURING TH• WINTER OF 1981-1982
A. Hauchecorne and M. L. Chanin
Service d'A•ronomie du C.N.R.S., B.P. 3, 91170, Verri•res-Le-Buisson, France
Abstract. A quasi-continuous survey of the Experimental Results
stratospheric and mesospheric temperature was
performed, between June 1981 and April 1982, The main characteristics of the lidar
using the lidar station of the Observatory of measurements reported here are, on the one hand,
Haute-Provence (44øN, 6øE). During the period of the fact that they are performed locally above
easterly winds in the lower stratosphere (i.e., the station (with a fixed zenith pointing) and,
from June to September), the variability of the on the other hand, that they cover with a good
temperature is observed to be very low. As long height resolution and a very accurate altitude
as prevailing winds are westerlies, from October definition the range from 30 to 80 km, which is
to March, temperature profiles are continuously not not covered by radiosondes, and measured with
perturbed by planetary waves, with a maximum of a degraded resolution by satellites. Then the
amplitude in January 1982, before the 'strong events that will be referred to will be obviously
minor warning' of the winter. Spectral analysis local, unless mentioned otherwise.
of the data indicates the presence of a well- The temperature profiles have been integra-
defined 18-day wave interpreted as a free Rossby ted for each night during the whole period of
wave and the existence of large perturbations measurements, that is, during 2 to 10 hours
with periods of 25 to 40 days which are depending on weather conditions. The vertical
tentatively explained as a succession of minor resolution is 0.6 km on the rough data but has
upper stratospheric warmings due to the been degraded to 4.8 km to improve the
interference of the 18 day traveling Rossby wave temperature accuracy. Furthermore, this choice of
and a stationary wave. temporal and spatial resolutions helps to remove
short period fluctuations and short vertical
Introduction wavelength structures induced by gravity waves
[Chanin and Hauchecorne, 1981].
Ground-based lidar measurements of strato- Seven temperature profiles obtained between
spheric and mesospheric density and temperature September 1981 and April 1982 and representative
have been performed since 1978 at the Observatory of typical situations are presented in Figure 1.
of Haute-Provence (44"N, 6"E). The density is For each experimental profile are indicated the
obtained above 30 km from the light of a pulsed ñ1 standard deviation and the Cira (1972) model
laser beam backscattered by air molecules, and for the appropriate month and latitude (44"N).
the temperature is deduced from the density The profile of September 13 (night of September
measurements assuming that the atmosphere obeys 13-14) is typical of the summer period. It is
the ideal gas law and is in hydrostatic very close to the Cira (1972) model and does not
equilibrium, which are standard assumptions present any large perturbation. On November 22
[Hauchecorne and Chanin, 1980]. During the period the perturbation of the profile by planetary
of the two major warmings of the winters 1979- waves is clearly visible, with a cooling of about
1980 and 1980-1981 [Labitzke, 1982], lidar 10 K between 50 and 60 km and a secondary maximum
profiles showed clearly a stratospheric warming of temperature at 74 km. The four profiles of
and an associated mesospheric cooling. January 1982 have been obtained during the more
[Hauchecorne and Chanin, 1981, 1982]. This may be disturbed period of the winter, just before the
surprising, considering the relatively low 'strong minor warming' of the lower stratosphere
latitude of the lidar station, but it should be occurring at the end of January [Naujokat et al.,
noticed that because of its longitude the station 1982]. A definite warming becomes noticeable near
is only 25 • to 30 ø south of the average position 50 km on January 2, then increases and moves
of the center of the polar depression. During the downward to reach a maximum value of 30 K above
winter of 1980-1981, a variation of the tempe- the Cira model at 40 km on January 13. During the
rature profile with a period of about 20 days was same period a strong mesospheric cooling descends
observed and was attributed by the authors to the from 70 to 58 km. A minimum value (45 K below the
propagation of planetary waves. To study these Cira) is observed at 62 km on January 6.
planetary waves, a quasi-continuous survey of the The perturbation of these three profiles is
nighttime temperature profile has been performed characterized by a vertical wavelength of about
from June 1981 to April 1982. In this paper, the 40 km. This vertical structure is visible both on
series of 82 profiles obtained during this period the density and on the temperature profiles as it
is used to study the local temperature variations is shown on Figure 2 for January 2, 1982. Such
and their interpretation in terms of planetary vertical wavelengths of about 40-50 km, have
waves propagation. already been observed in the winter of 1975-1976
[Offermann et al., 1979] and of 1980-1981
[Hauchecorne and Chanin, 1982]; they seem to be a
Copyright 1983 by the American Geophysical Union. general feature of the disturbed winter profiles.
Owing to these structures the vertical tempera-
Paper number 2C1985. ture gradient may reach a mean value of -7 K
0148-0227/83/002C-1985505.00
km
-1 from 50 to 60 km when the upper strato-
3844 Hauchecorne and Cbmnin: Lidar-Observed Planetary Waves •70 /s
•,•.,..
œ1RA
1072
•
,,
5EP NOVEMBER
170 100 210 230 250 270 " 210 230 250 2?0 100 Z10 230 250 2?0 200 TEMPERATURE OK • J ",, ! " ! ,, I , , , I , , , • , ß ß • ... h' , !•.,•T•, , • , , . • , ,fl, . • , , ,/•.,,."•'•,, • , , , • , ,•, • , ,•J4 . , , , , , , • ,30
210 230 250 2?0
•10 230 250 2'70
'/! 210 230 250 2?0
:" 210 230 250 2?0
TEMPERATURE eKFig. 1. Series of 7 L:i. dar temperature profiles obtained from September 1981 to April
1982. The dotted liDe represents the Cira (1972) model for the corresponding month and latitude. The standard deviation (_+(•) is indicated.
sphere is warm and the mesosphere cold. Then, if used to study the temporal variation of the
gravity waves are present, the temperature stratospheric and mesospheric temperature during
gradient may be locally amplified up to the these 10 months. The quality and the density of
adiabatic gradient of -9.8 K km
-1, and unstable
data is not homogenous
during that period. To
layers with subsequent turbulent dissipation may obtain a continuous determination of the tempera-
then appear in the lower mesosphere. ture and to eliminate possible fluctuations due
On January 22 the warming has moved down to the variations in the data accuracy, the
into the lower stratosphere and is not visible on temperature at each height level has been
the lidar data but appears at the end of January approximated and interpolated by use of spline
on the radiosonde data both locally and globally, functions with a mean least square criterion
as we will see later. The temperature profile is proportional to the standard error of each of the
near isothermal from 30 to 80 km with a very cold temperature measurements. Temperature profiles
stratopause about 20 K colder than its mean have been extended below 30 km, using the
value. The profile of April 9, 1982, shows the radiosonde data of the two nearby stations of
return to a summer quiet situation without any NSmes (44øN, 4øE) and Lyon (46•N, 5OE).
perturbation induced by planetary waves but with The time-height section of the temperature
a stratosphere colder than indicated by the Cira from 20 to 70 km is represented on Figure 3
model. together with the mean zonal wind from 0 to 30 km
The complete series of temperature profiles obtained from the data of the same two radiosonde
obtained from June 1981 to April 1982 has been stations. During summertime, from June to
g0 km 80
I
0.8 1.0 1'.2 -20 0 +20
Density/CIRA?2 TEMPERATURE - CIRA72
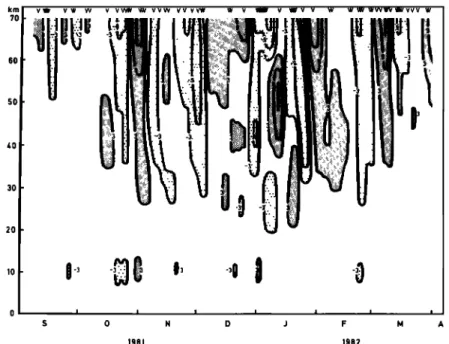
September 1981,the temperature isopleths are
nearly horizontal, corresponding to very little
time variation in the temperature profiles.
During that period, easterly winds are present in
the lower stratosphere, a situation that prevents
the propagation of planetary waves into the
stratosphere [Charhey and Drazin, 1961]. At the
beginning of October the change over from
easterly to westerly winds occurs in the lower
stratosphere. The planetary waves may then
propagate into the middle atmosphere, and a
succession of large perturbations in the
temperature profiles appears in the upper strato-
sphere and in the mesosphere. The maximum
amplitude of these perturbations is observed in
January after a period of strong westerly winds
Fig. 2. Density and temperature profiles for the and just 'before the 'strong minor warming' of
night of January 2-3, 1982, compared with the this winter. In February and March the zonal wind
Cira (1972) model. The standard deviation is is locally easterly or moderately westerly and
Hauchecorne and Chanin: Lidar-Observed Planetary Waves 3845 km • v • vv v.w v w v w W v vvw w vvw vv VVW W V • V •W/V V W W •W/•/VWV •A/VV • V V
I
'::'
0 •,o
25 0 230• 0 I I I I I I I I I " J J A S 0 N D J F M A 1981 1982Fig. 3. (Top): Time height section of Lidar and radiosonde temperature •K). The
contour lines are plotted in steps of 10 K. The arrows above indicate the days when
Lidar data were recorded. Shaded areas correspond to temperatures above 260 K, dotted
areas to temperatures below 220 K. (Bottom): time height section of the radiosonde
zonal wind (m s -1) Westerly winds are >0 and represented by the shaded area;
easterly winds are •0 and represented by dotted area. Contour lines are plotted by
steps of 20 m s -1.
km 40 30 I I I I i I i S O N D J F M A1981
,•
1982
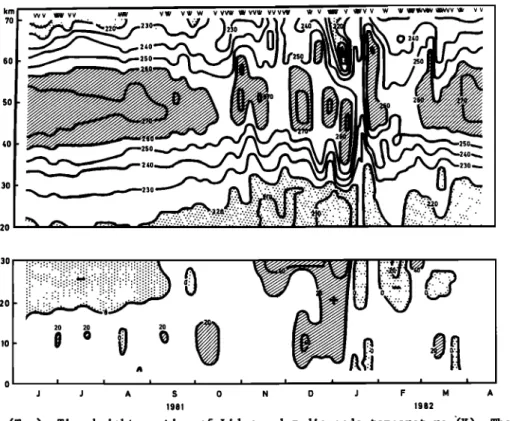
Fig. 4. Time-height section of the temperature deviation from a 45 days running
average. Contour lines are plotted in steps of 10 K. Gray areas correspond to a
warming. Dotted areas represent a cooling from the average value. The large arrow indicates the time of the strong minor warming.
3846 Hauchecorne and Chanin: Lidar-Observed Planetary Waves km 7O 6O 5O /,0 30 DAY 50 30 20 •5 10 ! i i i I 0 I I I I I O .O2 ,O/• .06 .08 .IO
DAY .I
Fig. 5. Frequency-height section of the
• 6O 3O i i [ I - I?S
I
'
_ 0 90 180 270 PHASEFig. 6. Phase % of the temperature oscillation
T(f,t) as a function of height, defined as
T(f,t) = T o (f) cos [2•f(t-to)-%] for the three
frequencies f = 0.025 day
-1 (period 40 days),
f = 0.040 day
-1 (25 days) and f = 0.055 day
-1
(period 18 days). The origin of time to is set on
September 12, 1981. A negative slope indicates a
downward propagation of the phase. The period of analysis is the same as in Fig.5.
periodicities. Figure 5 presents the frequency-
height section of the amplitude of the tempera-
ture oscillations. In the stratosphere, three
main periods are observed: 18 days, 25 to 29
amplitude of the temperature oscillations (in days, and 40 days (herein 18D, 25D, and 40D
K/0.005 day -1) during the period from September
respectively), with a maximum
amplitude near 35-
13, 1981, to March 31, 1982. Contour lines are 40 km for these three periods. It should be
plotted in steps of 0.75K/(0.005 day -1).
noticed that the stratopause level corresponds
to
a minimum of amplitude of the temperature varia-
tions. In the mesosphere, near 60-65 km, the 18D
return to the quiet summer situation is observed is still present, but the two longer periods have
at the beginning of April. merged to produce a broad maximum. The maximum
amplitudes occur for the 18D in the stratosphere
Data analysis and for the 25 to 40 day periods in the meso-
sphere. The phase of the 18D, as defined in
Time analysis of the experimentally observed Figure 6, is nearly constant with altitude, while
temperature disturbances has been performed by The phase change of the 25D and 40D indicates a
two complementary analysis. The same type of
treatment has also been applied to the pressure
values deduced from the density profiles:
1. Temperature : To study the characte-
ristics of the temperature perturbation, the
difference between the daily temperature and the
mean temperature has been considered. This mean
temperature is obtained by applying to the data
obtained for each night of observation a running
average with a triangular filter of 45 days half
width. These temperature deviations from the mean
value are presented in Figure 4 for the period of
September 1981 to April 1982. From this represen-
tation it appears that a regular succession of
coolings and warmings is observed in both the
stratosphere and the mesosphere. Furthermore,
each warming is associated with a cooling
occurring about 20 km above or below. This
corresponds to the 40 km vertical wavelength
already mentioned. Such vertical structures are
responsible for the anticorrelation observed in
the temperature variation between the upper
stratosphere and the lower mesosphere. The
periodic variation of these structures does not
appear to be due to the propagation of a single planetary wave. i i i i i i i _
,,'-x
/"q
- 35 km i i i i i i i K Z0 10 0 -10 -Z0 -30 30 K Z0 10 0 -10 - S 0 N D J F M 1981 1982Fig. 7. Deviation from the mean temperature
A spectral Fourier analysis of the tempera- measured at 35 and 60 km. The arrows indicate the
ture data has been performed on the data from dates of the maximum of the 18D wave computed
Hauchecorne and Chanin: Lidar-Observed Planetary Waves 3847 km v• v w w v vv,•, w• vvw vv vvw w v • v •/ v v w w • wvvwvw#vvv w :'"! ':::. •i•=•i•,ii•i,!i '.:.:'.::': .|i'i ::'.•.'• i •, 40 20 0 I I I I S 0 N D J F M A 1981 1982
Fig. 8. As in Figure 4 except for the relative difference in percent between the
measured pressure and a 45-day running averaged pressure. Contour lines are plotted
in steps of 6%.
downward propagation. The 18D is probably the mesosphere so their contributions to the pressure
same as the 16-day traveling wave observed by perturbations are, if not canceled, at least
Madden and Labitzke [1981] and attributed by them decreased. Thus, the quasi vertical structure
to the H• Hough
mode
of a free Rossby
wave. As
observed
in the pressure perturbations is easily
expected from theoretical considerations, its understood.
phase is observed to be constant with height. A spectral Fourier analysis of the pressure
This 18D wave is present in the stratosphere variation confirms the prevailing role of the 18D
during the whole 6 month period from September
1981 to April 1982. At 35 km (Figure 7) it is
possible to observe each maximum of that wave,
except at the end of January, while the strongest warming of the winter is going on. At 60 km, the
18D wave is observed most of the time. On the
other hand, the two longer periods are not
observed simultanelously, as it can be seen near
60 km where they dominate the temperature varia- tions. The seven successive maxima of temperature occurring from September 25 to March 31 are sepa- rated by 38, 25, 27, 36, 35, and 26 days, respec-
tively. Three of these periods are near 25-27
days, and the three others near 35-40 days. The
succession of these two periods broadens the
temporal spectrum and explains the merging of the
25D and 40D in the mesosphere.
2. Pressure. From the radiosonde profiles
that extend up to 30 km and from the lidar
density profiles from 30 to 70 km, it is possible
to trace the pressure behavior up to 70 km. The
deviation of the average daily pressure from the
45 days running average pressure has been evalua-
ted for the period under study (Figure 8). The
regular succession of low and high pressures
appears clearly above 25 km with a dominant 18D
period and a quasi vertical structure. These
features are explained by the fact that the phase
of the 18D temperature wave is constant with
altitude, giving a cumulative effect of the
km DAY 50 30 20 15 i i i i 0 I i
o
.o',
.,o
_1 DAYtemperature perturbations on the pressure Fig. 9. As in Figure 5 except for the amplitude of
perturbations at all levels. On the other hand,
the pressure oscillation
(in percent /0.005
day
-1).
the 25D and 40D temperature oscillations are out Contour lines are plotted in steps of 0.5 % /0.005
3848 Hauchecorne and Chanin: Lidar-Observed Planetary Waves i ! - ,•0d ,, \x !
/
(
%-
• .../'
- ? \ i90
90
PHASEindicate the existence of a single variable
period. Owing to the large amplitudes associated
with these long periods in the mesosphere and to
their phase change between the mesosphere and the
stratosphere, six main sequences, presenting
locally the characteristics of minor warmings,
are observed during the winter.
With the usual definition of a 'major
warming' [Labitzke, 1982] this specific winter
(1981-1982) presented only one 'strong minor
warming' at the end of January. As seen by the
Lidar, locally at 44'N, 6*E, six warmings are
observed and among them is one of major
importance in January. Its temporal relationship
with the 'strong minor warming' observed a few
Fig. 10. As in Figure 6 except for the pressure days later on a global basis does not appear
oscillations. fortuitous. The existing models are able to
explain the vertical structure and the downward
propagation of each of the individual warming,
wave as shown in Figure 9. Its period is very whether they are minor or major, by taking into
well defined (•1 day), and its amplitude reaches account the interaction between a stationnary
quite high values in the mesosphere (3% at 70 km wave and the zonal wind [Matsuno, 1971]. To
for the average value over 6 months). The two explain the repetitive perturbations in the lower
other larger periods are still present around 25 atmosphere (or the so-called vacillations in a
and 40 days, but with a broader spectrum and a zonally averaged flow), Lindzen et al. [1982]
smaller amplitude. The 25D wave appears to be developed a theory involving the interference of
present at all levels above 25 km, while the 40D a stationary wave with a Rossby wave. The
wave is only present above 55 km but with a recurrent variations reported in this article
slightly larger amplitude. The phase of the ISD might also be explained with such an inter-
is constant above 40 km, while its amplitude is ference, but no model existing today has led to
increasing, but it decreases slightly with their prediction.
altitude between 30 and 40 km. The phases of the
25D and 40D are decreasing with height between 40
Acknowledgments.
The authors wish to thank
and 60 km, which indicates a downward propagation C. Fehrenbach, Director of the Haute Provence
as for the temperature perturbations. The phase Observatory, for his hospitality. They are
change of the 40D below 40 km should not be grateful to all the members of the Lidar group of
considered as real, the period not being well the Service d'A•ronomie for their help in
defined in this altitude range. operating the station and in particular to J.P.
Concluding Remarks
Lidar observations of stratospheric and
mesospheric temperature has allowed us to perform
a local and continuous survey of the atmosphere
Schneider and F. Syda who collected the data.
This work was supported by DRET under contract
79-442 and 82-095.
References
in the altitude range 30-80 km during the winter Chanin, M. L., and A. Hauchecorne, Lidar
of 1981-1982. Such a study performed with a observation of gravity and tidal waves in the
height resolution not available from satellite middle atmosphere, J. Geophys. Res., 86, 9715-
data has shown detailed structure in the tempera- 9721, 1981.
ture profiles under the influence of planetary Charney, J. G., and P. G. Drazin, Propagation of
waves during the period from October to March planetary scale disturbances from the lower
when such waves can propagate. On the other hand, atmosphere into the upper atmosphere, J.
during the period of easterly winds, from June to Geophys. Res., 66, 83-109, 1961.
September, the propagation of planetary waves is Hauchecorne, A., and M. L. Chanin, Density and
blocked and then the temperature is observed to temperature profiles obtained by lidar between
be very stable. 30 and 80 km, Geophys. Res. Lett.• 7__, 565-568,
The main features observed during the winter 1980.
are the anticorrelation of the mesospheric and Hauchecorne, A., and M. L. Chanin, Le Lidar: Un
upper stratospheric temperature perturbations instrument d'•tude de la temperature strato-
(indicating a vertical wavelength of 40 km in the sph•rique et m•sosph•rique, Notes C. R. Acad.
temperature profiles) and the succession at Sci. Paris, 292, 25-28, 1981.
constant level of warmings and coolings reaching Hauchecorne, A., and M. L. Chanin, A mid-latitude
a large amplitude in January. A spectral analysis ground-based lidar study of stratospheric
of the observed perturbations has shown the warmings and planetary wave propagation, J.
presence of three main periods. The ISD wave with Atmos. Terr. Phys., 44, 577-589, 1982.
a phase constant with height is attributed to the
Labitzke, K., On the interannual variability of
H• mode of a free Rossby
• wave. This represents
the middle stratosphere during the Northern
the first observation of the ISD Rossby wave in winters, J. Meteorol. Soc. Jpn., 60_•, 124-139,
this altitude range and suggests the permanent 1982.
presence of this wave during the winter period. Lindzen, R. S., B. Farrell, and D. Jacqmin,
The two longer periods of about 25 and 40 days Vacillations due to wave interference:
Hmuchecorne and Chanñn: Lñdar-Observed Planetary Waves 3849
experiments, J. Atmos. Sci., 39__,
14-23, 1982
Beil. Berl. Wetterkarte, Berlin., 56/82, 1982.
Madden, R. A., and K. Labitzke, A free Rossby Offermann, D., P. Curtis, J. M. Cismeres, J.
wave in the troposphere and stratosphere
during January 1979, J. Geoph¾s. Res., 8•6,
1247-1254, 1981.
Matsuno, T., A dynamic model of the stratospheric
sudden warming, J__. Atmos. Sci., 28___, 1479-1492,
1971.
NauJokat, B., K. Petzoldt, K. Labitzke and R.
Lenschow, The fourth winter of PMP1, 1981/82:
A winter with several interesting features,
Satrustegui, H. Lauche, G. Rose, and K.
Petzoldt, Atmospheric temperature structure
during the Western European Winter Anomaly
Campaign 1975/76, J. Atmos. Terr. Phys., 41,
1051-1062, 1979.
(Received July 29, 1982; revised November 29, 1982; accepted December 21, 1982).

![Fig. 6. Phase % of the temperature oscillation T(f,t) as a function of height, defined as T(f,t) = T o (f) cos [2•f(t-to)-%] for the three frequencies f = 0.025 day -1 (period 40 days), f = 0.040 day -1 (25 days) and f](https://thumb-eu.123doks.com/thumbv2/123doknet/14797749.604710/5.873.111.392.121.511/phase-temperature-oscillation-function-height-defined-frequencies-period.webp)