HAL Id: hal-00296832
https://hal.archives-ouvertes.fr/hal-00296832
Submitted on 2 Feb 2006
HAL is a multi-disciplinary open access
archive for the deposit and dissemination of
sci-entific research documents, whether they are
pub-lished or not. The documents may come from
teaching and research institutions in France or
abroad, or from public or private research centers.
L’archive ouverte pluridisciplinaire HAL, est
destinée au dépôt et à la diffusion de documents
scientifiques de niveau recherche, publiés ou non,
émanant des établissements d’enseignement et de
recherche français ou étrangers, des laboratoires
publics ou privés.
Extreme precipitation events in NW Greece
E. E. Houssos, A. Bartzokas
To cite this version:
E. E. Houssos, A. Bartzokas. Extreme precipitation events in NW Greece. Advances in Geosciences,
European Geosciences Union, 2006, 7, pp.91-96. �hal-00296832�
SRef-ID: 1680-7359/adgeo/2006-7-91 European Geosciences Union
© 2006 Author(s). This work is licensed under a Creative Commons License.
Advances in
Geosciences
Extreme precipitation events in NW Greece
E. E. Houssos and A. Bartzokas
Laboratory of Meteorology, Department of Physics, University of Ioannina, Greece
Received: 31 October 2005 – Revised: 9 December 2005 – Accepted: 16 December 2005 – Published: 2 February 2006
Abstract. In this work, the extreme precipitation events in
NW Greece are studied. The data used are daily precipita-tion totals recorded at the meteorological staprecipita-tion of Ioannina University for the period 1970–2002. 156 days with precip-itation totals above 35 mm (5% upper limit) are only con-sidered. It is seen that, a minimum frequency of extreme precipitation events appears in the period 1986–1991, which is characterized by a high positive NAO index. For each of the 156 extreme precipitation days, at first, the mean sea level pressure pattern over Europe is constructed by using 273 grid point values. Using Factor Analysis, the dimensionality of the 156×273 data matrix is reduced to 156×5 (84% of the total variance) and then, Cluster Analysis is applied on the re-sults of Factor Analysis. Thus, the 156 cases are grouped ob-jectively to 11 clusters, revealing the main pressure patterns, which favour extreme precipitation in NW Greece. Seven of the patterns are encountered in winter and autumn, while three of them cover a period from autumn to spring and one appears mainly in summer. In all of them the cause of the extreme precipitation event is a low pressure system centred west of Greece or a low pressure trough extended eastwards or southwards up to Greece. In some cases the depression is so strong and extended that it covers the whole Europe and the Mediterranean. In the single summer pattern, rainfall is caused by an extension of the SW Asia thermal low up to the central Mediterranean.
1 Introduction
Research on climate change in Europe and the Mediterranean has attracted the interest of many scientists during recent decades. Most of them are focused on temperature changes only (see e.g. Metaxas et al., 1991; Maheras and Kutiel, 1999; Domonkos, 2001; Founda et al., 2004; Bartzokas and Houssos, 2005), although changes recorded on other climato-Correspondence to: A. Bartzokas
logical parameters, in many cases, appear equally significant. Moreover, the consequences of changes on other parameters on human life may be much more serious. For example, extreme precipitation events, apart from problems in trans-portation and communication, frequently cause severe dam-ages in urban as well as in rural areas. Many researchers, us-ing various methodologies, have carried out numerous stud-ies on Mediterranean precipitation. They are targeted either on its long term changes or on the atmospheric circulation favouring high or low precipitation events. Some of them use numerical models of weather prediction while others are based on synoptic or statistical approaches (Metaxas et al., 1993; Romero et al., 1998; Jansa et al., 2000, 2001; Ku-tiel et al., 2001; Xoplaki et al., 2004; Cislaghi et al., 2005; Kostopoulou and Jones, 2005; Tolika and Maheras, 2005). This study aims to present a detailed analysis of the extreme rainfall events in NW Greece, the wettest area of the country, which, in average, receives around 1200 mm of rainfall per year. At first, the general characteristics of the extreme pre-cipitation events in NW Greece are given and then, by using the multivariate statistical methods of Factor Analysis (FA) and Cluster Analysis (CA) the main pressure patterns associ-ated or favouring these events in NW Greece are objectively defined.
2 Data collection and methodology
The dataset used consists of daily precipitation values recorded at the meteorological station of Ioannina Univer-sity, located at NW Greece, for the 33-year period 1970– 2002. Also, mean sea level pressure values from 10 W to 40 E and from 30 N to 60 N, at 273 grid points spaced by 2.5◦in latitude and longitude are utilized (ECMWF 40 Years Reanalysis Project).
A day is defined as an “extreme precipitation day” when the precipitation depth recorded belongs to the upper 5% of the distribution of all the daily precipitation values. In the case of Ioannina, this threshold is 35 mm. The extreme
92 E. E. Houssos and A. Bartzokas: Extreme precipitation events in NW Greece
Fig. 1. Time series of extreme precipitation days.
precipitation days for the 33-year period are 156 and for these days the second dataset is utilized in order to construct daily sea level pressure maps covering Europe and N. Africa. Since at the meteorological station of the University obser-vations take place once per day, at 06:00 UTC, the synoptic charts used are those of 18:00 UTC of the previous day; i.e. in the middle of the rainy 24-hour period.
Then, FA (Jolliffe, 1986; Manly, 1986) is applied on the 273 pressure time-series, in order to reduce the dimension-ality of the 156x273 data matrix. By using the limit of 85% of the total variance, the original data matrix is reduced to 156×5. Thus, “noise” is also reduced and each precipitation day is associated with 5 factors only (in fact, pressure values over Europe and N. Africa), the main contributors of precipi-tation in NW Greece. Since, in this work, FA is used as an in-termediate tool only, FA results are not presented. Then, CA, K-means (Sharma, 1996), is applied on the factor scores time series in order to group objectively days with similar spatial pressure distribution. For the optimum number of clusters numerous test analyses were carried out. Taking also into account the seasonal distribution of the days of each clus-ter, eventually 11 clusters were retained. For each cluster of days, the mean value of the precipitation recorded is cal-culated and finally, the mean sea level pressure map is con-structed, revealing the main pressure patterns, which favour extreme precipitation events in NW Greece.
It is noted that the classification of the extreme precipita-tion days in groups characterized by a specific spatial pres-sure distribution could be also performed by using FA only on the transposed data matrix (T-mode). However, in the FA classifications, the position of the pressure systems appears to play the major role and not their intensity. In this case, it will be seen that cases of similar patterns but with deeper lows or stronger highs, are found as separated categories.
The two methods, FA and CA, are briefly described in the following:
FA describes a set of p correlated variables X1, X2,
..., Xp in terms of a smaller number of new
uncorre-lated indices, elucidating the relationship between the orig-inal p variables. Each of the p initial variables can be expressed as a linear function of m (m<p) factors, i.e.
Xi=ai1F1+ai2F2+...+aimFm, where F1, F2, ..., Fm are the
factors and ai1, ai2, ..., aim are the factor loadings which,
given that the original time series are standardized, express the correlation between the initial variables and the new ones (factors). The number m of the retained factors has to be decided, by using various rules and considering the physi-cal interpretation of the results. A widely used process is the “rotation of the axes”, which, by maximizing some factor loadings and minimizing some others, succeeds in a better separation among the initial variables and thus in a better in-terpretation of the results (Richman, 1986). In this work, Varimax rotation has been applied.
CA groups objectively cases with similar characteristics. Each case (day) corresponds to a point in the m-dimensional space and each Cluster consists of those cases, which are “close” to each other in this space. The characterization of a distance between two observations k and l as “close” or “far” is determined by the squared Euclidean distance shown in Eq. (1), D2kl= m X n=1 (xkn−xln)2 (1)
where, xknis the value of nth Factor for the kth day and xln
is the value of nth Factor for the lth day. There are two main clustering techniques: the hierarchical and the nonhierarchi-cal one. Their basic difference is that in the nonhierarchinonhierarchi-cal technique the number of Clusters must be known a priori. On the contrary, in the hierarchical technique the ultimate number of Clusters is determined by a variety of statistical criteria. In this work, at first, the hierarchical technique was applied experimentally as a guide and then, the nonhierarchi-cal K-means technique for a specific number of Clusters was used.
3 Results and discussion
3.1 General characteristics
The average precipitation depth per extreme precipitation day is approximately 48 mm and the number of extreme precipitation days per year is approximately 5. How-ever, during the study period, certain fluctuations have been recorded, most of them associated with atmospheric circula-tion changes in the Mediterranean. In Fig. 1 it is seen that the frequency of the extreme precipitation days appears reduced around 1990 when a high positive North Atlantic Oscilla-tion (NAO) index (WMO, 1998) was recorded. The exten-sion of the subtropical anticyclone of the Atlantic (Azores) up to central Mediterranean modified the tracks of the travel-ling depressions affecting precipitation in NW Greece. Dur-ing this period, low pressure systems approached Greece mainly from the North, causing dry katabatic winds in NW Greece due to the NW-SE orientation of the Pindus moun-tain range. The decline of precipitation over major regions of the Mediterranean basin (mainly in the western part) and its association with the high positive NAO index has been found and explained by many researchers (see e.g. Hurrell,
Fig. 2. Monthly distribution of the extreme precipitation days (1970–2002).
Fig. 3. Frequency distribution of extreme precipitation days.
1995; Piervitali et al., 1997; Trigo et al., 2002). Further-more, Krichak and Alpert (2005) related this decline also to the East Atlantic Western Russia (EAWR) pattern. In con-trast to the early 1990’s situation, in late 1970’s, when the NAO index was negative, high frequency of extreme precip-itation days is recorded. In the recent years, the occurrences of extreme precipitation events appear around normal again (the years 2003 and 2004 are included in Fig. 1 though they are not considered in the following FA and CA analyses). The correlation coefficient between the above time series and the winter NAO index was found −0.35. However, it has to be noted that Alpert et al. (2002), who examined daily rain-fall categories for the Mediterranean, showed that in Spain and Italy, in spite the decrease in the total rainfall, torrential rainfall has increased significantly. This “paradox” is not de-tected in the eastern Mediterranean. The application of the Mann-Kendall test of randomness against trend showed that there is no statistically significant linear trend at 0.05 confi-dence level.
The monthly distribution of the number of extreme pre-cipitation days, for the 33-year period, is presented in Fig. 2. It is seen that the maximum frequency appears in Novem-ber and DecemNovem-ber while the minimum in summer, in accor-dance with the intra-annual variation of the total precipita-tion depths (Bartzokas et al., 2003a). The secondary max-imum in May can be attributed to local afternoon thermal showers. During this period of the year depressions appear mostly in the upper levels of the atmosphere, causing
insta-Fig. 4. All the extreme precipitation events classified in the 11
clus-ters.
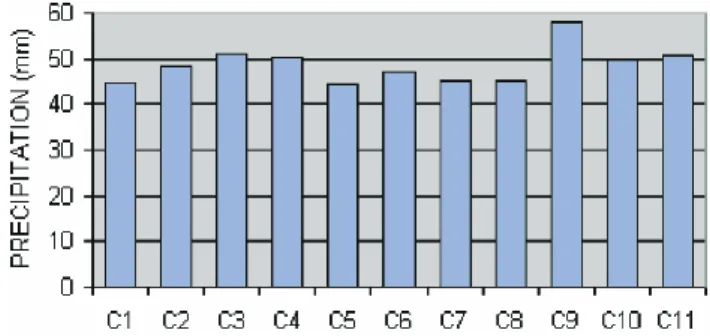
Fig. 5. Average precipitation (mm) per cluster.
Fig. 6. Seasonal distribution of extreme precipitation days.
bility due to the associated cold air masses aloft. At the sur-face, strong sea breeze systems prevail, causing convergence lines inland and enriching further the atmosphere with mois-ture (Metaxas, 1978). This maximum coincides with that detected by Metaxas (1972) for thunderstorm frequency over the same area.
The frequency distribution of the extreme precipitation days (Fig. 3) exhibits higher number of occurrences in the relatively low precipitation values, as was expected. Vari-ous studies have been carried out on frequency distributions of extreme precipitation. In most cases the Gamma distri-bution is considered to be the most suitable (see e.g. Ding, 1992) nevertheless in some studies the Fr´echet or the Inverse Gaussian distributions appear better (see e.g. Tzavelas et al., 2005).
94 E. E. Houssos and A. Bartzokas: Extreme precipitation events in NW Greece
Fig. 7. The main pressure patterns favouring extreme precipitation events in NW Greece.
3.2 Cluster analysis results
Cluster analysis classified the 156 extreme precipitation days in 11 clusters. All the extreme precipitation cases (number of days and precipitation depths) are presented per cluster in Fig. 4. The average precipitation depth per cluster varies from 44 to 58 mm (Fig. 5). In Fig. 6 the frequency of occur-rences of extreme precipitation events is shown per cluster and per season.
The mean pressure pattern of the days classified in each cluster is shown in Fig. 7. The main characteristics of these patterns are the following.
– Cluster 1: a low pressure system is located over Italy,
causing southwesterly flow over NW Greece. It is en-countered during winter and autumn (Fig. 6). Most of the 20 cases of this cluster are observed during the neg-ative NAO index periods (figure not shown), as was ex-pected.
– Cluster 2: a trough is extended eastwards from the
At-lantic Ocean up to the Ionian Sea. This situation is mainly encountered in winter.
– Cluster 3: a low pressure system is located over the
Adriatic Sea and the Balkans causing, in average, the second highest precipitation depth, 51 mm, in NW Greece. In this cluster belongs the pressure pattern, which produced the absolutely highest rainfall in Ioan-nina, 93 mm (4–5/2/1979) in the study period (Fig. 4). This situation is also a feature of winter and autumn.
– Cluster 4: a trough is extended southeastwards up to the
central Mediterranean.
– Cluster 5: this is the only pattern encountered during
the warm period of the year. The thermal low pres-sure system of SW Asia, a feature of summer, is ex-tended up to the central Mediterranean and the subtrop-ical anticyclone of the Atlantic (Azores) appears weaker and shrunk. Thus, the cyclonic circulation over Greece along with local atmospheric instability gives high pre-cipitation depths in Ioannina (in average 44 mm), which however, in average, are lower than in the winter cases (Fig. 5).
– Cluster 6: an isolated low pressure system over southern
Italy, causing southerly flow over NW Greece; mainly in autumn.
– Cluster 7: an extended low pressure system covers the
whole Europe mainly during autumn and spring.
– Cluster 8: a shallow depression over the Ionian Sea;
mainly a feature of autumn.
– Cluster 9: the pressure system located over Italy is the
deepest one producing the highest amounts of rainfall in NW Greece in winter and autumn. In this cluster, the 7 out of the 11 cases cause rainfall depths above 60 mm (Fig. 4) while the average value is 58 mm. The difference in the mean precipitation value between this cluster and the clusters 1, 5, 7, 8 is found statistically significant at 0.05 level.
– Cluster 10: a strong pressure gradient over western
Balkans due to a depression over southern Italy and an anticyclone over western Russia, causes southerly flow over NW Greece with high amounts of rainfall in all seasons except in summer.
– Cluster 11: this cluster comprises 1 day only (3/12/1976) with a unique pressure pattern (a low pres-sure system covers the whole Europe). Test analyses with different number of clusters showed that its unique pressure pattern could not be classified in any other cluster (figure not shown).
4 Conclusions
The extreme precipitation events in NW Greece were studied by using daily rainfall values from the meteorological station of Ioannina University. It was found that the 156 extreme precipitation days could be classified in 11 clusters with com-mon spatial distribution of atmospheric pressure over Europe and the Mediterranean. For each cluster of days the mean pressure pattern was constructed and it was found that seven of the patterns are encountered in winter and autumn, three of them cover a period from middle autumn to middle spring and one is a feature of the warm period of the year. As was expected, in most of them the cause of the extreme precipita-tion event is a low pressure system located west of Greece in accordance with the findings of Bartzokas et al. (2003b). Its position and its intensity differ considerably from pattern to pattern. In most cases, the depression is found to be located either in the Ionian Sea or over Italy and it is either connected to higher latitude circulation or it appears as an isolated cy-clone. In some cases the whole Europe and the Mediter-ranean are covered by an extended low pressure system or a trough. In the single summer pattern rainfall is caused by an extension of the SW Asia thermal low towards the central Mediterranean.
Edited by: V. Kotroni and K. Lagouvardos Reviewed by: anonymous referee
References
Alpert, P., Ben-Gai, T., Baharad, A., Benjamini, Y., Yeku-tieli, Y., Colacino, M., Diodato, L., Ramis, C., Homar, V., Romero, R., Micaelides, S. and Manes, A.: The paradoxical increase of Mediterranean extreme daily rainfall in spite of de-crease in total values., Geophys. Res. Lett., 29, art. no. 1536, doi:10.1029/2001GL013554, 2002.
Bartzokas, A. and Houssos, E. E.: Extreme temperature events in NW Greece, Proceedings of the 10th International Conference on Harmonisation within Atmospheric Dispersion Modelling for Regulatory Purposes, Malia, Crete, Greece, 17–20 October 2005, 556–560, 2005.
Bartzokas, A., Lolis, C. J., and Metaxas, D. A.: A study on the intra-annual variation and the spatial distribution of precipitation amount and duration over Greece on a 10-day basis., Int. J. Cli-matol., 23, 207–222, 2003.
Bartzokas, A., Lolis, C. J., and Metaxas, D. A.: 850 hPa relative vorticity centres of action for winter precipitation in the Greek area, Int. J. Climatol., 23, 813–828, 2003.
Cislaghi, M., De Michele, C., Ghezzi, A., and Rosso, R.: Statis-tical assessment of trends and oscillations in rainfall dynamics: Analysis of long daily Italian series, Atmos. Res., 77, 188–202, 2005.
Ding, Y. G.: Study of the generality of the gamma precipitation distribution model, 5th Int. Meeting on Statistical Climatology, Toronto, 499–503, 1992.
Domonkos, P.: Temporal accumulations of extreme daily mean tem-perature anomalies, Theor. Appl. Climatol., 68, 17–32, 2001. Founda, D., Papadopoulos, K. H., Petrakis, M., Giannakopoulos,
96 E. E. Houssos and A. Bartzokas: Extreme precipitation events in NW Greece
temperature in Athens from 1897 to 2001 with emphasis on the last decade: trends, warm events, and cold events, Global Planet. Change, 44, 27–38, 2004.
Hurrell, J. W.: Decadal trends in the North Atlantic Oscillation: Regional temperatures and precipitation, Science, 269, 676–679, 1995.
Jansa, A., Genoves, A., Garcia-Moya, J. A.: Western Mediterranean cyclones and heavy rain. Part I: Numerical experiment concern-ing the Piedmont flood case, Meteorol. Appl., 7, 323–333, 2000. Jansa, A., Genoves, A., Picornell, M. A., Campins, J., Riosalido, R., and Carretero, O.: Western Mediterranean cyclones and heavy rain. Part 2: Statistical approach, Meteorol. Appl., 8, 43–56, 2001.
Jolliffe, I. T.: Principal Component Analysis, Springer, New York, 1986.
Kostopoulou, E. and Jones, P. D.: Assessment of climate extremes in the Eastern Mediterranean, Meteorol. Atmos. Phys., 89, 69– 85, 2005.
Krichak, S. O. and Alpert P.: Signatures of the NAO in the atmo-spheric circulation during wet winter months over the Mediter-ranean region, Theor. Appl. Climatol., 82, 27–39, 2005. Kutiel, H., Hirsch-Eshkol, T. R., and Turkes, M.: Sea level pressure
patterns associated with dry or wet monthly rainfall conditions in Turkey, Theor. Appl. Climatol., 69, 39–67, 2001.
Maheras, P. and Kutiel, H.: Spatial and temporal variations in the temperature regime in the Mediterranean and their relationship with circulation during the last century, Int. J. Climatol., 19, 745– 764, 1999.
Manly, B. F. J.: Multivariate statistical methods: A primer, Chap-man & Hall, London, 1986.
Metaxas, D. A.: Space and time distribution of thunderstorm fre-quency in Greece. Publication of the Laboratory of Meteorology, Ioannina University, no. 4 (in Greek), 1972.
Metaxas, D. A.: Evidence on the importance of diabatic heating as divergence factor in the Mediterranean, Arch. Meteor. Geophy. A, 27, 69–80, 1978.
Metaxas, D. A., Bartzokas, A., Repapis, C. C., and Dalezios, N. R.: Atmospheric circulation anomalies in dry and wet winters in Greece, Meteorol. Z., 2, 127–131, 1993.
Metaxas, D. A., Bartzokas, A., and Vitsas, A.: Temperature fluctu-ations in the Mediterranean area during the last 120 years, Int. J. Climatol., 11, 897–908, 1991.
Piervitali, E., Colacino, M., and Conte, M.: Signals of Climatic Change in the Central–Western Mediterranean Basin, Theor. Appl. Climatol., 58, 211–219, 1997.
Richman, M. B.: Rotation of Principal Components, J. Climatol., 6, 293–335, 1986.
Romero, R., Guijarro, J. A., Ramis, C., and Alonso, S.: A 30-year (1964–1993) daily rainfall data base for the Spanish Mediter-ranean regions: first exploratory study, Int. J. Climatol., 18, 541– 560, 1998.
Sharma, S.: Applied Multivariate Techniques, John Wiley, New York, 1996.
Tolika, K. and Maheras, P.: Spatial and temporal characteristics of wet spells in Greece, Theor. Appl. Climatol., 81, 71–85, 2005. Trigo, R. M., Osborn, T. J., and Corte-Real, J.: The North Atlantic
Oscillation infuemce on Europe: climate impacts and associated physical mechanisms, Clim. Res., 20, 9–17, 2002.
Tzavelas, G., Paliatsos, A. G., and Prezerakos, N.: Distribution of the extreme annual precipitation over urban areas, Adv. & Appl. in Stat., 5, 111–123, 2005.
World Meteorological Organization: The Global Climate System Review, Climate System Monitoring December 1993–May 1996, in: World Climate Data and Monitoring Programme, edited by: Nichols, J. M., WMO-No. 856, 1998.
Xoplaki, E., Gonzalez-Rouco, J. F., Luterbacher, J., and Wanner, H.: Wet season Mediterranean precipitation variability: influence of large dynamics and trends, Clim. Dyn., 23, 63–78, 2004.