HAL Id: hal-00298662
https://hal.archives-ouvertes.fr/hal-00298662
Submitted on 13 Jun 2005HAL is a multi-disciplinary open access
archive for the deposit and dissemination of sci-entific research documents, whether they are pub-lished or not. The documents may come from teaching and research institutions in France or abroad, or from public or private research centers.
L’archive ouverte pluridisciplinaire HAL, est destinée au dépôt et à la diffusion de documents scientifiques de niveau recherche, publiés ou non, émanant des établissements d’enseignement et de recherche français ou étrangers, des laboratoires publics ou privés.
Transpiration of montane Pinus sylvestris L. and
Quercus pubescens Willd. forest stands measured with
sap flow sensors in NE Spain
R. Poyatos, P. Llorens, F. Gallart
To cite this version:
R. Poyatos, P. Llorens, F. Gallart. Transpiration of montane Pinus sylvestris L. and Quercus pubescens Willd. forest stands measured with sap flow sensors in NE Spain. Hydrology and Earth System Sciences Discussions, European Geosciences Union, 2005, 2 (3), pp.1011-1046. �hal-00298662�
HESSD
2, 1011–1046, 2005Sap flow of montane pine and oak forests
in NE Spain R. Poyatos et al. Title Page Abstract Introduction Conclusions References Tables Figures J I J I Back Close
Full Screen / Esc
Print Version Interactive Discussion
EGU
Hydrol. Earth Sys. Sci. Discuss., 2, 1011–1046, 2005 www.copernicus.org/EGU/hess/hessd/2/1011/
SRef-ID: 1812-2116/hessd/2005-2-1011 European Geosciences Union
Hydrology and Earth System Sciences Discussions
Papers published in Hydrology and Earth System Sciences Discussions are under open-access review for the journal Hydrology and Earth System Sciences
Transpiration of montane Pinus sylvestris
L. and Quercus pubescens Willd. forest
stands measured with sap flow sensors in
NE Spain
R. Poyatos, P. Llorens, and F. Gallart
Institute of Earth Sciences “Jaume Almera” (CSIC), Llu´ıs Sol´e Sabar´ıs s/n, 08208 Barcelona, Spain
Received: 10 May 2005 – Accepted: 24 May 2005 – Published: 13 June 2005 Correspondence to: R. Poyatos (rpoyatos@ija.csic.es)
HESSD
2, 1011–1046, 2005Sap flow of montane pine and oak forests
in NE Spain R. Poyatos et al. Title Page Abstract Introduction Conclusions References Tables Figures J I J I Back Close
Full Screen / Esc
Print Version Interactive Discussion
EGU
Abstract
Stand transpiration was measured during the 2003 and 2004 growing seasons using heat dissipation sap flow sensors in a Scots pine (Pinus sylvestris L.) and a pubescent oak (Quercus pubescens Willd.) forest located in a montane area of the Eastern Pyre-nees (NE Spain). The first aim of the study was to assess the differences in
quantita-5
tive estimates of transpiration (Ec) and the response to evaporative demand of the two stands. Over the studied period of 2003, characterised by a severe drought episode during the summer, the oak stand Ecwas only 110 mm compared to the 239 mm tran-spired by the Scots pine stand, although the ratio of transpiration to reference evapo-transpiration (Ec/E T0) in the oak stand compares well with the expected values
pre-10
dicted for low leaf area index (LAI) oak forests in southern Europe. Scots pine showed a strong reduction in Ec/ET0as the drought developed, whereas pubescent oak was less affected by soil moisture deficits in the upper soil. As a second objective, and given the contrasting meteorological conditions between 2003 and 2004 summer periods, the interanual variability of transpiration was studied in the Scots pine plot. Rainfall
15
during the summer months (June–September) in 2003 was almost 40% less than in the same interval in 2004. Accordingly, transpiration was also reduced about 25% in 2003. Finally, Scots pine data from 2003 and 2004 was used to calibrate a simple transpiration model using E T0 and soil moisture deficit (SMD) as input variables, and implicitly including stomatal responses to high vapour pressure deficits (Dd) and soil
20
water status.
1. Introduction
Given its importance in the hydrological cycle, transpiration of whole forest canopies has been experimentally measured in a wide range of environments, from boreal to tropical, using different methodologies. Upscaled leaf or branch-level measurements of
25
gas exchange (e.g. Saugier et al., 1997) or sap flow (e.g. Granier et al., 1996; ˇCerm ´ak 1012
HESSD
2, 1011–1046, 2005Sap flow of montane pine and oak forests
in NE Spain R. Poyatos et al. Title Page Abstract Introduction Conclusions References Tables Figures J I J I Back Close
Full Screen / Esc
Print Version Interactive Discussion
EGU
et al., 2004), micrometeorological methods, such as the Bowen ratio energy balance (e.g. Denmead et al., 1993) or eddy covariance systems (e.g. Baldocchi et al., 1988; K ¨ostner et al., 1992), and soil water balance approaches (e.g. Ladekarl, 1998) have been used to estimate stand-level transpiration rates from hourly to yearly time-steps. At larger spatial scales, transpiration of forested watersheds is best addressed using
5
catchment water balance (e.g. Wilson et al., 2001).
Usage of thermal sap flow methods (Smith and Allen, 1996; ˇCerm ´ak et al., 2004) has become widespread in forest hydrology and ecophysiology, because they are rel-atively simple and inexpensive, can be used in non-homogeneous terrain (Martin et al., 1997) and permit separate estimations of the tree transpiration component of
for-10
est evapotranspiration (Wilson et al., 2000). They give information with high temporal resolution about physiological processes and, at the same time, allow for long-term recordings of transpiration (Oliveras and Llorens, 2001), accounting for intra- and inter-anual variability of forest transpiration (Br ´eda and Granier, 1996). However, upscaling from stem and branch level to obtain daily estimates of stand transpiration still gives
15
rise to significant uncertainties, due to circumferential and radial variation in sap flow along the stem (Nadezhdina et al., 2002), estimation of sapwood depths ( ˇCerm ´ak and Nadezhdina, 1998) or tree to stand extrapolation (Hatton and Wu, 1995).
Scots pine (Pinus sylvestris L.), largely distributed throughout the Eurasian boreal and temperate zone, is restricted in the Mediterranean basin to montane
environ-20
ments (Barb ´ero et al., 1998). Pubescent oak (Quercus pubescens Mill.) distribution in Spain delimits the sub-Mediterranean region, the transition between Eurosiberian and Mediterranean vegetation areas (Ceballos and Ruiz de la Torre, 1979). While the first species is considered as early successional due to its ability to colonize abandoned farmland and pastures, the latter is the climacic species in most montane areas.
25
Extensive spontaneous afforestation by Scots pine after the abandonment of the agricultural activities in the area (Poyatos et al., 2003), have raised an important con-cern about its possible hydrological consequences, given the role of forest canopies in controlling the hydrologic balance under Mediterranean conditions (Pi ˜nol et al., 1999)
HESSD
2, 1011–1046, 2005Sap flow of montane pine and oak forests
in NE Spain R. Poyatos et al. Title Page Abstract Introduction Conclusions References Tables Figures J I J I Back Close
Full Screen / Esc
Print Version Interactive Discussion
EGU
and the reported decreasing trends in water yields after increases in forested cover (Sahin and Hall, 1996; Gallart and Llorens, 2004). Mediterranean montane regions get much more rainfall than lowland areas, and during the summer, it is largely in the form of short and intense events (Gallart et al., 2002). However, the high interanual climatic variability is responsible for the periodic occurrence of drought episodes which
5
severely affect the response of some species to meet the evaporative demand.
This paper aims at (1) determining daily transpiration of the two most representative forest canopies of the montane stage in NE Spain during the growing season (2) iden-tifying the different responses of the two species to the imposed evaporative demand, specially given the occurrence of a very dry summer period in 2003, (3) studying
inter-10
anual variability of Scots pine transpiration, and (4) obtaining a simple parametrisation for modelling forest transpiration as a function of reference evapotranspiration and soil moisture deficit in the Scots pine stand.
2. Materials and methods
2.1. Study area
15
The two experimental plots are part of the Vallcebre research area (42◦120N, 1◦490E), located in the Eastern Pyrenees (NE Spain). Research on several ecohydrological subjects have been carried out in the area since the late 1980’s. Climate is sub-Mediterranean, with an average air temperature of 7.3◦C (measured at 1440 m a.s.l.) and 924 mm of annual rainfall. Mudstone and limestone substrates are predominant,
20
resulting in clayey-rich soils in the first case, and bare rock areas or thin soils in the latter (Gallart et al., 2002). Climacic vegetation in the area corresponds to the
Buxo-sempervirentis-Quercetum pubescentis association, but most of the land was terraced
and deforested for cultivation in the past, and then progressively abandoned during the second half of the twentieth century (Poyatos et al., 2003). The present landscape is
25
mainly a mosaic of mesophilous grasslands of the Aphyllantion type and patches of 1014
HESSD
2, 1011–1046, 2005Sap flow of montane pine and oak forests
in NE Spain R. Poyatos et al. Title Page Abstract Introduction Conclusions References Tables Figures J I J I Back Close
Full Screen / Esc
Print Version Interactive Discussion
EGU
Scots pine, which colonised old agricultural terraces after their abandonment. 2.2. Experimental sites
The Scots pine (Cal Sort stand) plot is located in a rather young stand (the oldest trees are about 60 years old) overgrowing an abandoned terraced slope, at an elevation of ca. 1260 m a.s.l. The understorey is scarce, mainly scattered Buxus sempervirens L.
5
shrubs, and a discontinuous herb layer. Mudstone and sandstone are the principal underlying lithologies, originating sandy-loam soils about 65 cm deep (Rubio, personal communication). The oak plot (Cal Barrol stand) lies by the village of Vallcebre, at ca. 1100 m a.s.l., just 0.8 km apart from the pine plot. Unlike the pine stand, it is charac-terised by the presence of other woody species such as Prunus avium L., Fraxinus
10
excelsior L. and a dense understorey, mainly composed of Acer campestre L., Buxus sempervirens L., Prunus spinosa L., Rubus spp. and Rosa spp. The upper soil, which
is formed by a loamy matrix and limestone boulders, is about 50 cm deep. Stand struc-ture differs in both plots in terms of stem density and understorey cover, but they have very similar leaf area indices (Table 1).
15
2.3. Meteorology and soil moisture
The main meteorological variables were measured ca. 2 m above the two forest canopies (Table 2), except for global shortwave radiation and bulk precipitation, which were both measured in a meteorological station located in a grass-covered terrace by the pine plot. Reference evapotranspiration (E T0) was calculated according to
Penman-20
Monteith equation (Monteith, 1965) as described in Allen et al. (1998).
Soil moisture in the upper 30 cm was recorded continuously only in the Scots pine plot, calibrating the CS615 probe (Table 2) with weekly measurements of soil moisture taken with a TDR cable tester (Tektronix 1502C). Only weekly data was available in the oak plot, hence, a linear regression between these measurements and the continuous
25
HESSD
2, 1011–1046, 2005Sap flow of montane pine and oak forests
in NE Spain R. Poyatos et al. Title Page Abstract Introduction Conclusions References Tables Figures J I J I Back Close
Full Screen / Esc
Print Version Interactive Discussion
EGU
moisture seasonal evolution in the oak plot. 2.4. Sap flow measurements
Sap flow was measured with heat dissipation sensors made in our own laboratories according to Granier (1985, 1987). Briefly, these sensors consist of a pair of needle-like probes, usually 20 mm long, which bear a copper-constantan thermocouple in the
5
middle of the needle. Both needles are covered by an aluminium tube to homogenize temperature along the length of the probe and inserted in the trunk, with a vertical sep-aration of ca. 12 cm, the upper probe being heated at constant power. When sap moves upwards, the temperature difference (dT ) between heated and unheated needles de-creases, and during the night, under conditions of zero flow, d T is maximum. The sap
10
flow index K is then calculated from this two temperature differences and empirically related to the average sap flow velocity along the probe (Granier 1985, 1987).
The length of the probes was 20 mm for Scots pine and 10 mm for pubescent oak. Sharp variations in Q.pubescens sap velocity with sapwood depth have been reported ( ˇCerm ´ak and Nadezhdina, 1998; ˇCerm ´ak et al., 1998), which would lead to possible
15
underestimations of average sap flow by the Granier probe due to the influence of large velocity gradients on the estimate of average sap flow along the probe (Clear-water et al., 1999). Shorter needles, which have already been successfully tested in other oak species (Granier et al., 1994), were used in this study in order to minimise these measurement error, as recommended by Clearwater et al. (1999). Sensors were
20
installed at breast height in 12 trees per plot in May–June 2003, selecting the trees according to the diametric distribution (Granier et al., 1996). One sensor was inserted in the north-facing side of each tree and covered with reflective insulation to avoid the influence of natural temperature gradients in the stem. Temperature differences were recorded every 10 s and stored as 15 min average in a data logger (DT500, DataTaker,
25
Australia).
Due to technical failure after installation, only 8 sensors were functioning in the Scots pine plot during the 2003 measuring period (days 154 and 289, June to mid-October).
HESSD
2, 1011–1046, 2005Sap flow of montane pine and oak forests
in NE Spain R. Poyatos et al. Title Page Abstract Introduction Conclusions References Tables Figures J I J I Back Close
Full Screen / Esc
Print Version Interactive Discussion
EGU
The calibration empirically obtained by Granier (1985) was used in both species, after discarding the alternative calibration by Lundblad et al. (2001) for Scots pine, which resulted in abnormally high transpiration rates (data not shown). To integrate the mea-sured sap flow velocity to an average sap flux density along the whole conducting sapwood, a correction factor which accounts for radial variation of sap flow in Scots
5
pine has been applied (K ¨ostner et al., 1996). In pubescent oak, no correction has been adopted and measured velocity in the outer 10 mm of sapwood has been extrapolated to the whole conducting area. Although this assumption may lead to an overestimation of the total flux (Nadezhdina et al., 2002), we will consider that it counteracts the effects of the previously mentioned underestimation of average sap velocity along the length
10
of the probe.
2.5. Estimation of sapwood area and scaling up sap flow data to stand transpiration A gravimetric analysis of wood cores was done to estimate sapwood depths in sample trees of both species. Cores from north and south aspects of the stem were extracted with a Pressler increment borer (Suunto, Finland) in 14 pines and 11 oaks during
mid-15
August 2003. Sapwood was first visually identified in the field, and then taken to the laboratory, where volumetric fraction of water (fw) was estimated in discs of about 4 to 10 mm in length, from outer to inner xylem (Kravka et al., 1999) to estimate radial variation in fw. Sharp decreases in xylem water content usually indicate the boundary between conducting sapwood and non-conducting heartwood in conifers. After
sap-20
wood was identified in each sample tree, a regression was obtained between basal area (Ab) and sapwood area (As) of individual trees.
Stand transpiration (Ec) was then calculated adopting a diametric class stratification scheme (K ¨ostner et al., 1992), by which each diametric class (5 cm increment) was assigned a corresponding sap flow density calculated from the averaging of all the
25
trees measured within that class. Transpiration of each class relative to total stand transpiration, calculated during periods with all diametric classes being measured, was
HESSD
2, 1011–1046, 2005Sap flow of montane pine and oak forests
in NE Spain R. Poyatos et al. Title Page Abstract Introduction Conclusions References Tables Figures J I J I Back Close
Full Screen / Esc
Print Version Interactive Discussion
EGU
used to fill the gaps whenever a diametric class was missing (i.e. due to sensor failure). 2.6. Analysis of the response of forest transpiration to evaporative demand
As a first approach, we analysed the relationship of Ec with E T0 fitting a saturation curve as the one employed by Ewers et al. (2002)
Ec = a(1 − exp(−b · ET0)) (1)
5
In order to predict forest transpiration as a function of reference evapotranspiration and soil water status, a boundary-line analysis (Chambers et al., 1985) was first carried out between Ec and the natural logarithm of E T0, with the purpose of finding an upper envelope on the data points, i.e. the relationship between Ecand E T0when there are no other limiting conditions. A quantile regression technique was used to find this optimal
10
curve. This methodology, which was developed in econometrical analysis (Koenker and Basset, 1978), allows to fit a linear or nonlinear model to any desired quantile of a given data distribution. In ecological studies, this kind of analysis has proven very useful to detect relationships between pairs of variables when other factors, not included in the model, are known to be limiting the response of the dependent variable
15
(Cade and Noon, 2003). We used the upper 95% quantile fit to calculate a maximum transpiration, under optimal soil moisture conditions (Ec,max):
Ec,max = a + b · ln (ET0) (2)
The ratio of actual Ec derived from sap flow and Ec,max was related to soil moisture deficit (SMD) using a nonlinear function
20
Ec/Ec,max = 1 − k1exp(−k2SMD) (3)
Where SMD is defined in the same way as in Granier and Loustau (1994), SMD= θmax− θ
θmax− θmin (4)
HESSD
2, 1011–1046, 2005Sap flow of montane pine and oak forests
in NE Spain R. Poyatos et al. Title Page Abstract Introduction Conclusions References Tables Figures J I J I Back Close
Full Screen / Esc
Print Version Interactive Discussion
EGU
with θ, θmin and θmax being actual, minimum, and maximum volumetric soil moisture (cm3cm−3) during the period of study, respectively. We split the 2003 and 2004 dataset of Scots pine transpiration, using the days with even Julian day for model calibration. To fit the soil moisture function, data points with daytime vapour pressure deficit (Dd) larger than 0.6 kPa were selected in order to minimise the likely errors in sap flow
5
measurements and Dd under low evaporative demand conditions (Ewers and Oren, 2000).
Quantile regressions were performed with the statistical package R (R Development Core, Vienna, Austria) and parameter estimation in nonlinear regressions were ob-tained with SPSS (v.12.0., SPSS Inc., Chicago, USA).
10
3. Results
3.1. Individual tree sap flow results
Maximum instantaneous sap velocity (νmax), defined as the maximum 15 min record-ing, in Q.pubescens was ca. 2.5 dm h−1whereas in P.sylvestris was about 1.5 dm h−1. The average of measured νmax for each day increased linearly with stem diameter in
15
Scots pine (Fig. 1a), but reached a plateau when the relationship with projected crown area was examined (Fig. 1b). No apparent trends with the abovementioned biometric parameters were found for Q.pubescens (data not shown).
Sap flow per unit of sapwood area in oaks remained higher than in pines during the studied period in 2003 (Fig. 2). Maximum sap flow density of 1200 l m−2 day−1 was
20
recorded for Q.pubescens whereas P.sylvestris only reached 530 l m−2 day−1. The dynamics was generally similar, apart from the late spring days, when a progressive increase in sap flow density was detected in oaks coinciding with a decreasing trend in pines.
HESSD
2, 1011–1046, 2005Sap flow of montane pine and oak forests
in NE Spain R. Poyatos et al. Title Page Abstract Introduction Conclusions References Tables Figures J I J I Back Close
Full Screen / Esc
Print Version Interactive Discussion
EGU
3.2. Scaling-up to stand transpiration
Sapwood boundary delimitation based on steep declines in volumetric fraction of water in the xylem, as shown in Fig. 3a, was not always possible in P.sylvestris, and the visual determination from fresh wood cores was used instead. Sapwood depths ranged between 4.7 and 10.3 cm, extending to 70–80% of total xylem depth from cambium.
5
Volumetric water content increased in depth along the xylem for Q.pubescens (Fig. 3b) and therefore the field estimation of sapwood depth was used also for this species. In some cases though, a decreasing trend of fw with depth was initially observed in the first millimetres after cambium, followed by the abovementioned increase deeper in the xylem. Pubescent oak showed much narrower sapwood (1.4–2.8 cm deep),
10
its extension varying between 15 and 40% of total xylem length for the biggest and smallest tree, respectively.
Regressions between basal (Ab) and sapwood area (AS) showed that sapwood con-stitutes almost a constant 80% of the total basal area in Scots pine (As=0.80·A1.01b ,
R2=0.996; the exponent is not different from unity, t-test, P =0.77), whereas in
15
pubescent oak this proportion decreases with tree size (AS=0.94·A0.80b , R2=0.951). 3.3. Environmental variables and transpiration in pine and oak stands
Meteorological drivers of transpiration did not vary much between sites (Fig. 4). Net ra-diation and daytime vapour pressure deficit attained maximum values during the sum-mer (ca. 400 Wm−2 and 3 kPa), with Dd largely below 1 kPa during late summer and
20
early autumn. Minimum and maximum air temperatures were 7.2 and 27.1◦C respec-tively. Soil moisture in the upper horizons ranged between 0.16 and 0.32 cm3cm−3 in the pine plot and 0.19 cm3 cm−3 and 0.31 cm3 cm−3 in the oak plot. Scarce precipita-tions during the central part of the summer and high evaporative demand lead to rapid soil moisture depletion, only recovered after late summer rainfalls. Maximum
transpi-25
ration rates in the Scots pine stand (3.7 mm day−1) occured at the beginning of June, whereas for pubescent oak they took place in September (1.4 mm day−1), after refilling
HESSD
2, 1011–1046, 2005Sap flow of montane pine and oak forests
in NE Spain R. Poyatos et al. Title Page Abstract Introduction Conclusions References Tables Figures J I J I Back Close
Full Screen / Esc
Print Version Interactive Discussion
EGU
of soil water reserve. Leaf loss was observed in the Scots pine plot from mid-August, whereas no effects were appreciable in pubescent oak leaves during the 2003 summer drought.
The effects of limited water availability are already appreciable from the gradual de-crease in relative transpiration (Ec/E T0) of Scots pine from 8 July until 8 August, with
5
values declining from 0.75 to only 0.25. In pubescent oak, relative transpiration was kept at an almost constant value of ca. 0.25 throughout most of the spring and summer, but increased gradually from mid-August to reach a value of ca. 0.50 at the end of the growing season. Days with Ec/E T0around 1 corresponded to very low Dd conditions (Fig. 4).
10
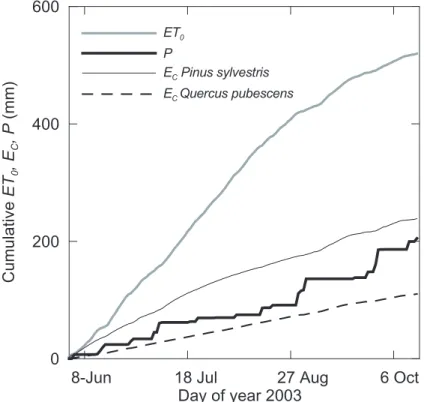
There was a more than two-fold difference between the estimations of canopy tran-spiration computed from June to mid-October of 2003 (Julian days 154-289) for both forest covers (Fig. 5). The Scots pine stand transpiration (239 mm) resulted to be higher than the amount of bulk precipitation (205 mm), and represented 46% of refer-ence evapotranspiration (total E T0=520 mm). Oaks transpired 110 mm, only 19% of
15
the 592 mm estimated as E T0or 54% of cumulative rainfall. 3.4. Response of forest transpiration to evaporative demand
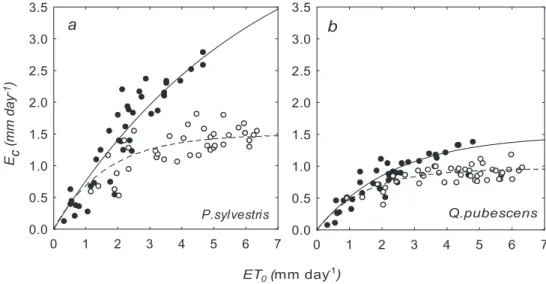
Daily canopy transpiration was clearly non-linearly related to reference evapotranspi-ration (Figs. 6a and 6b). At E T0 lower than 3 mm day−1, the response of both forest covers was roughly the same, independently from soil water conditions. However, at
20
high SMD’s and high evaporative demand (i.e. E T0>3 mm) transpiration was
substan-tially reduced in both cases (Figs. 6a and 6b). Sensitivity of canopy transpiration to E T0, (Table 3) i.e. the parameter b in Eq. (1), was higher under severe drought conditions in Scots pine (t-test, P=0.004), but not in pubescent oak (t-test, P =0.058). This param-eter differed between species only under drought conditions, though only marginally
25
(t-test, P=0.020). Drought also significantly reduced parameter a in pubescent oak (t-test, P=0.001); only under these conditions parameter a differs between species
HESSD
2, 1011–1046, 2005Sap flow of montane pine and oak forests
in NE Spain R. Poyatos et al. Title Page Abstract Introduction Conclusions References Tables Figures J I J I Back Close
Full Screen / Esc
Print Version Interactive Discussion
EGU
(t-test, P=0.000).
3.5. Interanual variability and modelling of Scots pine transpiration
The interanual comparison of transpiration in the Scots pine stand shows that, in 2004, the amount of water transpired into the atmosphere was ca. 80 mm higher than dur-ing the same summer period in 2003 (Table 4). Rainfall was substantially higher in
5
2004, about 40% more than in 2003, but the number of days with a developing water stress (SMD>0.6) was very similar for both years. However, severe water stress con-ditions (SMD>0.8) were much more common in 2003, together with dry atmospheric conditions (Table 4).
With respect to the transpiration model calibrated with 2003 and 2004 daily data, the
10
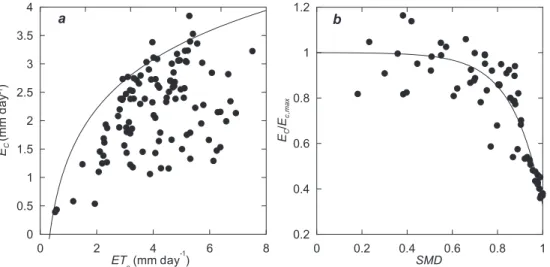
results of the boundary-line analysis of Ec in relation to E T0 yield an envelope curve which truly represents the response of the vegetation to the evaporative demand under optimal soil conditions (Fig. 7a). The subsequent analysis of the ratio between the es-timated Ec,maxand soil moisture deficit reveals a strong limitation of transpiration when SMD>0.6 (Fig. 7b). The complete transpiration model (Table 5) was able to simulate
15
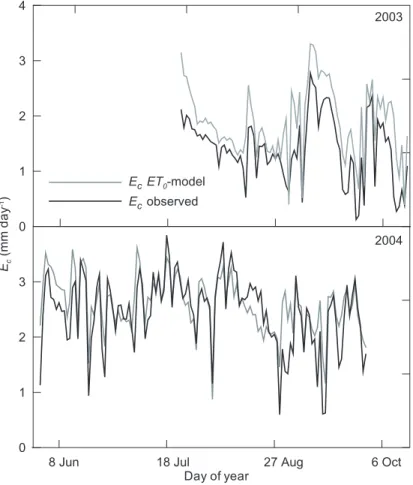
relatively well the seasonal dynamics of transpiration (Fig. 8), although quantitative estimates were better for the 2004 measuring period. Modelled Ec for the period of 2003 with available soil moisture data (Julian days 205–289) was 160 mm, compared to 120 mm of measured Ec. In 2004, modelled Ecamounted to 314 mm, overestimating by ca. 15 mm the value obtained with stand-scaled sap flow measurements (Table 4).
20
4. Discussion
4.1. Individual tree sap flow and uncertainties in the upscaling to stand transpiration Maximum instantaneous sap velocity measured in the outer xylem, defined as the max-imum 15 min value for each day, was found to be within the limits reported in the litera-ture for pines and oaks. Available data for Scots pine, indicates a range of νmaxaround
25
HESSD
2, 1011–1046, 2005Sap flow of montane pine and oak forests
in NE Spain R. Poyatos et al. Title Page Abstract Introduction Conclusions References Tables Figures J I J I Back Close
Full Screen / Esc
Print Version Interactive Discussion
EGU
1–1.5 dm h−1 (Lundblad et al., 2001). To our knowledge, there is no published data on νmax for pubescent oak, but findings on very similar Quercus species (Q. petraea), show higher values of maximum sap velocity, around 2.8 dm h−1(Br ´eda et al., 1993).
The positive relationships found in Scots pine between DBH and maximum sap ve-locity (Fig. 1) may be related to larger light availability in bigger trees, which also
cor-5
respond with those in dominant positions within the stand. Stand-level transpiration estimates using a representative sap flow density for each diametric class is appropi-ate in this case, given the dependence of sap flow on tree size. In contrast, the much sparser oak stand would mean less competition for light and a lack of relationship be-tween these variables. Accordingly, upscaling of individual sap flow measurements
10
could have been addressed simply using mean sap flow density and multiplying by the ratio of sapwood to ground area (AS : AG), as sap flow was not dependant on tree size. Mean sap flow per sapwood area increased during late spring in Q.pubescens and not in P.sylvestris (Fig. 2), probably due to the progressive development of earlywood vessels favouring water transport capacity (Br ´eda and Granier, 1996). Higher sap flow
15
per sapwood area in Q.pubescens does not result in higher stand transpiration rates, due to the inferior conducting area in the oak plot compared to the value found for the pine plot (Table 1). Woody species bearing vessels with ring-porous anatomy usually have less sapwood area but higher sap velocities, contrarily to what happens in conifers (Swanson, 1994).
20
Non-uniformity of sap velocity in tree stems is one the most challenging issues in the upscaling process of sap flow measurements. Radial variation in sap flow of
P.sylvestris stems has been documented in a number of works, reporting a
Gaus-sian profile (K ¨ostner et al., 1996; Nadezhdina et al., 2002). The correction coefficient used in this work was also found from a Gaussian-like variation of sap flow along the
25
xylem, being the best option to account for radial variability without actual measure-ments in the individuals from the studied stand. Recently, this Gaussian pattern has been generalized for conifers (Ford et al., 2004).
HESSD
2, 1011–1046, 2005Sap flow of montane pine and oak forests
in NE Spain R. Poyatos et al. Title Page Abstract Introduction Conclusions References Tables Figures J I J I Back Close
Full Screen / Esc
Print Version Interactive Discussion
EGU
higher in ring-porous species, with much sharper profiles of sap velocity, which means that only the outer growth rings actually contribute to water transport (Granier et al., 1994). The use of shorter probes in Q.pubescens was aimed at avoiding large gradi-ents within the probe, which might have led to significant error measuremgradi-ents (Clear-water et al., 1999). Application of published radial profiles of sap flow for Q.pubescens
5
( ˇCerm ´ak and Nadezhdina, 1998; ˇCerm ´ak et al., 1998) was refused because they show more variable shapes among individuals. In addition, the overestimation that theoreti-cally should result from considering the outer xylem sap velocity as constant along the entire sapwood of pubescent oak (Nadezhdina et al, 2002), does not suppose very high values of canopy transpiration, on the contrary, the observed values of
transpira-10
tion are lower than in other oak stands with similar structure (Br ´eda and Granier, 1996). It is possible, that, given the large radial sap flow gradients in this species, uncertainties derived from averaging sap flow density within the probe (Clearwater et al., 1999) and lack of sensitivity at high sap velocities (Lundblad et al., 2001), might counteract the effects of the abovementioned overestimation of transpiration. For example, David et
15
al. (2004) have recently found that the variation in sap velocity in a Quercus rotundifolia Lam. tree did not significantly affect the estimation of whole-tree sap flow.
Finally, sapwood delimitation is also a likely source of error in transpiration estimates from sap flow measurements. Whereas its distinction from differences in wood mois-ture content is recommended in conifers (Rust, 1999), measured radial profiles of sap
20
flow have been strongly recommended to delimit sapwood in oak species ( ˇCerm ´ak and Nadezhdina, 1998).
4.2. Differences in stand-level transpiration between pine and oak forests
Maximum stand transpiration rates measured for P.sylvestris lie near the upper limit for 20 to 60 year-old conifer stands, ca. 3.9 mm (Moore et al., 2004). Estimates of
25
stand transpiration in other similar Scots pine stands from central and northern Eu-rope are certainly lower than the values found in this study. Growing season values range from less than 100 mm (L ¨uttschwager et al., 1999) to an upper limit around
HESSD
2, 1011–1046, 2005Sap flow of montane pine and oak forests
in NE Spain R. Poyatos et al. Title Page Abstract Introduction Conclusions References Tables Figures J I J I Back Close
Full Screen / Esc
Print Version Interactive Discussion
EGU
300 mm (Jaeger and Kessler, 1996), the latter figure obtained as a long-term average. Modelling approaches yield values of yearly transpiration of about 230 mm in a Bel-gian stand (Meiresonne et al., 2003) or intervals for southern Europe forests between 200 and 450 mm year−1 (Berninger, 1997). Our results are more comparable to other Mediterranean pine forests. For example, Loustau et al. (1996) estimated a total
tran-5
spiration of 194 mm between June and August in a Pinus pinaster Ait. forest in Portugal (compare with the values in Table 3).
The low seasonal Ec/E T0 value found for the oak forest is slightly lower than the one predicted using the equation relating transpiration to potential evapotranspiration with LAI in Quercus petraea forests (ca. 0.25) in southern France (Br ´eda and Granier,
10
1996). Likewise, in a Q.pubescens forest in Italy with a considerably higher leaf area index (LAI=3.8 m2m−2), ˇCerm ´ak et al. (1998) found that Ec (214 mm in total, between May and October) was about 29% of E T0during the whole growing period, compared to 19% in this study. In view of these results, the combination of a lower LAI and the occurrence of a exceptionally dry summer may be responsible for the inferior Ec/E T0
15
in our stand.
Water balance components for the studied period of 2003 reveal a very tight hy-drological budget in the case of Scots pine. If we apply the bulk rainfall interception rates found in a similar nearby stand (24% of bulk precipitation; Llorens et al, 1997), net rainfall amounts to only ca. 150 mm, and therefore fails to supply the amount of
20
water transpired by the stand. Depletion of deep soil water and removal from stem storage (Waring et al., 1979) to meet the evaporative demand may have accounted for this difference. For instance, during the Julian days 214 to 228 (first half of August), when drainage can be assumed negligible, soil water balance in the upper 30 cm of the soil yielded estimates of evapotranspiration that were only 12–25% of the Ecmeasured
25
with sap flow sensors (data not shown). Unlike the Scots pine stand, bulk rainfall largely exceeded transpiration in the oak stand. Interception rates in similar oak forests in NW Spain (ca. 15% of rainfall; Moreno et al., 2001) are lower than the value found for Scots pine, but understorey interception and litter evaporation components may also be
im-HESSD
2, 1011–1046, 2005Sap flow of montane pine and oak forests
in NE Spain R. Poyatos et al. Title Page Abstract Introduction Conclusions References Tables Figures J I J I Back Close
Full Screen / Esc
Print Version Interactive Discussion
EGU
portant (Wilson et al., 2000). In addition, undestorey transpiration in the oak forest must account for a significant fraction of ecosystem evaporation. ˇCerm ´ak et al. (1998) found in a similar oak stand, with higher LAI (see this section), that understorey transpiration was ca. 15% of total stand transpiration (understorey plus overstorey). Therefore, the complete water balance would require some estimation of below canopy processes.
5
The higher reduction in matching the evaporative demand in Scots pine in com-parison to pubescent oak (Fig. 4) is in accordance with the present ecophysiological knowledge on both species. Whereas Scots pine has a strong stomatal control of tran-spiration under atmospheric and edaphic drought (Irvine et al., 1998), pubescent oak can stand lower water potentials and can be regarded as more drought-tolerant
(Nar-10
dini and Pitt, 1999; Zweifel et al., 2005). Extreme drought episodes have been found to produce more negative effects on the performance, and even the survival of Scots pine (Mart´ınez-Vilalta and Pi˜nol, 2002) than on other temperate deciduous oak species (Leuzinger et al., 2005).
4.3. Interanual variability and modelling of Scots pine transpiration
15
In Mediterranean mountain areas, summer storms usually buffer the effects of high evaporative demands, but these precipitations are highly variable both in time and space (Gallart et al., 2002), bringing about also a high variability in forest transpiration. Rainfall between June and September of 2003 (Table 4) was well below the long-term average value of ca. 330 mm (Latron, 2003). More specifically, precipitation between
20
June and August of 2003 (111 mm) was much less than the value recorded in 1998 (159 mm), considered an extremely dry year in NE Spain (Mart´ınez-Vilalta and Pi˜nol, 2002). This figures confirm the effects of the 2003 heat wave (Sch¨ar et al., 2004) on rainfall amounts in northern Spain. Despite that 2004 was much milder from the me-teorological point of view, a moderate depletion of the upper soil layers still occurred
25
(Table 4) which indicates that trees intensively extract water from the upper 30 cm of soil during an average year.
Transpiration dynamics was successfully modelled using only reference evapotran-1026
HESSD
2, 1011–1046, 2005Sap flow of montane pine and oak forests
in NE Spain R. Poyatos et al. Title Page Abstract Introduction Conclusions References Tables Figures J I J I Back Close
Full Screen / Esc
Print Version Interactive Discussion
EGU
spiration and soil moisture deficit as inputs in the Scots pine stand, although it was generally overestimated (Fig. 8). Despite that the most employed approach of mod-elling forest transpiration is the implementation of a canopy conductance model in the Penman-Monteith equation (e.g. Stewart, 1988), the model we used implicitly incor-porates the well-known stomatal closure at high vapour pressure deficits (Oren et al.,
5
1999), as the relationship between Ec,maxand E T0is logarithmic. The observed reduc-tion in Ec due to soil water stress is also similar to other functions found in the litera-ture (Lagergren and Lindroth, 2002), showing a soil moislitera-ture deficit threshold beyond which transpiration is strongly limited. There are some drawbacks, however, in using this simple model. Leaf area index is not included in the model and hence it should
10
be used in similar forest stands, and also, this approach is not as suitable to detect between-species differences in stomatal regulation due to vapour pressure deficit or soil moisture as, for example, the widely used Jarvis-type conductance model (Jarvis, 1976). However, data from sap flow experiments or flux towers could be used in sim-ilar parametrisations for different kinds of forests. Soil moisture deficit was derived in
15
this work from actual soil moisture measurements, although similar indices could be obtained solely from rainfall inputs (Oren and Pataki., 2001).
5. Conclusions
Transpiration in a montane Scots pine forest in NE Spain was twice the value found for a nearby pubescent oak stand. Higher sap velocities in the oak stand could not
20
compensate for the more than threefold difference in sapwood area with respect to the pine stand. The existing uncertainties in upscaling sap flow in ring-porous oaks could explain the differences in transpiration estimates. At the ecosystem level, though, a greater contribution of understorey transpiration and evaporation is expected in the oak stand.
25
Scots pine was found to be more sensitive to soil drought in the upper soil layers be-cause of its strong reduction in the response to atmospheric forcing, while pubescent
HESSD
2, 1011–1046, 2005Sap flow of montane pine and oak forests
in NE Spain R. Poyatos et al. Title Page Abstract Introduction Conclusions References Tables Figures J I J I Back Close
Full Screen / Esc
Print Version Interactive Discussion
EGU
oak transpiration was kept at a relatively constant fraction of evaporative demand dur-ing the dry summer period. These results confirm the general physiological behaviour of both species under drought conditions. The similar frequency of moderate soil mois-ture deficits (SMD>0.6) in the upper soil horizons during an average and a very dry summer, is indicative that the threshold of soil moisture which limits water extraction by
5
Scots pine is usually reached in these Mediterranean mountain forests.
Finally, the use of the boundary-line analysis with the quantile regression method yielded a satisfactory logarithmic relationship of Scots pine Ecagainst E T0, represent-ing the stomatal closure at high vapour pressure deficits, and, further combined with a soil moisture function, allowed us to calibrate a simple transpiration model only
depen-10
dent on evaporative demand and soil water status.
Acknowledgements. This research was supported by the projects PROHISEM (REN2001-2268-C02-01/HID), PIRIHEROS (REN2003-08768/HID) and CANOA (CGL2004-04919-C02-01), funded by the Spanish Ministerio de Ciencia y Tecnolog´ıa (MCYT)/Ministerio de Educaci´on y Ciencia (MEC). The Vallcebre research area also operates with support from the RESEL
net-15
work through an agreement between the CSIC and DGCONA. The first author benefited from a predoctoral FPI grant by the MCYT-MEC. The authors are indebted to all the members of the research group for their help with field work and data management.
References
Allen, R. G., Pereira, L.S., Raes, D., and Smith, M.: Crop evapotranspiration, Guidelines for
20
computing crop water requirements, FAO Irrigation and Drainage Paper No. 56, FAO, Rome, 290, 1998.
Baldocchi, D. D., Hicks, B. B., and Meyers, T. P.: Measuring biosphere-atmosphere exchanges of biologically related gases with micrometeorological methods, Ecology, 69, 5, 1331–1340, 1988.
25
Barb ´ero, M., Loisel, R., Qu ´ezel, P., Richardson, D. M., and Romane, F.: Pines of the Mediter-ranean Basin, in: Ecology and Biogeography of Pinus, edited by: Richardson, D. M., Cam-bridge University Press, CamCam-bridge, 153–170, 1998.
HESSD
2, 1011–1046, 2005Sap flow of montane pine and oak forests
in NE Spain R. Poyatos et al. Title Page Abstract Introduction Conclusions References Tables Figures J I J I Back Close
Full Screen / Esc
Print Version Interactive Discussion
EGU
Berninger, F.: Effects of drought and phenology on GPP in Pinus sylvestris: a simulation study along a geographical gradient, Funct. Ecol., 11, 33–42, 1997.
Br ´eda, N., Cochard, H., Dreyer, E., and Granier, A.: Water transfer in a mature oak stand (Quercus petraea): seasonal evolution and effects of a severe drought, Can. J. For. Res., 23, 1136–1143, 1993.
5
Br ´eda, N. and Granier, A.: Intra- and interannual variations of transpiration, leaf area index and radial growth of a sessile oak stand (Quercus petraea), Ann. For. Sci., 53, 521–536, 1996. Cade, B. S. and Noon, B. R.: A gentle introduction to quantile regression for ecologists, Front.
Ecol. Environ., 1, 8, 412–420, 2003.
Ceballos, L., Ruiz de la Torre, J.: ´Arboles y arbustos de la Espa ˜na peninsular, ETSIM, Madrid,
10
514, 1979. ˇ
Cerm ´ak, J., Nadezhdina, N., Raschi, A., and Tognetti, R.: Sap flow in Quercus pubescens and Quercus cerris stands in Italy, in: 4th International Workshop on Measuring Sap Flow in Intact Plants, Zidlochovice, Czech Republic, IUFRO Publications, Publishing house of Mendel University, 1998.
15
ˇ
Cerm ´ak, J. and Nadezhdina, N.: Sapwood as the scaling parameter-defining according to xylem water content or radial pattern of sap flow?, Ann. For. Sci., 55, 509–521, 1998. ˇ
Cerm ´ak, J., Kucera, J., and Nadezhdina, N.: Sap flow measurements with some thermody-namic methods, flow integration within trees and scaling up from sample trees to entire forest stands, Trees, 18, 529–546, 2004.
20
Chambers, J. L., Hinckley, T. M., Cox, G. S., Metcalf, C. L., and Aslin, R. G.: Boundary-line analysis and models of leaf conductance for four oak-hickory forest species, Forest Science, 31, 2, 437–450, 1985.
Clearwater, M. J., Meinzer, F. C., Andrade, J. L., Goldstein, G., and Holbrook, N. M.: Potential errors in measurement of nonuniform sap flow using heat dissipation probes, Tree Physiol.,
25
19, 681–687, 1999.
David, T. S., Ferreira, M. I., Cohen, S., Pereira, J. S., and David, J. S.: Constraints on tran-spiration from an evergreen oak tree in southern Portugal, Agric. For. Meteorol., 122, 3–4, 193–205, 2004.
Denmead , O. T., Dunin, F. X., Wong, S. C., and Greenwood, E. A. N.: Measuring water
30
use efficiency with chambers and micrometeorological techniques, J. Hydrol., 150, 649–664, 1993.
HESSD
2, 1011–1046, 2005Sap flow of montane pine and oak forests
in NE Spain R. Poyatos et al. Title Page Abstract Introduction Conclusions References Tables Figures J I J I Back Close
Full Screen / Esc
Print Version Interactive Discussion
EGU
Tree species effects on stand transpiration in northern Wisconsin, Water Resour. Res., 38, 7, 1–11, 2002.
Ewers, B. E. and Oren, R.: Analyses of assumptions and errors in the calculation of stomatal conductance from sap flux measurements, Tree Physiol., 20, 579–589, 2000.
Ford, C. R., Maguire, M. A., Mitchell, R. J., and Teskey, R. O.: Assessing variation in the radial
5
profile of sap flux density in Pinus species and its effects on daily water use, Tree Physiol., 24, 241–249, 2004.
Gallart, F. and Llorens, P.: Observations on land cover changes and water resources in the headwaters of the Ebro catchment, Iberian Peninsula, Phys. Chem. Earth Parts A/B/C, 29, 11–12, 769–773, 2004.
10
Gallart, F., Llorens, P., Latron, J., and Reg ¨u ´es, D.: Hydrological Processes and their seasonal controls in a small Mediterranean mountain catchment in the Pyrenees, Hydrol. Earth Sys. Sci., 6, 3, 527–537, 2002,SRef-ID: 1607-7938/hess/2002-6-527.
Granier, A.: Une nouvelle m ´ethode pour la mesure du flux de s `eve brute dans le tronc des arbres, Ann. For. Sci., 3, 309–320, 1985.
15
Granier, A.: Evaluation of transpiration in a Douglas-fir stand by means of sap flow measure-ments, Tree Physiol., 3, 309–320, 1987.
Granier, A., Anfodillo, T., Sabatti, M., Cochard, H., Dreyer, E., Tomasi, M., Valentini, R., and Br ´eda, N.: Axial and radial water flow in the trunk of oak trees: a quantitative and qualitative analysis, Tree Physiol., 14, 1383–1396, 1994.
20
Granier, A., Biron, P., Br ´eda, N., Pontailler, J. Y., and Saugier, B.: Transpiration of trees and for-est stands: short and long-term monitoring using sapflow methods, Global Change Biology, 2, 265–274, 1996.
Granier, A. and Loustau, D.: Measuring and modelling the transpiration of a maritime pine canopy from sap-flow data, Agric. For. Meteorol., 71, 61–81, 1994.
25
Hatton, T. J. and Wu, H. I.: Scaling theory to extrapolate individual tree water use to stand water use, in: Scale issues in hydrological modelling, edited by: Kalma, J. D. and Sivapalan, M., John Wiley & Sons, New York, 504, 1995.
Irvine, J., Perks, M. P., Magnani, F., and Grace, J.: The response of Pinus sylvestris to drought: stomatal control of transpiration and hydraulic conductance, Tree Physiol., 18, 393–402,
30
1998.
Jaeger, L. and Kessler, A.: The HartX period May 1992, seen against the background of twenty years of energy balance climatology at the Hartheim pine plantation, Theor. App. Climatol.,
HESSD
2, 1011–1046, 2005Sap flow of montane pine and oak forests
in NE Spain R. Poyatos et al. Title Page Abstract Introduction Conclusions References Tables Figures J I J I Back Close
Full Screen / Esc
Print Version Interactive Discussion
EGU
53, 9–21, 1996.
Jarvis, P. G.: The interpretation of the variations in leaf water potential and stomatal conduc-tance found in canopies in the field, Philos. Trans. R. Soc. London B, 273, 593–610, 1976. Koenker, R. and Basset, G.: Regression quantiles. Econometrica, 46, 33–50, 1978.
K ¨ostner, B., Biron, P., Siegwolf, R. and Granier, A.: Estimates of water vapor flux and canopy
5
conductance of Scots pine at the tree level utilizing different xylem sap flow methods, Theor. Appl. Climatol., 53, 105–113, 1996.
K ¨ostner, B., Schulze, E. D., Kelliher, F. M., Hollinger, D. Y., Byers, J. N., Hunt, J. E., McSeveny, T. M., Meserth, R., and Weir, P. L.: Transpiration and canopy conductance in a pristine broad-leaved forest of Nothofagus: an analysis of sapflow and eddy correlation measurements,
10
Oecologia, 91, 350–359, 1992.
Kravka, M., Krejzar, T., and ˇCerm ´ak, J.: Water content in stem wood of large pine and spruce trees in natural forests in central Sweden, Agr. For. Met., 98–99, 555–562, 1999.
Ladekarl, U. L.: Estimation of the components of soil water balance in a Danish oak stand from measurements of soil moisture using TDR, For. Ecol. Manage, 104, 1–3, 227–238, 1998.
15
Lagergren, F. and Lindroth, A.: Transpiration response to soil moisture in pine and spruce trees in Sweden, Agric. For. Meteorol., 112, 2, 67–85, 2002.
Leuzinger, S., Zotz, G., Asshoff, R., and K¨orner, C.: Responses of deciduous forest trees to severe drought in Central Europe, Tree physiology, 25, 641–650, 2005.
Llorens, P., Poch, R., Latron, J., and Gallart, F.: Rainfall interception by a Pinus sylvestris forest
20
patch overgrown in a Mediterranean mountainous abandoned area I., Monitoring design and results down to the event scale, J. Hydrol., 199, 331–345, 1997.
Loustau, D., Berbigier, P., Roumagnac, P., Arruda-Pacheco, C., David, J. S., Ferreira, M. I., and Tavares, R.: Transpiration of a 64-year-old maritime pine stand in Portugal, 1. Seasonal course of water flux through maritime pine, Oecologia, 107, 33–42, 1996.
25
Lundblad, M., Lagergen, F., and Lindroth, A.: Evaluation of heat balance and heat dissipation methods for sapflow measurements in pine and spruce, Ann. For. Sci., 58, 625–638, 2001. L ¨uttschwager, D., Rust, S., Wulf, M., Forkert, J., and H ¨uttl, R.F.: Tree canopy and herb layer
transpiration in three Scots pine stands with different stand structures, Ann. For. Sci., 56, 265–274, 1999.
30
Martin, T. A., Brown, K. J., ˇCerm ´ak, J., Ceulemans, R., Kucera, J., Meinzer, F. C., Rombold, J. S., Sprugerl, D. G., and Hinckley, T. M.: Crown conductance and tree and stand transpiration in a second-growth Abies amabilis forest, Can. J. For. Res., 27, 797–808, 1997.
HESSD
2, 1011–1046, 2005Sap flow of montane pine and oak forests
in NE Spain R. Poyatos et al. Title Page Abstract Introduction Conclusions References Tables Figures J I J I Back Close
Full Screen / Esc
Print Version Interactive Discussion
EGU
Mart´ınez-Vilalta, J. and Pi˜nol, J.: Drought-induced mortality and hydraulic architecture in pine populations of the NE Iberian Peninsula, For. Ecol. Manage, 155, 2–3, 127–147, 2002. Meiresonne, L., Sampson, D. A., Kowalski, A. S., Janssens, I. A., Nadezhdina, N., Cermak, J.,
Van Slycken, J., and Ceulemans, R.: Water flux estimates from a Belgian Scots pine stand: a comparison of different approaches, J. Hydrol., 270, 3–4, 230–252, 2003.
5
Monteith, J. L.: Evaporation and environment, in: The state and movement of water in living or-ganisms, Proceedings of the 19th Symposium, Society for Experimental Biology, Cambridge University Press, 1965.
Moore, G. W., Bond, B. J., Jones, J. A., Phillips, N., and Meinzer, F. C.: Structural and compo-sitional controls on transpiration in 40- and 450-year-old riparian forests in western Oregon,
10
USA, Tree Physiol., 24, 481–491, 2004.
Moreno, G., Gallardo, J. F., and Bussotti, F.: Canopy modification of atmospheric deposition in oligotrophic Quercus pyrenaica forests of an unpolluted region (central-western Spain), For. Ecol. Manage, 149, 1–3, 47–60, 2001.
Nadezhdina, N., ˇCerm ´ak, J., and Ceulemans, R.: Radial patterns of sap flow in woody stems
15
of dominant and understory species: scaling errors associated with positioning of sensors, Tree Physiol., 22, 907–918, 2002.
Nardini, A. and Pitt, F.: Drought resistance of Quercus pubescens as a function of root hydraulic conductance, xylem embolism and hydraulic architecture, New Phytol., 143, 485–493, 1999. Oliveras, I. and Llorens, P.: Medium-term sap flux monitoring in a Scots pine stand: analysis
20
of the operability of the heat dissipation method for hydrological purposes, Tree Physiol., 21, 473–480, 2001.
Oren, R. and Pataki, D. E.: Transpiration in response to variation in microclimate and soil moisture in southeastern deciduous forests, Oecologia, 127, 549–559, 2001.
Oren, R., Sperry, J. S., Katul, G. G., Pataki, D. E., Ewers, B. E., Phillips, N., and Sch ¨afer, K. V.
25
R.: Survey and synthesis of intra- and interspecific variation in stomatal sensitivity to vapour pressure deficit, Plant Cell Environ., 22, 12, 1515–1526, 1999.
Pi ˜nol, J., `Avila, A., and Escarr ´e, A.: Water Balance in catchments, in: Ecology of Mediter-ranean Evergreen Oak Forests, edited by: Rod `a, F., Retana, J., Gracia, C. A., and Bellot, J., Springer-Verlag, Ecological Studies Vol., 137, 273–282, 1999.
30
Poyatos, R., Latron, J., and Llorens, P.: Land-Use and Land-Cover change after agricultural abandonment, The case of a Mediterranean Mountain Area (Catalan Pre-Pyrenees), Mt. Res. Dev., 23, 4, 52–58, 2003.
HESSD
2, 1011–1046, 2005Sap flow of montane pine and oak forests
in NE Spain R. Poyatos et al. Title Page Abstract Introduction Conclusions References Tables Figures J I J I Back Close
Full Screen / Esc
Print Version Interactive Discussion
EGU
Rust, S.: Comparison of three methods for determining the conductive xylem area of Scots pine (Pinus sylvestris), Forestry, 72, 2, 103–108, 1999.
Sahin, V. and Hall, M.J.: The effects of afforrestation and deforestation on water yields, J. Hydrol., 178, 1, 293–309, 1996.
Saugier, B., Granier, A., Pontailler, J. Y., Dufr ˆene, E., and Baldocchi, D. D.: Transpiration of
5
a boreal pine forest measured by branch bag, sap flow and micrometeorological methods, Tree Physiol., 17, 511–519, 1997.
Sch ¨ar, C., Vidale, P. L., Luthi, D., Frei, C., Haberli, C., Liniger, M. A., and Appenzeller, C.: The role of increasing temperature variability in European summer heat waves, Nature, 427, 332–336, 2004.
10
Smith, D. and Allen, S.: Measurement of sap flow in plant stems, J. Exp. Bot., 47, 305, 1833– 1844, 1996.
Stewart, J. B.: Modelling surface conductance of pine forest, Agric. For. Meteorol., 43, 19–35, 1988.
Swanson, R. H.: Significant historical developments in thermal methods for measuring sap flow
15
in trees, Agric. For. Meteorol., 113–132, 1994.
Waring, R. H., Whitehead, D., and Jarvis, P. G.: The contribution of stored water to transpiration in Scots pine, Plant Cell Environ., 2, 309–317, 1979.
Wilson, K. B., Hanson, P. J., and Baldocchi, D. D.: Factors controlling evaporation and energy partitioning beneath a deciduous forest over an annual cycle, Agric. For. Meteorol., 102, 2–3,
20
83–103, 2000.
Wilson, K. B., Hanson, P. J., Mulholland, P. J., Baldocchi, D. D., and Wullschleger, S. D.: A comparison of methods for determining forest evapotranspiration and its components: sap-flow, soil water budget, eddy covariance and catchment water balance, Agric. For. Meteorol., 106, 2, 153–168, 2001.
25
Zweifel, R., Zimmerman, L., and Newberry, D. M.: Modeling tree water deficit from microclimate: an approach to quantifying drought stress, Tree Physiol., 25, 147–156, 2005.
HESSD
2, 1011–1046, 2005Sap flow of montane pine and oak forests
in NE Spain R. Poyatos et al. Title Page Abstract Introduction Conclusions References Tables Figures J I J I Back Close
Full Screen / Esc
Print Version Interactive Discussion
EGU Table 1. Stand characteristics of the Pinus sylvestris and Quercus pubescens experimental
plots. DBH is diameter at breast height, AS : AG is sapwood area per ground area and LAImax
is maximum leaf area index.
P.sylvestris Q.pubescens Density (trees ha−1) 2165 828 DBH (cm) 15.2±5.8* 21.1±7.4* Basal area (m2ha−1) 44.7 32.5 Height (m) 11.0±1.4* 10.6±2.8* LAImax (m2m−2) 2.4 2.1 AS:AG (m2ha−1) 37.0 9.7
*mean ± standard deviation.
HESSD
2, 1011–1046, 2005Sap flow of montane pine and oak forests
in NE Spain R. Poyatos et al. Title Page Abstract Introduction Conclusions References Tables Figures J I J I Back Close
Full Screen / Esc
Print Version Interactive Discussion
EGU Table 2. Measured atmospheric and soil variables and their corresponding sensors in the
studied plots. P.sylvestris Q.pubescens Variable Abbreviation and units Sensor Air temperature Relative humidity T (◦C) RH (%) HMP35AC, Vaisala (Vantaa, Finland) HMP35C, Vaisala (Vantaa, Finland)
Net radiation Rn(W m−2) NR-Lite, Kipp & Zonen (Delft, The Netherlands) Wind speed u (m s−1) A100R, Vector Instruments
(Rhyl, UK)
Wind direction degrees 6504, Unidata
(O’Connor, Australia) Soil moisture θ (cm3cm−3) CS615, Campbell
Sci-entific (Leicestershire, UK)
Soil temperature Tsoi l ( ◦
C) Termsistor
Precipitation P (mm) Tipping Bucket Pluviometer AW-P, Institut Anal´ıtic (Barcelona, Spain)*
Global shortwave radiation
Rg(W m−2) SP110 Pyranometer, Skye Instuments (Powys, UK)*
HESSD
2, 1011–1046, 2005Sap flow of montane pine and oak forests
in NE Spain R. Poyatos et al. Title Page Abstract Introduction Conclusions References Tables Figures J I J I Back Close
Full Screen / Esc
Print Version Interactive Discussion
EGU Table 3. Parameters of the Ec–E T0curve (Eq. 1) under different soil moisture regimes (Fig. 6).
95% confidence intervals are shown between brackets.
SMD a b R2
P.sylvestris < 0.8 5.18** (1.35, 9.00) 0.16* (0.01, 0.31) 0.85 > 0.8 1.49** (1.34, 1.65) 0.62** (0.35, 0.88) 0.44 Q.pubescens < 0.8 1.49** (1.20, 1.79) 0.42** (0.26, 0.58) 0.84 > 0.8 0.96** (0.90, 1.03) 0.68** (0.46, 0.89) 0.56 t-test significance levels: ** p<0.01; * p<0.05.
HESSD
2, 1011–1046, 2005Sap flow of montane pine and oak forests
in NE Spain R. Poyatos et al. Title Page Abstract Introduction Conclusions References Tables Figures J I J I Back Close
Full Screen / Esc
Print Version Interactive Discussion
EGU Table 4. Comparative amounts of transpiration (Ec), reference evapotranspiration (E T0) and
precipitation (P ) in the Scots pine stand for the periods comprising days 154–274 (June to September) of 2003 and 2004. Percentage of days with high vapour pressure deficits (Dd) and
soil moisture deficits (SMD) are also shown.
Year Totals Evaporative fractions % of days with
Ec E T0 P Ec/ET0 Ec/P Dd >1.5 kPa SMD>0.6 SMD>0.8
2003 220 493 186 0.45 1.18 36 68 52
HESSD
2, 1011–1046, 2005Sap flow of montane pine and oak forests
in NE Spain R. Poyatos et al. Title Page Abstract Introduction Conclusions References Tables Figures J I J I Back Close
Full Screen / Esc
Print Version Interactive Discussion
EGU Table 5. Parameters of the transpiration model (Eqs. 2, 3) and their correspondent 95 %
confidence intervals (between brackets). For parameters obtained through quantile regression, 90% confidence interval is shown.
a b k1 k2 P.sylvestris 1.34 (1.22, 4.03) 1.25 (−0.10, 1.38) 1.22·10−3 (−1.95.10−3, 2.63.10−3) 6.23** (5.07, 7.52) t-test significance levels: ** p<0.01; * p<0.05.
HESSD
2, 1011–1046, 2005Sap flow of montane pine and oak forests
in NE Spain R. Poyatos et al. Title Page Abstract Introduction Conclusions References Tables Figures J I J I Back Close
Full Screen / Esc
Print Version Interactive Discussion EGU 10 15 20 25 30 DBH (cm) 0.0 0.2 0.4 0.6 0.8 1.0 0 5 10 15 20 Ac (m2) 0.0 0.2 0.4 0.6 0.8 1.0 υmax ( dm 3 dm -2 h -1)
a
b
Fig. 1. Relationship between maximum sap velocity (νmax) and(a) DBH and (b) crown projected
area (Ac) for P.sylvestris. Individual trees are grouped in integer categories of the independent
variable. Points are means, boxes are standard errors and whiskers are 95% confidence inter-vals.
HESSD
2, 1011–1046, 2005Sap flow of montane pine and oak forests
in NE Spain R. Poyatos et al. Title Page Abstract Introduction Conclusions References Tables Figures J I J I Back Close
Full Screen / Esc
Print Version Interactive Discussion EGU 160 200 240 280 Day of year 2003 0 400 800 1200 1600 Qs (l m -2 sap w ood a rea d ay -1)
Figure 2. Seasonal evolution of sap flow per sapwood area (Q
s) in P.sylvestris (closed
symbols) and Q.pubescens (open symbols), showing the mean value of the individual
trees plus one standard error.
35
Fig. 2. Seasonal evolution of sap flow per sapwood area (Qs) in P.sylvestris (closed symbols)
and Q.pubescens (open symbols), showing the mean value of the individual trees plus one standard error.
HESSD
2, 1011–1046, 2005Sap flow of montane pine and oak forests
in NE Spain R. Poyatos et al. Title Page Abstract Introduction Conclusions References Tables Figures J I J I Back Close
Full Screen / Esc
Print Version Interactive Discussion EGU 0.2 0.3 0.4 V o lu m e tr ic w a te r f ra c ti o n ( fw ) 0 20 40 60 80 100
% Xylem radius from cambium 0.2 0.3 0.4 0.5 0.6 Sapwood P.sylvestris, DBH=11.60 cm DBH=22.50 cm Q.pubescens, Cambium a b
Fig. 3. Examples of fractional volumetric water content variation with depth in (a) P.sylvestris,
showing identification of conductive sapwood, and(b) Q.pubescens. Closed and open symbols
HESSD
2, 1011–1046, 2005Sap flow of montane pine and oak forests
in NE Spain R. Poyatos et al. Title Page Abstract Introduction Conclusions References Tables Figures J I J I Back Close
Full Screen / Esc
Print Version Interactive Discussion EGU 0.0 1.0 2.0 3.0 Dd (K P a ) 100 200 300 400 Rn (W m -2) 30.0 20.0 10.0 0.0 Precipitation (m m day -1) 1.0 2.0 3.0 Ec (m m d a y -1)
19 May 8 Jun 28 Jun 18 Jul 7 Aug 27Aug 16 Set 6 Oct
Day of Year 2003 0.0 0.2 0.4 0.6 0.8 1.0 Ec /E T0 0.20 0.30 0.40 (c m 3 cm -3)
Fig. 4. Seasonal evolution of environmental variables and canopy transpiration of Scots pine
(closed symbols) and pubescent oak (open symbols). Rn is net radiation, Dd daytime vapor
pressure deficit, Ecstand transpiration, Ec/E T0relative transpiration and θ is soil moisture in
the upper 30 cm. Daily soil moisture is shown for the pine plot (full line) and weekly values for the oak plot (open symbols).
HESSD
2, 1011–1046, 2005Sap flow of montane pine and oak forests
in NE Spain R. Poyatos et al. Title Page Abstract Introduction Conclusions References Tables Figures J I J I Back Close
Full Screen / Esc
Print Version Interactive Discussion
EGU
8-Jun 18 Jul 27 Aug 6 Oct
Day of year 2003 0 200 400 600 Cumulative ET 0 , E C , P (mm) ET0 P EC Pinus sylvestris EC Quercus pubescens
Fig. 5. Cumulative values of precipitation (P ), stand transpiration (Ec) and reference
(E T0)evapotranspiration during the studied period in 2003 for the Scots pine and the pubescent oak stands. E T0is only shown for the Scots pine plot.
HESSD
2, 1011–1046, 2005Sap flow of montane pine and oak forests
in NE Spain R. Poyatos et al. Title Page Abstract Introduction Conclusions References Tables Figures J I J I Back Close
Full Screen / Esc
Print Version Interactive Discussion EGU 0 1 2 3 4 5 6 7 0.0 0.5 1.0 1.5 2.0 2.5 3.0 3.5 P.sylvestris a Ec (mm day -1) ET0 (mm day -1 ) 0 1 2 3 4 5 6 7 0.0 0.5 1.0 1.5 2.0 2.5 3.0 3.5 Q.pubescens b
Fig. 6. Relationship of canopy transpiration Ec and reference evapotranspiration E T0 under
different soil moisture regimes (SMD<0.8, closed symbols, and SMD>0.8, open symbols), for Scots pine(a) and pubescent oak (b). For fitted curves and parameter values see Table 4.
HESSD
2, 1011–1046, 2005Sap flow of montane pine and oak forests
in NE Spain R. Poyatos et al. Title Page Abstract Introduction Conclusions References Tables Figures J I J I Back Close
Full Screen / Esc
Print Version Interactive Discussion EGU 0 2 4 6 8 ET o(mmday -1 ) 0 0.5 1 1.5 2 2.5 3 3.5 4 EC (m m day -1) 0 0.2 0.4 0.6 0.8 1 SMD 0.2 0.4 0.6 0.8 1 1.2 EC /E c, m a x a b
Fig. 7. Calibration of the transpiration model for Scots pine (Eqs. 2 and 3), showing data points
and fitted curves. (a) Boundary line relationships of Ec against reference evapotranspiration
HESSD
2, 1011–1046, 2005Sap flow of montane pine and oak forests
in NE Spain R. Poyatos et al. Title Page Abstract Introduction Conclusions References Tables Figures J I J I Back Close
Full Screen / Esc
Print Version Interactive Discussion EGU 0 1 2 3 4 Ec (m m d a y -1)
8 Jun 18 Jul 27 Aug 6 Oct
Day of year 0 1 2 3 Ec ET0-model Ec observed 2003 2004
Fig. 8. Seasonal course of measured daily P.sylvestris stand transpiration (Ec) from sap flow
measurements and modelled Ecduring 2003 and 2004 study periods.