HAL Id: hal-01445226
https://hal.archives-ouvertes.fr/hal-01445226
Submitted on 24 Jan 2017
HAL is a multi-disciplinary open access
archive for the deposit and dissemination of
sci-entific research documents, whether they are
pub-lished or not. The documents may come from
teaching and research institutions in France or
abroad, or from public or private research centers.
L’archive ouverte pluridisciplinaire HAL, est
destinée au dépôt et à la diffusion de documents
scientifiques de niveau recherche, publiés ou non,
émanant des établissements d’enseignement et de
recherche français ou étrangers, des laboratoires
publics ou privés.
Action boundaries detection in a video
Hassan Wehbe, Bassem Haidar, Philippe Joly
To cite this version:
Hassan Wehbe, Bassem Haidar, Philippe Joly. Action boundaries detection in a video. Multimedia
Tools and Applications, Springer Verlag, 2015, vol. 75 (n° 14), pp. 8239-8266.
�10.1007/s11042-015-2748-5�. �hal-01445226�
Open Archive TOULOUSE Archive Ouverte (OATAO)
OATAO is an open access repository that collects the work of Toulouse researchers and
makes it freely available over the web where possible.
This is an author-deposited version published in :
http://oatao.univ-toulouse.fr/
Eprints ID : 17233
To link to this article : DOI:10.1007/s11042-015-2748-5
URL :
http://dx.doi.org/10.1007/s11042-015-2748-5
To cite this version :
Wehbe, Hassan and Haidar, Bassem and Joly, Philippe
Action boundaries detection in a video. (2015) Multimedia Tools and
Applications, vol. 75 (n° 14). pp. 8239-8266. ISSN 1380-7501
Any correspondence concerning this service should be sent to the repository
administrator:
[email protected]
Action boundaries detection in a video
Hassan WEHBE*, Bassem HAIDAR**, Philippe JOLY** IRIT – Toulouse University, 118 route de Narbonne, 31062 Toulouse Cedex 9, France
** Lebanese University, Faculty of sciences, Hadath – Beirut, Lebanon
[email protected], [email protected], [email protected]
Abstract
In the video analysis domain, automatic detection of actions performed in a recorded video represents an important scientific and industrial challenge. This paper presents a new method to approximate the boundaries of actions performed by a person while interacting with his environment (such as moving objects). This method relies on a Codebook quantization method to analyze the rough evolution of each pixel and then decide whether this evolution corresponds to an action or not; this decision is taken by an automated system. Statistics are then produced - at the scale of the whole frame - to estimate the start and the end of an action. According to our proposed evaluation protocol, this method produces interesting results on both real and simulated videos. This statistic-based protocol is discussed at the end of this paper. The interpretation of this evaluation protocol nominates this method to be a solid base to localize the exact boundaries of actions or - in the framework of this research activity - to associate prescriptive text with a visual content.
Keywords: Video analysis, Action detection, Segmentation, Codebook quantization
1. Introduction
We consider video recordings where a human operator is performing a sequence of actions. At the end of this paper, we will be able to determine the beginnings and the endings (called boundaries) of these actions automatically. In our targeted application, those actions are performed by an operator on the original scene (called background). Therefore, our goal consists of segmenting actions that modify the operator’s environment for a while. From an image processing point of view, stationary objects in a video scene are considered as belonging to the background. However, only moving objects are generally considered as belonging to the foreground. Some problems may occur in defining an object state when it starts moving or definitely stops in the field of the camera. This is typically the case faced by automatic analysis tools applied to car park surveillance videos. In our works, we consider actions that change the state of objects in the scene (bringing them from the background to the foreground and/or vice-versa).
Our corpus consists in a set of textual descriptions of action sequences and their recorded executions (the application of these actions). This kind of data finds some concrete applications, for example in the domain of
technical maintenance of devices. In this context, technicians usually refer to handling books which are sets of instructions to be followed to repair a given material. Making a video recording of the work can be in some cases a way to collect the technician’s know-how or to prove that the work is made in respect of the guidelines.
In general, an action in such a video is a modification made by someone in the background. Figure 1 is a real-world example of an action consisting of changing an object’s location in the scene. In this case, the acting detaches the object from the background for a while, and then re-attaches it to the background again, but at another location. Identifying the start and the end of an action is done by finding specific changes that are different from all other modifications in the scene.
Figure 1: Example of an action.
Related works in this domain concentrate on the background subtraction which permits them to focus on moving objects in the foreground plan. However, not much attention is paid to modifications made on this plan (background). Some of these works will be presented in the state of art chapter. Later in section 3, we will introduce a method aiming to quantify pixels colors. Based on its results, we will propose a method to detect actions boundaries in a video. The obtained results are presented, analyzed and evaluated in section 4. Finally, the conclusion shows the future works in this context.
2. State of art
2.1. Event detection in videos
Detecting the boundaries of certain events in a video is an old need. In sport domain, the detection of scorings, for example, is a key to extract important moments in the matches. Gong et al. [6] proposed an approach for soccer video parsing, based on location recognition and ball presence detection. A similar work, for tennis video, is done by Sudhir et al. [7], they used court line detection and player tracking to extract tennis play events. However, Rui et al. [8] presented a system for baseball-video highlight detection. In addition to visual contents, these systems based on audio contents to detect the excited speech and pitch hit detection. For baseball games, Zhang and Chang [9] proposed an advanced method that detects the events - score and last pitch - and their boundaries in a baseball video. Events are localized based on the text appearing on the screen as score box. Then, they based on this information to detect the events boundaries. First, these works try to detect events that do not affect the scene (like scores). Second, they base on text information showing on the scene (like score and time box) to detect the events and their boundaries. This feature exists only in sport videos where they always contain text and audio information reflecting the video events.
Corresponding text: Move the chair from the left to the right of the scene.
2.2. Foreground/Background segmentation
It is important to mention that, in this article, we do not propose or enhance a foreground/background segmentation method; however we will use an already existed quantization method (originally proposed and tested by KIM et al. [1] in its approach to create a background model) to construct a model that collects all distinct quantified values taken by a pixel in the video (background and foreground values). Other quantization techniques may be used (instead of the Codebook technique) as our action boundaries detection system is independent of the method used to construct the model. Later, this model will be integrated in a proposed method to detect actions boundaries in a video. In this section we will present in-brief some famous works that perform a foreground/background segmentation based on background modeling and background subtraction in order to choose the best quantization technique that fits our needs. However, readers are invited to refer to Subudhi et al. [15] and Bouwmans et al. [16] for in-depth discussion and comparison of the popular background/foreground segmentation techniques based on background modeling.
Detecting the modification on the background is a research topic in the image analysis domain. Most of actual works concentrate on the subtraction of this plan in order to track or analyze objects in foreground plan for many reasons. Most of these works are based on one of the two following techniques: mixtures of Gaussians and Codebooks. First, approaches based on Gaussian distributions consist in constructing a background model for each pixel using one Gaussian distribution to model its possible color/intensity evolution in the scene (generally due to various sources of noise or to lightning conditions) (Wren et al. [11] and Horprasert et al. [12]). This method showed good results when the background does not get modified during the video, but it did not in other cases (wind swinging trees, rain, etc…). Based on these results, this method gave birth to more efficient methods that use multiple Gaussians (Stauffer and Grimson [3]) or non-parametric distributions (Kim et al. [1], Elgammal et al. [2], and Leykin et al. [10]). The modifications proposed by Stauffer and Grimson [3] on the main method consist of modeling the values of a particular pixel as a mixture of Gaussians rather than explicitly modeling the values of all pixels as one particular type of distribution. Pixel values that do not fit the background distribution are considered as “foreground”. On the other side, some authors preferred to use a non-parametric distribution allowing a dynamic modeling; this model is extended, when necessary, to accommodate the complexity of data. On the other hand, the original codebook method proposed by KIM et al. [1] was, according to the authors, faster and more powerful than the Mixture of Gaussian (Stauffer and Grimson [3]) and the non-parametric kernel based (Elgammal et al. [2]) methods. The wide range of works inspired from this method since 2005 (Leykin et al. [10], Cucchiara et al. [13] and Fihl et al. [14]) have proved the opinion of the authors. Each of these works added its own parameters to optimize the performance and the speed of the method. Sigari and Fathy [5] proposed the use of two codebooks instead of one: main and temporary. These codebooks are constructed by adding the following idea to the original codebook construction: if a value does not belong to any codeword in the main codebook, then this value is considered as a part of the foreground plan, and it is added to the temporary codebook. Therefore, the temporary codebook is filtered according to predefined rules before adding the appropriate codewords to the main codebook periodically. On the other hand, Geng [4] modified the Codebook representation and structure in order to optimize the calculation and the periodic update of the model. In addition, the authors created two
codebooks by pixel, the first fits the codewords of stationary background; the second contains the codewords of foreground plan and the modified background.
As our goal is to detect and to identify the start and the end of actions executed in the background, our work will be concentrated only on this plan by eliminating all information related to the foreground. This can be done by, first, subtracting the information of the foreground in each frame, and then by analyzing the background states along the video. While the second step will be discussed later, the first one will be described in this section. As we mentioned above, several good methods aiming to subtract the background from a scene using a background model exist, which makes the choice of the best one a hard job. For this reason, we will propose in this paper a method that do not base on any background subtraction technique. Instead, we will refer on a quantization technique to create a compressed form collecting all historical values of pixels (background and foreground). Later, this form (model) will be used to analyze the behavior of pixels along the video and then find the boundaries of actions. Among the quantization techniques, we are interested in the Codebook-based method proposed by KIM et al. [1] that shows good performance according to the authors. These results are proved later by Rodriguez-Gomez et al. [21] and Szwoch et al. [22] who compared various implementations of background subtraction systems. In their works, they define metrics to compare the efficiencies of such systems in terms of resources. As a result, they deduce that the Codebook-based background subtraction technique is the more effective method. While he proposed this method to perform a foreground/background segmentation, we will use it to quantify all historical pixels values into one model per pixel. However, the model creation and update procedure will not be used as it is, some modifications will take place to avoid codeword collisions.
2.2.1. Codebook construction method of KIM et al. [1]
The Codebook is a quantization technique that creates a compressed form (model) of the background. A Codebook is formed by a set of codewords; each one represents a subset of values. This model provides a way to work with a finite collection of values (set of codewords) instead of an infinite one (RGB color values). In order to take in consideration the global and local illumination changes such as shadows and highlights, “samples at each pixel are clustered into the set of codewords based on a color distortion metric together with brightness bounds, and then the model is encoded on a pixel-by-pixel basis”. A codebook is created for each pixel to enclose its values along the video.
2.2.2. Codebook and Codeword representation
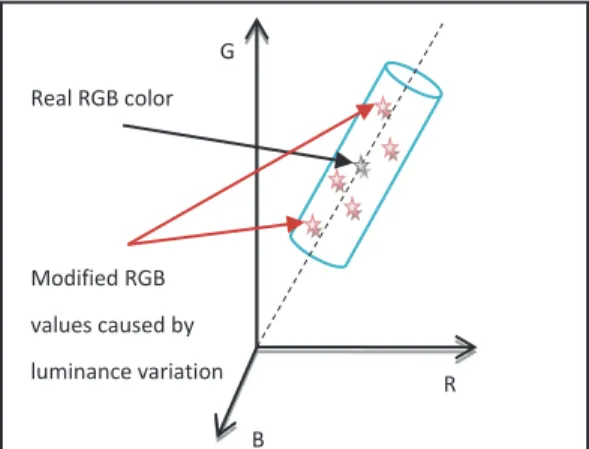
As mentioned above, a pixel codebook is a set of codewords. Each codeword must represent a cluster of RGB colors that are the modified values, of a real RGB value of a pixel. These modifications are caused by brightness and illumination changes. In fact, the codeword is a geometric form in the 3D RGB system that collects the real color and its modified RGB values together. In order to find the most fitted geometrical
Real RGB color value Modified RGB values caused by luminance variation B R G
shapes, KIM et al. [1] observed “how pixel values change over the time under lighting variation”. Based on their observations, the authors developed a color model depicted in Figure 2 where a quantization subspaces are associated to cylinder.
KIM et al. [1] implemented its own method by defining, for each pixel, a codebook as a set of codewords. Each codeword consists of one RGB vector (the center of gravity of the cylinder which is the mean of its contained RGB values) and a 6-tuple auxiliary (Imin, Imax, f, ë, p, and q) defined as the following:
Imin, Imax the minimum and maximum brightness, respectively, among all the values assigned to this codeword. They are used to determine the height of the cylinder.
f the frequency of this codeword (number of values assigned to this codeword)
ë the Maximum Negative Run-Length (MNRL) defined as the longest interval in the RGB values sequence where the codeword has NOT recurred
p, q the first and last occurrences positions, respectively, of the codeword
In the sequence of all RGB values taken by a pixel along the video, each RGB value sampled at time t is compared to the current codebook to determine which codeword C (if any) it matches (the cylinder to which the RGB value belong to, in the RGB system). Thus, to determine which codeword is the best match, he employed a color distortion measure and brightness bounds. Once the corresponding codeword C is selected in the codebook, all attributes of C are updated to take the new RGB value into consideration. At this point, the sequence of RGB values taken by each pixel is replaced by a “Codeword Sequence”, where each RGB in the sequence is replaced by its corresponding codeword ID (the matched codeword).
Once the model is built, KIM et al. [1] eliminated the Codewords belonging to the foreground from the model. These codewords are identified by their large ë that indicates a long time where the codeword did not appear in the main Codeword sequence. This criterion identifies the values appearing stationary in this sequence which belongs to the background. KIM et al. [1] used the value of N/2 as a limit, where N is the length of the whole codeword sequence. Hence, if ë is greater than this limit, then ë is considered large.
2.3. Background changes detection
Another close works focus on the detection of changes made on the background. In Gibbins et al. [18], the authors propose a statistical approach to automatically detect background changes in scenes containing significant numbers of moving objects. Their method is decomposed of two steps: The first involves background estimation while the second involves change detection based on the current background estimate. Then, they detect changes using histogram and density based detection systems. In addition, the authors of Ambata et al. [19] proposed a method to detect changes in the background in video surveillance systems. This approach has three main processes: background modeling, subtraction and detection. The authors used the wavelet transform in separating the foreground from the background. In both works, the background is subtracted from new frames to detect the foreground objects, and then they identify the foreground part that becomes stationary (as a changes on the
background) based on some features. Readers are invited to read Radke et al. [17] for in-depth presentation of this type of works. In this survey, we remark that all approaches perform background subtraction to isolate the foreground and analyze the background. However, in our work we do not subtract the background (which sometimes causes inaccurate segmentation results) by creating a real-time background model, but we create a model that collects quantified pixels values of both background and foreground. Later, we will refer on this model to propose an automate decision and voting systems to locate the boundaries of actions performed on the background. Moreover, in contrary to the above works that are designed to be executed in real-time, we work in this paper with fully registered videos.
2.4. Novelty
In this article, we do not perform any foreground/background segmentation operation. However, we quantify all values taken by a pixel (background and foreground values) into a Codebook that will finally hold all distinct values of this pixel. On the other hand, we used a Codebook quantization technique originally proposed by KIM et al. [1] to model the background and then use it to perform a foreground/background segmentation by background subtraction. In our work, we adapted this technique to feed a graph-based decoding system.
Up to our knowledge, there is no works addressing this problem in a similar way. All similar works (some are already discussed) perform a background subtraction and then analyze the foreground content. This type of methods depends strongly on the method used to perform the foreground/background segmentation, however these last methods do not provide a 100% accuracy rate, which affect the final results.
We propose here to model actions by a set of graphs with dynamic states identified by a quantization process. This work is like an automatic interpreter at the scale of each pixel. The voting process is a late fusion strategy to take the final decision. This is clearly not the approach followed in the related works that will be discussed, where the action type is a prior knowledge and where, as a consequence, motion analysis is always a key issue.
3. Our approach
As we mentioned above, the Codebook-based quantization method proposed by Kim et al. [1] will not be used as is it. Some modifications will be made to adapt it with our needs by eliminating unnecessary parameters (for us) and modifying the Codebook creation and update procedures. But first, we present an overview of our proposed method that shows the elements of the followed procedure.
3.1. General Overview of our Method
The Figure 3 shows the followed procedure in the upcoming sections. First (section 3.2), we construct one Codebook per pixel by following the modified procedure of Kim et al. [1]. This Codebook collects the distinct colors taken by this pixel during the video. Second, we refer to this Codebook to represent the historical RGB values (RGB sequence) in terms of Codeword-ID (Codeword-ID sequence). In section 3.3, we propose a decision automate to locate the permanent color changes made by this pixel based on its Codeword-ID sequence. Then (section 3.4), a
voting system is proposed to associate a vote to each position in the sequence. This vote reflects, at its position, the possibility of being an action boundary. Later (section 3.5), we combine the vote vectors produced by all pixels to obtain a global vote vector. In this vector, a highly voted position indicates an action boundary. Finally, we use a simple method to find the highly voted positions.
3.2. Codebook-Based Quantization Method
3.2.1. Proposed modifications
3.2.1.1. Motivations
We already mentioned that each new pixel value that matches a Codeword, affects its properties (the center of gravity and the 6-tuple) by recalculating it according to the new value. This means that the dimensions and the coordination of cylinders vary with time for each new RGB value. This real time modification makes the cylinder intersections more possible to occur. Consequently, some RGB values may situate in a two-cylinder intersection zone. Which makes it a part of two Codewords at the same time; which is a problematic issue in our case.
As a solution, we propose using (experimentally determined) static dimension rather than dynamic one. This can be done by recording specific videos and observing the range in which pixel values vary over the time when no movement exists, and then using the appropriate dimension that fits the needs.
3.2.1.2.
Cylinder dimensionAs mentioned above, the codeword cylinder is employed in order to collect a real RGB color and its modified values caused by the brightness and luminance variations. So, the major factor that affects
Image sequence
Create the Codebook
Represent RGB values in the sequence in terms of Codeword-ID
Sequence of RGB values
Codebook
Sequence of Codeword-IDs
Locate persistent changes
Voting system Decision automate
Vote for each position
Vote vector
Combine the vectors of all pixels
Global vote vector
Find the highly voted positions
Action boundaries positions For each pixel
Figure 3: General overview of the method.
Section 3.2
Section 3.3
Section 3.4
the real value of a pixel - other than noise - is the unhandled luminance variation (this variation is unremarkable by our eyes and depends on the source of light). We plan to estimate the range in which a pixel value varies under a given source of light. Many types of sources are used separately in order to study the effect of each type on this range. To achieve this goal, videos are recorded separately under many selected sources of light: incandescent, fluorescent, led, direct sunlight and indoor sunlight. The recorded scenes are distinct in terms of elements but they have the same important criterion: “there is neither motion nor noise”
(actually the smallest possible amount of noise). In addition, they are identical in terms of shooting intrinsic parameters: stationary camera (installed on a tripod), camera settings and video length. This eliminates any factor that can affect the real pixel values except the source of light.
In this type of no-movement videos (Figure 4), each pixel has the same color value over the time. Theoretically, all the values taken by this pixel (by luminance
variation) should be treated as the same color (Codeword). For this reason, we assume that each pixel has only one Codeword in its codebook. Let C be the cylinder representing the real value of pixel X. And, RGB = {(R1,G1,B1), (R2,G2,B2), .... ,
(Rt,Gt,Bt)} be the sequence of all RGB values
taken by X over the time. And, G (mean(Ri),
mean(Gi), mean(Bi)) be the center of gravity
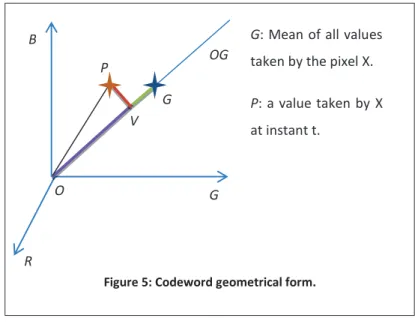
of C. Our goal is estimating the height H and radius R of C in a way that C collects all the modified values taken by X. According
to Figure 5, the values we look for can be estimated based on the segments lengths of ||PV|| and ||GV||. Therefore, we calculate these lengths for every pixel X in each video apart. And then, we calculate the mean and the standard deviation of each set of lengths (||PV|| and ||GV||).
On the other hand, according to the normal distribution law, about 68 % of values drawn from a normal distribution are within one standard deviation value (std) away from the mean. We made some experiments showing that 68% of the values are sufficient in our case to avoid large and very small cylinders. As a result, a cylinder collecting 68% of modified pixel values must have the following dimension:
R = mean (||PV||) + std (||PV||) H = 2 x [mean (||GV||) + std (||GV||)]
Figure 4: No-movement scenes.
B R G OG G O P V
G: Mean of all values
taken by the pixel X.
P: a value taken by X
at instant t.
3.2.2. Codebook creation
Each RGB value taken by a pixel is matched
1with the codewords of its own
codebook. If no matched Codeword exists, then a new one is created. As a
result, we get one codebook per pixel that quantifies all its RGB values. As
next step, we aim to represent the RGB sequence of each pixel (values taken
during the video) as a sequence in terms of Codeword-ID. This is done by
matching each RGB value taken at time t with the Codewords of its pixel’s
Codebook. Then, we represent this value by the corresponding Codeword-ID.
This leads to a sequence of Codeword-ID that represents the color path
followed by each pixel during the video.
3.3. Decision Automate
As mentioned above, our goal is segmenting all actions that affect the background. In terms of multimedia, modifying the background consists in permanently changing the original colors of a zone. For example, adding a new object to the scene is an action that modifies the background by permanently changing the colors of a set of pixels (S1: located at the object destination) from their original colors to the colors of the to-be-moved object. Even some other pixels (S2) change their colors
temporary when the actor (or the to-be-moved object) hovers above them, they go back to their original colors at the end of the action. On the other hand, actions consisting in moving objects within the scene involve two sub-sets of pixels corresponding to S1: the sub-set I is located at the initial position of the to-be-moved object and the sub-set F is located at its final position (see the Figure 6). The only one difference is that they change their colors inversely, but both do a permanent color change (from the object to the background and from the background to the object). As we search for modifications on the background, we are interested in a set of pixels that matches the S1 case (S1-Like). Thus, our method aims to identify this type of groups, if it exists, at any frame in the video.
As mentioned above, a permanent modification on the background is a one-way value change (Transition) from initial colors (Initial State IS) to final colors (Final State FS); this is the ideal case. However, not all the pixels of a given group make the transition at the same time, even not all of them make a direct transition, because sometimes they pass by a temporary color (Temporary State TS) before arriving to their FS. For the first point, we assume that a modification starts at the moment we find pixels behaving like S1 (this will be discussed later). Concerning the second issue, we will identify and eliminate the unwanted state (TS) by proposing a decision automate and voting system (later in this paper). An example of such type of pixels: when a human being stands in
1 A pixel’s RGB value (R, G, B) matches the codeword C if, and only if, the point (R, G, B) - in the RGB system - is
located inside the cylinder corresponding to C.
Figure 6: Pixels group during an action.
front of a to-be-moved object (between the object and the camera), then he takes and moves it to another place in the scene. Pixels representing the initial place, of the moved object, change their colors to the colors of the actor for a while, and then they switch to new permanent colors (belonging to the background) that were hidden by the object before its movement.
3.3.1. State identification
Our goal is always finding the actions boundaries that affect the background in a video. While some actions consist of only one S1-Like set of pixels (bring an object from outside the scene and place it inside), other actions change two groups of pixels consecutively: the first group represents the initial place of object and another represents its destined place (moving object within the scene). We aim in this section to filter the unwanted state TS and identify the other important ones (IS and FS) in the Codewords sequence (codeword path) of each pixel. Every possible Codeword path is presented in Table 1. Then, the role is identifying the three states in each case based on the only
Case Possible codeword path Description State identification The Initial State is: The Temp. State is: The Final State is:
i A path, formed of only one state, represents a stationary pixel;
this is the case of unmodified background pixel. 1 - -
ii This form of path corresponds to a pixel making a permanent
change from a state to another. 1 - 2
iii
A pixel following this path makes two transitions. In this case, it is hard to identify exactly the three states. However, three
identification possibilities exist.
1 2 3 OR 1 3 2 OR 2 1 3 iv
Knowing that IS and IF can't be on the same side of the transition, we are able to identify the IS confidently. But the FS
and TS are still ambiguous.
1 2 3 OR
1 3 2
v
As the third codeword lies alone on the other side of transition (from 1 or 2), it is the FS. The other two codewords are IS and
TS.
1 2 3 OR
2 1 3
vi
A codeword (1) appearing on both sides of a one-way transition is absolutely a TS codeword. Consequently, the IS and FS are
confidently identified.
2 1 3
vii
A path without a one-way transition belongs to a pixel that does not form a part of any permanent change. Therefore, this type will be ignored as it has no relation with any permanent change.
- - -
one fact we have: “a permanent modification appears as a one-way transition in the codeword path, therefore the
departure state is the IS and the arrival state is the FS.”
According to Table 1, in some cases (i, ii) we are able to identify the two primary states (IS and FS); in some other (iv, v, vi and vii) we can confidently identify only one primary state, however the case iii forms a challenge as no primary state can be identified. On the other hand, it is impossible to confidently identify the states in the cases (iii, iv and v) because many possibilities exist. However, the main goal is not the identification of all states in a given path. But, we search for a transition from a Codeword to another without return, independently of any TS in between. This transition indicates the moment of a permanent change occurred in a pixel Codeword-ID sequence. In the next section, we will propose a voting system that combines the decisions of all pixels to form a decision at the level of the entire video.
3.4. Voting System
The above table (Table 1) shows all possible paths that can be followed by a pixel having less than four distinct Codewords. However, not all pixels have this number of codewords. For example, when a multicolor actor moves an object, he causes a group of pixels to change their original colors to a group of colors (actor colors) before receiving the final colors (see the Figure 7).
In fact, the paths followed by these pixels have more than three distinct Codewords. However, only three states exist, where TS represents all the temporary colors (codewords) of the actor.
We propose decomposing the Codeword-ID sequence of each pixel into several three-Codeword sequences (sequences with less than or equal to three codewords). This permits the use of the above table to localize transitions with help of a voting system (to be discussed later). Let’s take an example:
Let the following vector be the Codewords-ID sequence (CTS) of pixel X:
Global CTS: c1 c2 c3 c1 c1 c4 c3 c3 c4 c4
And all its three-codeword segments:
Segment 1: c1 c2 c3 c1 c1
Segment 2: c2 c3 c1 c1
Segment 3: c3 c1 c1 c4 c3 c3 c4 c4
By matching the segments cases with those in Table 1, we can know the position of transition in each segment:
Segment According to 1 Case vi 2 Case iii 3 Case vi
Segment 1: 0 0 1* 0 0
Segment 2: 0 ½** ½ 0
Segment 3: 0 0 0 1 0 0 0 0
The sum 0 0 1½ ½ 0 1 0 0 0 0
From this point, we consider “The sum” vector as the “Vote vector” of pixel X, where a high vote in an entry “i” indicates a high probability that the frame “i” represents an action boundary (according to X).
On the other hand, votes generated by segments having different lengths should not have the same impact on the final vote vector. In the last example, the three segments have the same impact on the result. However, the vote generated by segment 3 is based on more data than other segments do, which makes its vote more reliable. For this reason, we will assign a weight for each vote based on one of these weighting schemas:
1. “The length of the segment”: the vote is equal to the length of the segment (method 1).
2. “The minimum number of occurrences of the three Codewords” (method 2): this will take in consideration that a Codeword having a very small number of occurrences - most probably - represents a noise more than a real color. Therefore, a sequence with a large minimum number of occurrences is more likely to contain Codewords that all belong to real color, which makes its vote more faithful. For this reason, we preferred linking the vote weight to this number.
Returning to the last example, we calculate the votes in each segment according to both weighting methods: 1. Weight = length of segment
Segment 1: 0 0 5 0 0
Segment 2: 0 2 2 0
Segment 3: 0 0 0 8 0 0 0 0
The sum 0 0 7 2 0 8 0 0 0 0
2. Weight = smallest number of occurrences between the three codewords
Segment 1: 0 0 1 0 0
Segment 2: 0 ½ ½ 0
Segment 3: 0 0 0 2 0 0 0 0
The sum 0 0 1½ ½ 0 2 0 0 0 0
* We represent the transition position in a segment, according to Table 1, by a « 1 » in the appropriate position in the vote vector. ** As the accurate transition position - according to case iii - is ambiguous, we distribute our decision on both positions.
At this point, we do not take a decision about what weighing method to use because we are not able now to compare and evaluate them. However, in the experiments and evaluation section, we will present all results calculated based on both methods to show the difference between them.
At the end of this procedure, each pixel will have its own vote vector. In order to make a decision at the level of the entire video, we combine all pixel’s vectors into one global vector. This vector (“global vote vector”) is the sum of all pixels’ vectors.
3.5. Locating the Actions
According to our voting system, the vote vector index having a high vote corresponds to a frame representing a start or an end of an action, but what value is considered high? This is subjective. For that reason, we propose using a reference to identify the high votes between other votes. We remarked that the local mean can be used as a good reference. In this case, the crossing of the votes curve by the local mean’s one from below to above is considered as a peak start (high vote). By consequence, finding the positions of these crossings leads to locate that boundaries of actions. The local mean curve is calculated as the following:
1. Define a sliding window on the vote vector, 2. Calculate the mean of votes inside this window,
3. Move the window foreword by one step and back to step 2.
In order to distinguish the crossings that indicate a high votes from others, we calculate a weight for each crossing. This weight is calculated in function of the crossing angles and the vote strength. In this way, a peak (high vote) in the votes curve is indicated by a highly weighted crossing at its beginning. This weight will help us later during the evaluation of the system.
In the next section, we show the importance of our approach by presenting the performed experiments and their results. Later, these results are evaluated and compared to those of other systems.
4. Experimentations and results
In order to evaluate our method, we will test it on two types of videos: simulated and real videos.
4.1. Action simulation video
These videos – created in MATLAB– simulate the act of moving objects, where each video contains two types of objects: an actor and to-be-moved objects. Figure 8 is an example of this type of videos. We created ten similar videos that only differ by their sizes (three different sizes), number of objects in the scene (2, 3 and 4 objects), colors (6 different colors) and movement speed (three speeds). In these videos, there is neither illumination variation nor noise or shadows. Which makes them ideal for method testing purposes.
The application of our system on the above simulated video (Figure 8) produces two vote curves, each one is calculated using a different weighing method (see section 3.4). In this video, the challenge is finding the boundaries of each action (start and end), this can be done by obtaining high peaks on the correct positions.
Figure 9: The vote curve (of Figure 8) calculated using sequence length weighing method.
Figure 10: The vote curve (of Figure 8) calculated using the minimum number of occurrences weighting method.
Figure 9 shows the votes curve calculated by our system using the sequence length as a weight. And, Figure 10 presents the votes curve calculated using the minimum number of Codeword occurrences as a weight. According to the logic of our system, a peak in the curve indicates a highly voted position to be an action boundary. As expected, in both figures, the peaks positions (except the fourth one) meet the manually-selected boundaries (ground-truth).
4.2. Real video
As our method showed good results on simulated video, we test it on real videos where real-color values are affected by many external conditions (shadows, lighting variation, etc…). As we work on a custom type of videos (fixed camera with specific type of actions), and because of the lack of large database containing such type of videos, we recorded by ourselves a set of videos as a personal dataset that can be used for test purposes. These videos are created indoors under different types of illumination (fluorescent, incandescent and LED with no manual light variation) and they have different durations (between 60 to 180 seconds). Using the same high end
Figure 8: Sample of a simulated video that contains two actions. Scenario: (Action 1) Blue Square (the actor) goes toward the red one and moves it to the right-down zone of the scene, (Action 2) The blue square moves the green one to the left side before leaving the scene.
camera (Nikon D5100 with low-noise setting), we recorded a man (different clothes color) who moves some objects of different colors and sizes (chairs, boxes, etc…).
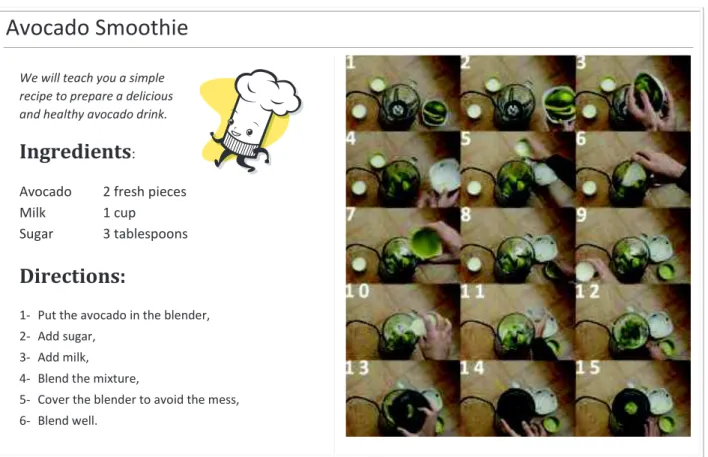
Figure 11 shows an example of the application of our main approach2: making a recording of the preparation of a
specific recipe can be a way to check if the operator followed the guide (the textual procedure) or no. The first step in this procedure is locating the actions boundaries in the video recording (the subject of this paper).
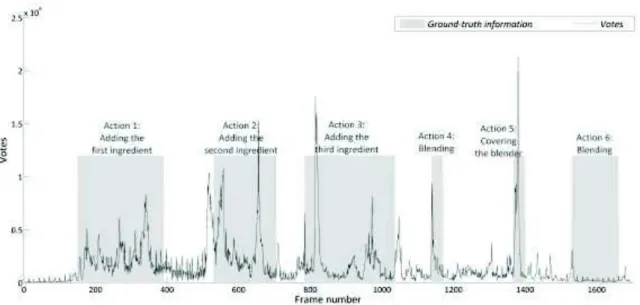
In order to show the accuracy of produced boundaries, we manually selected the actions boundaries with a high accuracy. Later in the evaluation section, an evaluation system will be proposed to compare our results to the results of other systems. For now, we locate the exact action boundaries (ground-truth information) in each video, and then compare the selected results with those obtained by our automated system (visual comparison). The figures Figure 12 and Figure 13 show the weighted vote curves of the video presented in Figure 11 calculated using the two weighing methods, in addition to the manually-selected action boundaries (ground-truth information).
Avocado Smoothie
We will teach you a simple recipe to prepare a delicious and healthy avocado drink.
Ingredients
:Avocado 2 fresh pieces Milk 1 cup
Sugar 3 tablespoons
Directions:
1- Put the avocado in the blender, 2- Add sugar,
3- Add milk, 4- Blend the mixture,
5- Cover the blender to avoid the mess, 6- Blend well.
Figure 11: Video screenshots (1700 frames) and the procedural text that describes its content (Avocado smoothie recipe).
Figure 12: The vote curve corresponding to video in Figure 11 which is calculated using the sequence length weighting method. In this figure, each gray rectangle encloses an action selected based on the ground-truth information (left/right side is the start/end of action).
Figure 13: The vote curve corresponding to video in Figure 11 which is calculated using minimum number of occurrence weighting method. In this figure, each gray rectangle encloses an action selected based on the ground-truth information (left/right side is the start/end of action).
These curves are not as sharp as the curves produced on the simulated videos (due to the presence of illumination changes and other external factors). However, matching ground-truth boundaries (reference boundaries) with our vote curves shows that the ground-truth boundaries are located at a vote peak (local maximum). By consequence, locating the boundaries consists in extracting the major peaks in these curves. We consider a point as a peak start, if it forms a crossing point between the means (see section 3.5) and the vote curves in a way that votes curve crosses the means from under to above.
As an example, Figure 14 shows the votes and means curves of a video containing three boundaries, in addition to the under-to-above crossings between votes and means curves. While some crossings indicate accurate positions
of ground-truth boundaries, some others do not make any sense. On the other hand, local minimums in the means curve may help in filtering the crossings by eliminating the meaningless indicators. Thus, a two-indicator method must be found.
We propose a filtering method that eliminates the meaningless indicators; this method is based on the fact that “A
minimum time separated a start/end and an end/start is required before indicating a new start/end”. However,
this time depends on the type of actions in the video. We still try to optimize the obtained results by finding more parameters and some other helpful indicators. Even this, the next section will show up the importance of obtained results.
4.3. Evaluation of results
First of all, it is important to mention that - in this article - we do not propose or enhance any background subtraction method. Consequently, we are unable to compare our results with any background subtraction method. However, works discussed in the state of art section, aimed to choose a quantization technique to use it in our method. Therefore, there is no other work in the literature that addresses the same problem as ours. For this reason, we will evaluate our system using a dedicated method that produces two curves. These curves reflect the accuracy of produced boundaries.
As our goal is finding the actions boundaries, we manually selected all actions boundaries to create a reference on which we can refer during the evaluation process (we call it: reference boundaries). Therefore, the produced curves depend on the distances between manually selected boundaries and the automatically generated ones. The calculation of the first curve consists in calculating the distances between each automatically generated boundary and the nearest reference boundary (this method is so called: “Auto-to-REF”). Then, these distances are used to calculate a histogram of distances in a way that each distance corresponds to its number of occurrences. On the other hand, the second curve is calculated using the distances between each reference boundary and the nearest automatically generated one (this method is so called: “REF-to-Auto”). We expect two curves (x-axis: distinct distances, y-axis: number of occurrences) where short distances (low x) have the major number of
occurrences (highest y values). Which means that each reference boundary is very close to (or at the same position of) an automatically generated boundary.
In order to prove the efficiency of our system, we compare the calculated curves to those generated by an
“Oracle” and a “Basic program” (based on the same reference: reference boundaries). The Oracle corresponds
here to boundaries produced by a human operator (other than authors) who is asked to manually determine the action boundaries in a video. The differences with the reference will highlight the difficulty to identify temporal points as being the boundaries of an action, and thus the relative reliability of the reference itself. The “Basic
program” consists of randomly select temporal points, where the number of these points is as same as the number
of boundaries detected by our automatic system.
The goal of this evaluation method is comparing our curves to the Oracle and Basic program ones. According to this method, a good curve is distinguished by: (1) high values are associated to low distances (x-axis) and (2) low values are associated to high distances (its form is similar or close to a half-Gaussian curve). This means, that the compared system produces boundaries located at a short distance to a reference boundary more than those located at a long distance. As a result, the more the curve is similar to a half-Gaussian curve with short bell width, the more the performance of the system is.
Figure 16 : Normalized number of occurrences (histogram) of distances calculated using the REF-to-Auto method. Figure 15: Normalized number of occurrences (histogram) of distances calculated using the Auto-to-REF method.
As we expected, these results prove that the most of calculated distances are short (low abscissa), which means that the most automatically selected boundaries are very close to the reference ones. Hence, our curve is close to the Oracle one and far away from the Basic program’s curve. On the other hand, our curve in the Figure 15 indicates that the voting system generates many boundaries, some are very close to the reference ones and some else are far (but closer than 80 frames). However, Figure 16 indicates that for each reference boundary we find an automatically-selected boundary within a distance shorter than 13 frames.
In addition, we compared the results of our system with the ones obtained by a system originally dedicated to shot boundaries detection. However, as this system is not designed to detect actions in a same shot, we had to slightly adapt it to our problem. We used a system that is already implemented in the Computer Vision System toolbox in MATLAB [20]. This system aims to detect shot changes in a video using a predefined threshold. A frame difference greater than this threshold indicates the existence of a shot boundary. Therefore, by decreasing this threshold, the system considers a minor modification occurring in the scene as the beginning of a new shot. For comparison matters, we modified the threshold in a way that the number of produced boundaries is close to the number of boundaries produced by our system. In addition, we fixed a minimal distance between two consecutive boundaries to avoid boundaries that are very close to each other. This value is equal to the minimum action duration based on the ground-truth information.
The figures (Figure 17 and Figure 18) show that our system behaves much better than this system too.
In Figure 15/16, the x-axis represents the distinct distances between each automatic/reference boundary and the nearest reference/automatic boundary according to Auto-to-REF/REF-to-Auto distance calculation method (see the third paragraph in Evaluation
of results). And, the y-axis represents the normalized number of occurrences of each distance:
.
These histograms are calculated by our evaluation system based on boundaries detected in more than 15 real videos with 450 seconds of total length and more than 50 actions.
Figure 17: Normalized number of occurrences (histogram) of distances calculated using the Auto-to-REF method. According to this figure, all our system’s boundaries are located within a distance shorter than 80 frames to a reference boundary. However, some of the boundaries selected by the general shot boundaries detection system are farther than 140 frames from the closest reference boundary.
The following table shows, for each system, the means of distances calculated using each distance calculation method:
System Auto-to-REF method REF-to-Auto method
Oracle 4.6407 4.6407
Our system 15.3754 4.7717
General shot boundaries detection 20.9714 8.2263
Random 24.0551 10
Table 2: The means of distances calculated using each distance calculation method. It is obviously clear that our system performs better compared to other automatic systems.
The distances above are computed without taking in consideration the vote value. We just referred to the limit position. We study now the dependency between the reliability and the number of votes associated to the automatically selected limits. This study aims at emphasizing the fact that a highly voted position is a more accurate one.
In this evaluation, we first normalize the votes calculated on each video so that the maximal value is associated to 1. The normalized values corresponding to automatically detected limits on all videos are then sorted from the lowest to the highest one. This ordered set is then split in 10 ranges of equal number of limits. On Figure 19, the x-axis represents these ten ranges ordered from the lowest votes on the left to the highest ones on the right. The y-axis represents the normalized mean distance between each automatically selected limit of a range and the closest limit in the ground truth. As we can see on this curve, the highest votes (on the right side) are associated to the smallest distance to an actual GT boundary. This let us assume that the normalized number of votes can be considered as a measure of confidence.
Figure 18 : Normalized number of occurrences (histogram) of distances calculated using the REF-to-Auto method. It is clear that each reference boundary is located at a distance shorter than 13 frames to an automatically selected one. However, in the shot boundaries system’s curve, some reference boundaries are farther than 60 frames from the nearest selected boundary.
Figure 19: Mean distance of each vote range. The distances are between each automatic limit in a range and the closest GT limit.
Another way that can give an idea about the efficacy of our system is calculating the Precision and Recall of boundaries produced by each tested system. However, evaluating a system by its capacity to detect the exact reference boundaries is not fair (which is not the expected goal) especially when working with real videos. For this reason, we compare the tested systems by their capacities to detect boundaries in the neighborhoods of reference boundaries. In Table 3, we calculate the Precision and Recall values of boundaries detected by each system by assuming each time that a detected boundary is considered correct if it is closer than a specific number of frames to a reference boundary.
System Oracle Our system Shot boundaries
detection Basic program
Number of
frames Precision Recall Precision Recall Precision Recall Precision Recall
< 15 0.9000 0.9000 0.4567 0.8056 0.4095 0.7821 0.3780 0.7778
< 30 1 1 0.8110 0.9722 0.7524 0.8963 0.7087 0.9444
< 45 1 1 0.9370 1 0.9143 0.9960 0.8661 1
< 60 1 1 0.9843 1 0.9524 1 0.9291 1
< 75 1 1 0.9921 1 0.9792 1 0.9764 1
Table 3: Precision and Recall of produced boundaries by each system.
In our strategy to synchronize a video with the text that describes its content, we decided in our overall framework to give emphasis to the recall rate, considering that the later process will have to apply a dedicated filtering on these results depending on the application goals.
4.3.1. Memory and time efficiency
In this section, we discuss the efficiency of the proposed method in terms of memory and computation complexity. It is important to state that this analysis is made on a non-optimized implementation of the code. We consider 4 steps:
Figure 20: Actions boundaries detection procedure.
As already discussed, we use the codebook quantization technique that has been originally proposed by kim et al [1]. According to the authors, this technique is very effective in terms of memory and time compared to other systems. As a second step of our method, we represent the list of RGB values taken by each pixel by a list of Codeword-IDs. In this procedure, we pass by each RGB value and replace it by the corresponding Codeword-ID. In a more optimized implementation, a part of this work can be done in parallel with the “Codebook creation” step. This can significantly enhance the efficiency of the method. Finally, the “voting” and “Boundaries extraction” steps are not heavy in terms of resources compared to the above calculations.
In the following tables (Table 4 and Table 5), we give the relative computational time and memory resources required by each step for comparison matters. Those results have been obtained while processing a short video of 348 frames, each one of 480x270 pixels, on a personal computer with an Intel(R) Core(TM) i5 CPU M 540 @ 2.53GHz (4 CPUs), ~2.5GHz and 4 GB RAM.
Time:
Total time of execution (s)
Codebook creation 1847.3853
RGB representation 1291.8292
Voting 323.705237
Boundaries extraction 1.645326
Table 4: Efficiency in terms of calculation time.
Memory:
Size of matrices Memory (KB)
Codebook 2 x 4 x 480 x 270 x 348 344091.8 CB length 1 x 480 x 270 126.6 RGB 2 x 3 x 480 x 270 x 348 258068.8 Codeword sequences 1 x 480 x 270 x 348 43011.5 Other variables 100.0 Total memory: 645398.7
Table 5: Efficiency in terms of memory.
It is important to mention here, that the current implementation does not allow us to give a precise value of the computational time of the overall process. But we assume that the computational time and resource is nearly the same than the one corresponding to background subtraction with a Codeword approach (as the quantization step is far away the most costly one).
4.4. Parameters affecting the approach
In this section, we discuss some parameters that affect the results and the performance of our approach.
4.4.1. Illumination changes
In this article, we discussed a method proposed by KIM et al. [1] to handle the illumination changes during the process, and then we proposed a modification on it to avoid codeword intersections. The proposed method gets rid of a slightly intensity variation (no manual variation), but a sudden strong light variation cannot be handled. In spite of this, the results will not be strongly affected because this event will appears in the vote curve as a high sharp peak on a very segment on the timeline. This type of peak is ignored in our system.
4.4.2. Object size
Another parameter that affects the performance of our system is the size of under-action objects. As already mentioned in this article, indicating a permanent change at a given frame depends on its number of votes. This number depends on the number of pixels (belonging to the under-action object) voted for this frame. As a result, the more/less this object is large; the more/less the results are accurate.
4.4.3. Occlusion
In foreground/background segmentation methods, the occlusion of a moving object in the scene forms a big challenge that directly affects the performance of these methods. Besides, moving objects that stop for a while are integrated into the background because they become stationary in camera’s point of view. Accordingly, this object will not be considered as a part of the foreground plan anymore. For example, some human movement detection systems are not capable to detect a person who freezes in his place for a while, because he became a part of the background. In a slightly similar way, our system is also affected by this issue but it will not cause a problem. Because in our case, the system will consider the moment of freezing as a start or an end of an action, which is incorrect in the real world in terms of action detection it is true (“freezing” in a specific place may be an action by itself). However, filtering the selected permanent changes by our system can identifies the changes belonging to a start or an end from those who are not.
4.4.4. Type of actions
In our approach, we aim to detect permanent changes on the background in order to approximate actions boundaries. However, some actions do not affect the background permanently. For example, an action consisting in jumping for seven times does not affect the background at all. Consequently, our system will be unable to detect this action’s boundaries. In a forthcoming work, we work on a tool that detect repeated actions even they do not affect the background. This will complement our method to form a system that synchronize textual and video contents.
4.4.5. Other limitations
In spite of the good performance of our system, this system has some limitations related the type of video contents (actions, objects, movement speed, etc…). In general, our system fails to exactly detect the start/end of an action if the modification on the background does not appear in the scene. This case occur when the operator makes an action that does not appear to the camera due the operator’s body. In this case, our system will fail to localize the action’s boundaries at the exact time, but once the operator moves away, the system will detect a boundary at this moment (it will be late in the wrong position).
5. Conclusion and perspective
In this paper we proposed and evaluated a method to detect actions performed by an operator in his working environment. This method is one of many automatic tools that aim together to automatically synchronize textual and video contents. We divided the scene into two layers: the foreground (the operator or any other moving objects) and the background (the rest of the scene). Our goal is finding permanent changes (made on the background) as they indicate a start or an end of an action on this layer. We used a Codebook-based quantization technique to help us in deciding whether a permanent change is made by each pixel or not. Then, we created a voting system to localize the boundaries of actions in the video.
During the experimentation stage, we remarked that our produced vote curves are somehow noisy which make it slightly hard to distinguish the peaks that represent a boundary from the other ones. Some grammar rules are manipulated to reduce this noise with the help of an adaptive threshold that is used to reduce the number of false detections. Even though, in our strategy of synchronization with text, we integrate the idea that our system returns more possible starting and ending points than required (high Recall), and so that a second filtering step should be applied in respect with the overall application needs. Moreover, we proved in the evaluation section that the system associates a higher vote to a more reliable boundary. The next step will be detecting and segmenting repetitive actions of various types including recursive aspects such as repetitions of repetitions. The knowledge about reliability on boundaries will play an important role in the synchronization process, which will require the fusion of results from these two segmentation systems.
As a conclusion, this method showed good performance and results on real and simulated contents, which will push ahead this research work.
6. References
[1] Kim K, Chalidabhongse TH, Harwood D, Davis L (2005) Real-time foreground - background segmentation using codebook model. Real-time Imaging 11:172-185. doi:10.1016/j.rti.2004.12.004.
[2] Elgammal A, Duraiswami R, Harwood D, Davis LS (2002) Background and foreground modeling using nonparametric kernel density estimation for visual surveillance. Proceedings of the IEEE 90:1151-1163. doi:10.1109/JPROC.2002.801448.
[3] Stauffer C, Grimson WEL (1999) Adaptive background mixture models for real-time tracking. IEEE Computer Society Conference on Computer Vision and Pattern Recognition 2:252. doi:10.1109/CVPR.1999.784637.
[4] Geng L, Xiao Z (2011) Real Time Foreground-Background Segmentation Using Two-Layer Codebook Model. International Conference on Control, Automation and Systems Engineering (CASE) 1:1-5. doi:10.1109/ICCASE.2011.5997546.
[5] Sigari MH, Fathy M (2008) Real-time Background Modeling/Subtraction using Two-Layer Codebook Model. Proceedings of the International MultiConference of Engineers and Computer Scientists (IMECS) 1:717-720.
[6] Gong Y, Sin LT, Chuan CH, Zhang H, Sakauchi M (1995) Automatic Parsing of TV Soccer Programs. International Conference on Multimedia Computing and Systems 1:167-174. doi: 10.1109/MMCS.1995.484921.
[7] Sudhir G, Lee JCM, Jain AK (1998) Automatic classification of tennis video for high-level content-based retrieval. Proceedings of IEEE International Workshop on Content-Based Access of Image and Video Database 1:81-90. doi: 10.1109/caivd.1998.646036.
[8] Rui Y, Gupta A, Acero A (2000) Automatically Extracting Highlights for TV Baseball Programs. Proceedings of the eighth ACM international conference on Multimedia, pp. 105-115. doi: 10.1145/354384.354443. [9] Zhang D, Chang SF (2002) Event detection in baseball video using superimposed caption recognition.
Proceedings of the tenth ACM international conference on Multimedia, pp. 315-318. doi: 10.1145/641007.641073.
[10] Leykin A, Ran Y, Hammoud R (2007) Thermal-visible video fusion for moving target tracking and pedestrian classification. IEEE Conference on Computer Vision and Pattern Recognition, pp. 1–8. doi:10.1109/CVPR.2007.383444.
[11] Wren CR, Azarbayejani A, Darrell T, Pentland AP (1997) Pfinder: Real-time tracking of the human body. IEEE Transactions on Pattern Analysis and Machine Intelligence 19:780-785. doi: 10.1109/34.598236. [12] Horprasert T, Harwood D, Davis LS (1999) A statistical approach for real-time robust background
subtraction and shadow detection. IEEE International Conference on Computer Vision 99:1-19.
[13] Cucchiara R, Grana C, Piccardi M, Prati A (2003) Detecting moving objects, ghosts and shadows in video streams. IEEE Transactions on Pattern Analysis and Machine Intelligence 25:1337-1342. doi: 10.1109/tpami.2003.1233909.
[14] Fihl P, Corlin R, Park S, Moeslund TB, Trivedi MM (2006) Tracking of individuals in very long video sequences. Advances in Visual Computing Lecture Notes in Computer Science 4291:60-69. doi: 10.1007/11919476_7.
[15] Subudhi BN, Ghosh S, Ghosh A (2013) Change detection for moving object segmentation with robust background construction under Wronskian framework. Machine Vision and Applications 24:795-809. doi: 10.1007/s00138-012-0475-8.
[16] Bouwmans T (2011) Recent Advanced Statistical Background Modeling for Foreground Detection - A Systematic Survey. Recent Patents on Computer Science 4:147-176.
[17] Radke RJ, Andra S, Al-Kofahi O, Roysam B (2005) Image Change Detection Algorithms - A Systematic Survey. IEEE Transactions on Image Processing 14:294-307. doi: 10.1109/tip.2004.838698.
[18] Gibbins D, Newsam GN, Brooks MJ (1996) Detecting suspicious background changes in video surveillance of busy scenes. Proceedings Third IEEE Workshop on Applications of Computer Vision, pp. 22-26. doi: 10.1109/acv.1996.571990.
[19] Ambata LU, Caluyo FS (2012) Background change detection using wavelet transform. TENCON 2012 IEEE Region 10 Conference, pp. 1-6. doi: 10.1109/tencon.2012.6412298.
[20] MathWorks laboratories (2013) Scene Change Detection System (vipscenechange). Computer Vision System Toolbox in MATLAB (R2013a). http://fr.mathworks.com/help/vision/examples/scene-change- detection.html, Accessed 1 December 2014.
[21] Rodriguez-Gomez R, Fernandez-Sanchez EJ, Diaz J, Ros E (2012) Codebook hardware implementation on FPGA for background subtraction. Journal of Real-Time Image Processing 10:43-57.
doi:10.1007/s11554-012-0249-6.
[22] Szwoch G, Ellwart D, Czyżewski A (2012) Parallel implementation of background subtraction algorithms for real-time video processing on a supercomputer platform. Journal of Real-Time Image Processing. doi: 10.1007/s11554-012-0310-5.