Complexin Mutants Reveal Partial Segregation between Recycling
Pathways That Drive Evoked and Spontaneous Neurotransmission
The MIT Faculty has made this article openly available.
Please share
how this access benefits you. Your story matters.
Citation
Sabeva, Nadezhda, et al. “Complexin Mutants Reveal Partial
Segregation between Recycling Pathways That Drive Evoked and
Spontaneous Neurotransmission.” The Journal of Neuroscience, vol.
37, no. 2, Jan. 2017, pp. 383–96. © 2017 the Authors
As Published
http://dx.doi.org/10.1523/JNEUROSCI.1854-16.2017
Publisher
Society for Neuroscience
Version
Final published version
Citable link
http://hdl.handle.net/1721.1/114179
Terms of Use
Creative Commons Attribution 4.0 International License
Cellular/Molecular
Complexin Mutants Reveal Partial Segregation between
Recycling Pathways That Drive Evoked and Spontaneous
Neurotransmission
X
Nadezhda Sabeva,
3X
Richard W. Cho,
4X
Alexander Vasin,
1Agustin Gonzalez,
3X
J. Troy Littleton,
4and Maria Bykhovskaia
1,2,31Department of Neurology and2Department of Anatomy and Cell Biology, Wayne State University School of Medicine, Detroit, Michigan 48201,
3Neuroscience Department, Universidad Central del Caribe, Bayamon, Puerto Rico 00960, and4Picower Institute for Learning and Memory, Department of Biology, Department of Brain and Cognitive Sciences, Massachusetts Institute of Technology, Cambridge, Massachusetts 02139
Synaptic vesicles fuse at morphological specializations in the presynaptic terminal termed active zones (AZs). Vesicle fusion can occur
spontaneously or in response to an action potential. Following fusion, vesicles are retrieved and recycled within nerve terminals. It is still
unclear whether vesicles that fuse spontaneously or following evoked release share similar recycling mechanisms. Genetic deletion of the
SNARE-binding protein complexin dramatically increases spontaneous fusion, with the protein serving as the synaptic vesicle fusion
clamp at
Drosophila synapses. We examined synaptic vesicle recycling pathways at complexin null neuromuscular junctions, where
spontaneous release is dramatically enhanced. We combined loading of the lipophilic dye FM1– 43 with photoconversion, electron
microscopy, and electrophysiology to monitor evoked and spontaneous recycling vesicle pools. We found that the total number of
recycling vesicles was equal to those retrieved through spontaneous and evoked pools, suggesting that retrieval following fusion is
partially segregated for spontaneous and evoked release. In addition, the kinetics of FM1– 43 destaining and synaptic depression
mea-sured in the presence of the vesicle-refilling blocker bafilomycin indicated that spontaneous and evoked recycling pools partially intermix
during the release process. Finally, FM1– 43 photoconversion combined with electron microscopy analysis indicated that spontaneous
recycling preferentially involves synaptic vesicles in the vicinity of AZs, whereas vesicles recycled following evoked release involve a larger
intraterminal pool. Together, these results suggest that spontaneous and evoked vesicles use separable recycling pathways and then
partially intermix during subsequent rounds of fusion.
Key words: Drosophila; electron microscopy; endocytosis; exocytosis; FM1– 43; synaptic
Introduction
Neurotransmitters are released by the exocytosis of synaptic
ves-icles with the neuronal plasma membrane. Vesves-icles are docked
and released at morphological specializations termed active
zones (AZs), which can be visualized with electron microscopy
(EM) as filaments attached to the membrane and surrounded by
vesicle clusters (
Zhai and Bellen, 2004
;
Su¨dhof, 2013b
;
Imig et al.,
2014
). Stimulus-evoked fusion occurs in response to Ca
2⫹influx
into synaptic terminals following an action potential. Vesicles can
also fuse and release transmitters spontaneously in the absence of
Received June 9, 2016; revised Nov. 10, 2016; accepted Nov. 15, 2016.
Author contributions: J.T.L. and M.B. designed research; N.S., R.W.C., A.V., and A.G. performed research; N.S., R.W.C., A.V., and M.B. analyzed data; N.S., R.W.C., J.T.L., and M.B. wrote the paper.
This work was supported by National Institutes of Health Grant R01 MH099557 to M.B. and J.T.L. The authors declare no competing financial interests.
Correspondence should be addressed to Dr. Maria Bykhovskaia, Neurology Department, 550 E. Canfield Drive, Lande Bldg #108, Detroit, MI 48202. E-mail:mbykhovs@med.wayne.edu.
DOI:10.1523/JNEUROSCI.1854-16.2016
Copyright © 2017 the authors 0270-6474/17/370383-14$15.00/0
Significance Statement
Neurotransmitter release involves fusion of synaptic vesicles with the plasma membrane in response to an action potential, or
spontaneously in the absence of stimulation. Upon fusion, vesicles are retrieved and recycled, and it is unclear whether recycling
pathways for evoked and spontaneous vesicles are segregated after fusion. We addressed this question by taking advantage of
preparations lacking the synaptic protein complexin, which have elevated spontaneous release that enables reliable tracking of the
spontaneous recycling pool. Our results suggest that spontaneous and evoked recycling pathways are segregated during the
retrieval process but can partially intermix during stimulation.
stimuli, and this release mode is important for neuronal
develop-ment and plasticity (
Cho et al., 2010
,
2014
;
Kavalali, 2015
;
Reese
and Kavalali, 2015
).
Following fusion, synaptic vesicles are retrieved into nerve
terminals by endocytosis and recycled for additional rounds of
fusion. Several endocytic pathways have been described,
includ-ing clathrin-mediated endocytosis at periactive zones, bulk
mem-brane reuptake, and fast recycling at the AZ (
Klingauf et al., 1998
;
Richmond and Broadie, 2002
;
Harata et al., 2006
;
He and Wu,
2007
;
Smith et al., 2008
;
Rizzoli, 2014
). Several studies suggest
that evoked and spontaneous modes of release may use different
recycling pathways (
Sara et al., 2005
;
Kavalali et al., 2011
;
Ramirez
and Kavalali, 2011
;
Peng et al., 2012
;
Melom et al., 2013
;
Reese
and Kavalali, 2015
;
Cork et al., 2016
). However, it is still debated
whether the recycling vesicle pools used for evoked and
sponta-neous release can intermix (
Groemer and Klingauf, 2007
;
Hua et
al., 2010
;
Schneggenburger and Rosenmund, 2015
). In addition,
it is not yet understood how coupling between the processes of
exocytosis and endocytosis occurs.
Neurotransmission is dynamic and plastic, and it is still
de-bated how endocytic mechanisms respond to adjust to modified
exocytosis rates. Evoked exocytosis is triggered by Ca
2⫹inflow
into nerve terminals, and several studies indicate that Ca
2⫹may
accelerate endocytosis (
Leitz and Kavalali, 2016
). However, some
forms of endocytosis are not promoted by calcium (
Wu and Betz,
1996
;
Cousin and Robinson, 2000
). Furthermore, it remains
unclear how vesicle retrieval is adjusted when exocytosis is
pro-moted in a calcium-independent way.
Vesicle fusion is controlled by the SNARE complex, which
mediates the attachment of vesicles to the plasma membrane
(
Su¨dhof, 2013a
). A small cytosolic protein complexin (Cpx)
binds to the SNARE complex, promoting evoked fusion (
Reim et
al., 2001
;
Xue et al., 2008
,
2010
) and inhibiting spontaneous
re-lease (
Huntwork and Littleton, 2007
;
Yang et al., 2010
,
2013
).
These two Cpx functions are controlled by different molecular
mechanisms (
Xue et al., 2007
,
2009
;
Cho et al., 2010
,
2014
), and
the inhibition of spontaneous release by Cpx is most prominent
at invertebrate synapses (
Huntwork and Littleton, 2007
;
Martin
et al., 2011
;
Jorquera et al., 2012
;
Wragg et al., 2013
).
In the present study, we took advantage of Cpx null
(cpx
⫺/⫺) Drosophila neuromuscular junctions (NMJs) to
in-vestigate the coupling between spontaneous exocytosis and
vesicle recycling. Spontaneous exocytosis is increased
many-fold at cpx
⫺/⫺NMJs (
Huntwork and Littleton, 2007
;
Jorquera
et al., 2012
), providing excellent experimental conditions for
investigating synaptic vesicle recycling during spontaneous
activity. Because the loss of complexin promotes spontaneous
release selectively and in a Ca
2⫹-independent manner (
Jorqu-era et al., 2012
), cpx
⫺/⫺NMJs enable the characterization of
vesicle recycling mechanisms activated in response to
en-hanced Ca
2⫹-independent fusion. We used EM analysis and
photoconversion of the lipophlic dye FM1– 43, combined with
electrophysiology, to investigate spontaneous and evoked
ves-icle recycling pathways at cpx
⫺/⫺NMJs.
Materials and Methods
Fly stocks. Drosophila melanogaster of either sex were cultured on
stan-dard medium at 22°C. The following fly stocks were used: Canton S (WT, Bloomington stocks, RRID:FlyBase_FBst1000081), cpxSH1 (cpx⫺/⫺)
(Huntwork and Littleton, 2007), HB mCpx I UAS-transgene rescue ex-pressed using the pan-neuronal elavC155-gal4 driver in the cpx⫺/⫺
back-ground (Cho et al., 2014), and the paralytic syntaxin mutant syx3– 69
(Littleton et al., 1998).
FM1– 43 imaging. Experiments were performed at Ib boutons of
mus-cles 6 and 7 at abdominal segments 2– 4 of wandering third instar larvae in HL3 solution, containing the following (in mM): 70 NaCl, 5 KCl, 20 MgCl2,1 CaCl2, 10 NaHCO3, 5 trehalose, 115 sucrose, 2.5 HEPES-HCl, and 2.5 HEPES-NaOH, pH 7.2–7.4) at 25°C. Dye loading was done with 2.5MFM1– 43 (Invitrogen) added. Stimulation was performed via a suction electrode at a frequency of 5 Hz. Upon dye loading, prepara-tions were briefly washed in Ca2⫹-free HL3 saline containing 75M Advasep-7 (Biotium) to reduce background fluorescence. Image ac-quisition was performed using a real-time laser-based confocal unit (PerkinElmer Life Sciences) equipped with a CCD camera (ORCA ER, Hamamatsu). Confocal z-stacks of images were acquired at 1m steps using a 60⫻ water-immersion objective (Zeiss) and analyzed as 3D vol-umes using Volocity software (Improvision) as described previously (Akbergenova and Bykhovskaia, 2007).
EM. The sample preparation protocol was modified from a prior study
(Akbergenova and Bykhovskaia, 2009b). Preparations were fixed in 4% PFA, 2.5% glutaraldehyde, and 0.2 mMCaCl2in 0.9 mMcacodylate buf-fer, pH 7.4, in a microwave oven (Biowave, Ted Pella) at 250 W, 30°C–32°C for 2 min, and then kept in the same fixative at a room temperature for 15 min. Then preparations were washed in cacodylate buffer and postfixed for 1 h in 1% osmium tetroxide. The samples were further contrasted in 2% uranyl acetate for 30 min and dehydrated in a graded series of acetone and water mixtures up to 100% acetone. Speci-mens were embedded in Embed 812 epoxy resin overnight at 60°C (Elec-tron Microscopy Sciences). Preparations were serially sectioned (50 nm thick) using a Leica Ultracut ultramicrotome and visualized using a JEOL 100 CX electron microscope equipped with a Hamamatsu digital camera and AMT software.
The analysis of micrographs was performed using ImageJ (National Institutes of Health) and Adobe Photoshop (Adobe Systems) software. The distribution of synaptic vesicles in Ib boutons was analyzed from micrographs at⫻7000 and ⫻14,000 magnification. The area occupied by vesicles was determined as previously described (Akbergenova and Byk-hovskaia, 2009b,2010). Vesicle distribution around AZs was analyzed from serial sections. We have included in the analysis only those AZs for which all the serial sections were collected. Vesicles were classified ac-cording to their position at the T-bar and the plasma membrane.
FM1– 43 photoconversion. The photoconversion procedure was
mod-ified from a prior study (Akbergenova and Bykhovskaia, 2009a). FM1– 43 (10M) was used to load the preparations. Subsequently, prep-arations were fixed in 4% PFA, 0.1% glutaraldehyde, and 0.2 mMCaCl2in
0.9 mMcacodylate buffer, pH 7.4, for 15 min at room temperature and washed in HEPES-buffered saline (in mM) as follows: 20 HEPES, 145 NaCl, 0.2 CaCl2, pH 7.2. Samples were preincubated for 10 min in 1.5
mg/ml DAB (Dako) in HEPES-buffered saline and illuminated for 9 min under a 60⫻ water-immersion objective using a mercury lamp with a 480⫾ 10 bandpass excision filter. The preparations were processed for conventional EM as described above.
Electrophysiology. Electrophysiological analysis was performed in Drosophila HL3.1 saline adjusted to pH 7.2 containing the following (in
mM): 70 NaCl, 5 KCl, 4 MgCl2, 10 NaHCO3, 5 Trehalose, 115 sucrose, 5
HEPES-NaOH, and 0.3 Ca2⫹. Evoked excitatory junctional potentials (EJPs) were recorded intracellularly from muscle fiber 6 of segment A3 using an Axoclamp 2B amplifier (Molecular Devices). Data acquisition was performed using Clampex 9.0 software (Molecular Devices) as pre-viously described (Cho et al., 2010). Bafilomycin (Baf, 4Min HL3.1; LC Laboratories) was bath applied to dissected larvae and incubated for 10 min. Nerve stimulation at 0.5 Hz in each experiment was performed using a programmable stimulator before and after Baf application (Master-8; AMPI). Minis and EJPs were analyzed using Mini Analysis 6.0.3 (Synaptosoft; RRID:SCR_002184) and Clampfit 9.0 (RRID: SCR_011323) software as previously described (Cho et al., 2010). The detection parameters were adjusted at traces with clearly detectable minis recorded from WT preparations, and the traces recorded at differ-ent conditions were analyzed blindly.
Immunostaining. Control and cpxSH1mutant third instar larvae were
stained as previously described (Rodal et al., 2008;Stevens et al., 2012). Briefly, fixations using the synaptogyrin antibody (anti-Gyrin) were
per-formed for 5 min in ice-cold 100% methanol. Fixations using NWK (anti-NWK, RRID: AB_2569355) and bruchpilot (BRP, nc82, RRID: AB_2314866) antibodies were performed for 45 min using in HL3.1 containing 4% formalde-hyde. Primary antibody dilutions were as follows: anti-BRP (nc82, DSHB), 1:100; anti-Gyrin, 1:500 (Stevens et al., 2012); and anti-NWK, 1:1000 (Rodal et al., 2008). Secondary antibodies were used at a dilution of 1:500 and included AlexaFluor-488-conjugated goat anti-rabbit, AlexaFluor-546-conjugated goat anti-mouse (Invitrogen, RRID: AB_143165, RRID:AB_141370), and AlexaFluor-488-conjugated goat anti-mouse (Invitrogen, RRID:AB_143160). Images were acquired with a LSM 700 confocal microscope using Zen software (Carl Zeiss MicroImaging).
Calcium imaging. The Ca2⫹imaging exper-iments were performed as described by Karu-nanithi et al. (1997). Briefly, stock solution of Fluo 4 AM (Invitrogen) was dissolved in DMSO and kept at⫺20°C. Final concentration of Fluo 4 AM in the bath was 12M. The dye was loaded by incubating preparations at room temperature in the dark. Image acquisition was performed using the real-time confocal micro-scope (PerkinElmer Life Sciences,⫻60 water-immersion objective). The preparations were imaged at rest, and then the imaging session was repeated during the stimulation at a 30 Hz frequency for 10 s.
Statistical analysis. Unpaired two-sided t
test, one-way ANOVA with post hoc Tukey analysis, and Shapiro-Wilk normality test were performed for dataset comparisons.
Results
Spontaneous release is enhanced
⬃70
fold at Drosophila 1b boutons in
com-plexin null mutants (cpx
SH1) (
Byk-hovskaia et al., 2013
), prompting the
question of how nerve terminals maintain
this drastically elevated activity. We first
assayed whether enhanced spontaneous
release depletes synaptic vesicles by
per-forming EM analysis and calculating the
overall vesicle density within the entire
bouton, the area occupied by a peripheral
vesicle cluster (
Akbergenova and
Byk-hovskaia, 2009b
), as well as the vesicle
density within these clusters (
Fig. 1
A). We
found no change in overall vesicle density
per individual bouton in cpx null mutants
compared with control (
Fig. 1
B, C).
Al-though the overall vesicle density was
un-changed in cpx
⫺/⫺boutons (
Fig. 1
C), the
area of vesicle clusters was larger in
cpx
⫺/⫺than controls (
Fig. 1
D).
More-over, synaptic vesicles were more
dis-persed in cpx
⫺/⫺boutons compared with
controls, as reflected by a decrease in
ves-icle density within a cluster (
Fig. 1
E). The
unchanged synaptic vesicle numbers (
Fig.
1
C) indicate that endocytosis is enhanced
to compensate for the elevated rate of
spontaneous fusion events in cpx
⫺/⫺.
Figure 1. Cpx deletion does not produce a depletion of synaptic vesicles but promotes vesicle dispersion. A, Outline of the area of peripherally clustered vesicles (purple shading). Scale bar, 0.5m. B, Representative micrographs of WT and
cpx⫺/⫺synaptic boutons. Vesicles are densely packed over the periphery of the WT bouton and are dispersed in the
cpx⫺/⫺bouton. Scale bar, 0.5m. C, Vesicle numbers are unaltered in cpx⫺/⫺boutons. D, The area occupied by the peripheral vesicle cluster is significantly increased in cpx⫺/⫺boutons. E, Synaptic vesicle density within the peripheral vesicle cluster is significantly reduced in cpx⫺/⫺boutons. F, Synaptic vesicle size is not altered by Cpx deletion (n⫽ 300). Data collected from 42 WT and 44 cpx⫺/⫺boutons (4 larvae for each line). *p⬍ 0.05. ***p ⬍ 0.001.
Furthermore, the change in synaptic vesicle density within
clus-ters (
Fig. 1
D) in cpx
⫺/⫺suggests alterations in vesicle recycling
pathways. To test whether the process of vesicle formation during
endocytosis may be altered, we compared the size of synaptic
vesicles in WT and cpx
⫺/⫺boutons (
Fig. 1
F ). The cumulative
distributions and average vesicle diameters were similar in both
lines, suggesting that the process of vesicle budding is not altered
by Cpx deletion. These results support the hypothesis that the
recycling pool of vesicles may be increased in cpx
⫺/⫺boutons to
enable multiple spontaneous fusion events. Alternatively, the
speed of the endocytic process may be increased in the mutant.
To investigate these possibilities, we performed a more detailed
analysis of vesicle distribution and combined it with labeling of
the recycling pool.
First, we quantified vesicles surrounding AZs. At Drosophila
motor boutons, AZs are represented by filamentous structures
(T-bars) attached to the synaptic membrane and surrounded by
vesicles. T-bars function to organize Ca
2⫹channels and other
elements of AZs to achieve the precision and speed necessary for
efficient neurotransmission (
Owald and Sigrist, 2009
). We
inves-Figure 2. Selective depletion of docked vesicles in the vicinity of T-bars in cpx⫺/⫺boutons. A, Micrograph illustrating morphometric analysis of vesicle numbers at different layers surrounding the T-bar. Scale bar, 150 nm. B, In cpx⫺/⫺boutons, vesicle numbers are unaltered in the immediate proximity to T-bars (50 –200 nm) but significantly depleted at a distance of 250 – 400 nm from the T-bar. C, Subsequent serial sections showing an AZ (arrow) with a T-bar at the synaptic membrane surrounded by vesicles. Scale bar, 100 nm. D, Micrograph illustrating the vesicle classification according to their position at the T-bar: docked and attached to the T-bar (“Attached,” red); docked in the vicinity of the T-bar but not attached to it (“Docked at AZ,” green); around the T-bar (“Around T-bar,” within a 150 nm radius outlined by the black circle, blue); intraterminal vesicles not situated in the vicinity or around T-bars (“Internal,” cyan). Scale bar, 100 nm. C, 3D reconstruction of a T-bar surrounded by vesicles shows a selective depletion in the pool of vesicles docked at AZ (green) and around T-bar (blue). For clarity, left panels for control and cpx⫺/⫺AZs represent only the T-bar with docked vesicles. F–H, Vesicle numbers quantified from 3D reconstructions. D, The number of attached vesicles (red) is unaffected by Cpx deletion. E, The number of vesicles docked at AZ (green) is reduced in cpx⫺/⫺boutons. G, The number of vesicles around T-bar are reduced in cpx⫺/⫺boutons. All the vesicles for each AZ are counted from complete 3D reconstructions of AZs. Data collected from 56 WT and 57 cpx⫺/⫺AZs (4 larvae for each line). ***p⬍ 0.001.
tigated how Cpx deletion affects the numbers of vesicles at
dif-ferent layers surrounding T-bars (
Fig. 2
A). Interestingly, we
dis-covered that cpx
⫺/⫺boutons have significant depletion of
vesicles in the vicinity of T-bars (at a distance of 250 – 400 nm;
Fig. 2
B), but not in the immediate proximity to T-bars (there are
similar vesicle numbers at a distance of 0 –200 nm;
Fig. 2
B). This
finding suggests that either vesicle docking or local recycling at
AZs can be altered in cpx
⫺/⫺boutons.
To examine this phenomenon more closely, we performed 3D
reconstruction of all serial sections containing individual T-bars
(
Fig. 2
C). Vesicles surrounding T-bars were quantified from
3D reconstructions. The vesicles situated within 300 nm from a
T-bar (
Fig. 2
D, black semicircle) were classified and
subdivi-ded into the following spatially restricted volumes: (1) vesicles
docked and attached to T-bar (“Attached,”
Fig. 2
D, red) which
are likely to colocalize with Ca
2⫹channels; (2) vesicles docked
near a T-bar but not attached to it (“Docked at AZ,”
Fig. 2
D,
green), which may be released in a Ca
2⫹-independent mode; and
(3) vesicles surrounding a T-bar but not docked to the membrane
(“Around T-bar,”
Fig. 2
D, blue) which may replenish either of
the two pools of docked vesicles. Vesicles outside of a 300 nm
T-bar radius were classified as “Internal” (
Fig. 2
D, cyan).
Synap-tic vesicles found in these spatially restricted volumes may reflect
various stages of preparation for the release process. Attached
vesicles are situated in close proximity to Ca
2⫹channels and
probably constitute the readily releasable pool responding to
ac-tion potentials (
Hallermann et al., 2010
). Docked at AZ vesicles
may be available for Ca
2⫹-independent release, whereas those
around the T-bar may require additional priming and docking
reactions before release (
Jiao et al., 2010
;
Hallermann and Silver,
2013
).
Upon quantification of vesicles in each spatially defined
vol-ume, we did not observe any significant change in the number of
attached vesicles in cpx
⫺/⫺boutons compared with WT (
Fig.
2
E, F, red), consistent with earlier studies (
Jorquera et al., 2012
).
However, the number of vesicles docked at the AZ (
Fig. 2
D, E,
green) was significantly reduced in cpx
⫺/⫺boutons compared
with WT (
Fig. 2
G). The specific depletion of docked at AZ vesicles
in cpx
⫺/⫺suggests that spontaneous release events, which are
massively enhanced in cpx
⫺/⫺, may occur independently and
proximal to the core T-bar machinery. In addition, the pool of
vesicles around the T-bar (
Fig. 2
D, E, blue) was also reduced in
cpx
⫺/⫺boutons (
Fig. 2
H ), suggesting that the process of vesicle
mobilization or recycling may be altered.
To investigate vesicle recycling in cpx
⫺/⫺boutons, we used
the activity-dependent lipophilic marker FM1– 43 that can be
used to monitor retrieved synaptic vesicles (
Cochilla et al.,
1999
;
Ryan, 2001
). First, we investigated vesicle recycling during
spontaneous activity, using passive dye loading performed in
the absence of stimulation. In cpx
⫺/⫺boutons, the FM1– 43
flu-orescence increased consistently as the dye was loaded passively
in the absence of stimulation for 0.5, 2, and 10 min (
Fig. 3
A, B).
After 10 min of loading, a plateau was reached, and increasing the
loading time to 20 min did not produce any further increase in
FM1– 43 fluorescence in cpx
⫺/⫺(
Fig. 3
A, B). The loading kinetics
suggests that, after 10 min, the recycling pool is fully labeled; thus,
exocytosis is supplied by the labeled vesicle pool, which does not
increase further.
In WT preparations, passive FM1– 43 loading produced very
weak FM1– 43 staining, which was only slightly above the
back-ground even after 10 min of loading (
Fig. 3
C,D). These results
demonstrate that substantial recycling of vesicles occurs in cpx
null NMJs, which is not observed in NMJs exhibiting normal
spontaneous release rates, suggesting that enhanced spontaneous
exocytosis in the cpx
⫺/⫺mutant elicits enhanced reuptake.
How-ever, we cannot rule out the possibility that Cpx contributes to
spontaneous endocytosis directly and that Cpx deficiency
com-promises vesicle recycling. To test whether this may be the case,
we accessed spontaneous FM1– 43 loading in the syntaxin
para-lytic mutant syx
3– 69(
Littleton et al., 1998
), which also has
en-Figure 3. Increased spontaneous activity in cpx⫺/⫺boutons drives an increase in the recycling pool of vesicles. A, Preparations passively loaded with FM1– 43 dye after different times of dye exposure. Images represent overlay of confocal z-stacks. There is very faint fluorescence at 0.5 min loading, which is increased at 10 min loading, but not increased further at 20 min loading. Scale bar, 5m. B, Fluorescence intensity measured over confocal stacks at cpx⫺/⫺preparations. No increase in the fluorescence is observed after 10 min loading, suggesting that the recycling vesicle pool reached its maximal capacity. Data collected from at least 70 boutons (4 larvae) for each data point. C, Overlays of confocal stacks showing WT, syx3– 69, and cpx⫺/⫺preparations loaded
passively with FM1– 43 for 10 min. Scale bar, 10m. D, Florescence intensity of WT, syx3– 69, and cpx⫺/⫺preparations passively loaded for 10 min shows a significantly higher fluorescence
for cpx⫺/ ⫺preparations, and for syx3– 69boutons, suggesting an increased recycling pool. Data collected from at least 30 boutons (4 larvae) for each genotype. E, Electron micrographs obtained
after FM1– 43 photoconversion show recycled (black) and nonrecycled (translucent) vesicles in WT and cpx⫺/⫺boutons after 0.5 (top) and 10 (bottom) min passive FM1– 43 loading. Scale bar, 200 nm. F, The number of recycled vesicles in WT and cpx⫺/⫺boutons. Vesicles are quantified from electron micrograph obtained using FM1– 43 photoconversion at dye loading times and in the absence of stimulation. Data collected from at least 10 boutons (3 larvae) for each data point. *p⬍ 0.05. **p ⬍ 0.01. ***p ⬍ 0.001.
Figure 4. Active FM1– 43 staining/destaining coupled with dye photoconversion and EM analysis suggests that the overall evoked and spontaneous recycling pathways are partially segregated in cpx⫺/ ⫺boutons. A, Overlay of confocal stacks showing WT and cpx⫺/⫺NMJs loaded with FM1– 43 dye during electrical stimulation of the nerve at 5 Hz for 5 min. There is increased FM1– 43 fluorescence in cpx⫺/⫺boutons. Scale bar, 5m. B, The FM1–43 fluorescence is increased in cpx⫺/⫺boutons after active dye loading. In both WT (Figure legend continues.)
hanced spontaneous release (
Lagow et al., 2007
). We found that
spontaneous FM1– 43 loading was enhanced in the syx
3– 69mu-tant compared with WT, but to a lesser extent than in cpx
⫺/ ⫺(
Fig. 3
C,D). This result is in agreement with measurements of
exocytic rates in both mutants (
Bykhovskaia et al., 2013
), which
have shown that spontaneous transmission in the syx
3– 69line is
enhanced compared with the WT line, but to a lesser extent than
in the cpx
⫺/ ⫺line.
Thus, our results suggest that enhanced recycling of vesicles
helps replenish the synaptic vesicle pool to maintain the high
spontaneous release rates observed in the cpx null. To determine
whether this is the case, we performed photoconversion of
inter-nalized FM1– 43 dye followed by EM analysis (
Harata et al., 2001
;
Schikorski and Stevens, 2001
). We counted vesicles that had
in-ternalized the dye (
Fig. 3
E, black) and examined it as a percentage
of the total number of vesicles in the bouton (
Fig. 3
F ). Only a few
vesicles (⬍0.2%) were stained in WT preparations, even after 10
min of passive loading (
Fig. 3
F, open bars), consistent with the
low levels of fluorescence observed in WT (
Fig. 3
C.) In contrast,
⬃3% of vesicles were stained after 0.5 min of passive loading,
increasing dramatically, to 15%–20% after 10 min (
Fig. 3
F, closed
bars). Thus, the recycling vesicle pool is drastically increased in
cpx null animals, positively correlating with the overall increase in
the rate of spontaneous release.
We next asked whether this observed spontaneous recycling
pool participates in evoked release. To address this question, we
performed FM1– 43 loading by stimulating the preparations at 5
Hz for 2 or 5 min, followed by photoconversion and EM analysis
(
Fig. 4
A–D). The 2 and 5 min loading times in cpx
⫺/⫺and WT
produced similar levels of FM1– 43 fluorescence (
Fig. 4
B),
sug-gesting that the recycling pool was fully loaded by 2 min of
stim-ulation in both lines. However, FM1– 43 fluorescence was
significantly higher in cpx
⫺/⫺boutons. It should be noted that
evoked synaptic transmission is decreased in cpx
⫺/⫺boutons
(
Jorquera et al., 2012
); therefore, it is unlikely that the recycling
pool used by the evoked release component in cpx
⫺/⫺boutons is
increased. The enhanced levels of FM1– 43 uptake detected in
cpx
⫺/⫺compared with WT is likely to result from the enhanced
spontaneous release component that is occurring concurrently
during stimulation, reflecting an increase in the spontaneous
re-cycling pool in cpx
⫺/⫺. This result indicates that the recycling
pools contributing to evoked and spontaneous release in cpx
⫺/⫺boutons are additive.
To quantify the recycling pool at stimulated preparations, we
performed FM1– 43 photoconversion for WT and cpx
⫺/⫺prep-arations and visualized loaded FM1– 43 by EM after 5 min of
stimulation at a frequency of 5 Hz (
Fig. 4
C,D). The number of
stained vesicles in cpx
⫺/⫺boutons significantly exceeded the
number of stained vesicles in control boutons (
Fig. 4
D). Because
⬍0.2% of stained vesicles in WT boutons result from
spontane-ous release (
Fig. 4
F ), the observed recycled vesicles after 5 min of
stimulation in WT boutons (
Fig. 4
D) are almost exclusively from
retrieval following evoked release. Therefore, the observed
differ-ence in recycled vesicles in WT versus cpx
⫺/⫺boutons is likely a
result of the massively enhanced spontaneous release rates that
occur in the cpx null. This difference (⬃20%;
Fig. 4
D) between
genotypes closely matches the size of the spontaneous recycling
pool observed in the absence of stimulation (
Fig. 3
F ). This result
suggests that vesicles recycle independently following evoked and
spontaneous release and that separable recycling pathways exist
for these forms of neurotransmission in the cpx null.
To test whether spontaneous and evoked recycling pools
re-main completely separated, or whether they may become
inter-mixed during the release process, we loaded preparations with
the dye during nerve stimulation (5 min at 5 Hz) and monitored
the kinetics of passive destaining (
Fig. 4
E, F ). We found that
destaining was significantly faster in cpx
⫺/⫺preparations (
Fig.
4
F, the exponential decay
⫽ 8.34 ⫾ 0.23 for cpx
⫺/⫺vs
⫽
18.82
⫾ 0.61 for WT, p ⬍ 0.001). This result may be interpreted
as a release of the evoked recycling pool in cpx
⫺/⫺preparations
produced by enhanced spontaneous release. However, because
the vesicle pool stained in cpx
⫺/⫺during stimulation is
com-prised of both evoked and spontaneous recycling pools, it is also
possible that a faster overall destaining kinetics in cpx
⫺/⫺is
pro-duced by a fast initial release of vesicles retrieved though the
spontaneous pathway and a subsequent slower release of the
evoked recycling pool. In support of the latter interpretation,
cpx
⫺/⫺preparations (
Fig. 4
F, gray line) exhibited a biphasic
destaining, where the initial phase (0 –3 min, slope of liner
regres-sion b
⫽ ⫺899.4 ⫾ 86.9, r ⫽ ⫺0.993) was significantly faster than
a subsequent phase (3–15 min, b
⫽ ⫺196.2 ⫾ 8.9, r ⫽ ⫺0.997).
During the initial phase (3 min of destaining),
⬃40% of the
flu-orescence in cpx
⫺/ ⫺boutons was lost, and the fluorescence of
cpx
⫺/ ⫺boutons became similar to that of WT boutons. This
destaining kinetics can be interpreted as the fusion of the
spon-taneous recycling pool during the initial phase, followed by the
fusion of the evoked pool during the subsequent phase.
Interest-ingly, the slope of the second destaining phase in cpx
⫺/ ⫺prepa-rations (3–15 min, b
⫽ ⫺196.2 ⫾ 8.9, r ⫽ ⫺0.997) was
significantly higher than that in WT preparations (b
⫽ ⫺101.2 ⫾
11.2, r
⫽ ⫺0.982), suggesting a faster loss of stained vesicles even
during the second phase, presumably corresponding to the
re-lease of the evoked pool. To further investigate whether the
evoked and spontaneous recycling pools intermix during the
re-lease process, we compared passive destaining in cpx
⫺/⫺prepa-rations loaded passively (10 min) with the prepaprepa-rations loaded
during the nerve stimulation (5 min at 5 Hz). We found that the
difference in destaining kinetics between actively and passively
loaded preparations was very modest (
Fig. 4
G), although
statis-tically significant ( ⫽ 5.13 ⫾ 0.18 min for active staining vs ⫽
7.07
⫾ 0.21 min for passive staining, p ⬍ 0.01). Thus, cpx
⫺/⫺preparations loaded actively show a somewhat slower destaining,
suggesting that the evoked recycling pool is released in the
spon-taneous mode, but with a slower rate than the sponspon-taneous
recycling pool. Together, these results support a model that
in-termixing of the spontaneous and evoked vesicle pools does
oc-cur during the release phase, although it is likely that the
intermixing is partial.
4
(Figure legend continued.) and cpx⫺/⫺, the recycling pool is fully loaded after 2 min of stimulation (at 5 Hz), and it is not further increased at 5 min loading. FM1– 43 fluorescence is significantly higher in cpx⫺/⫺boutons for each of the loading times. Data collected from at least 15 boutons (6 larvae) for each data point. C, Electron micrographs showing an increased number of recycled (black) vesicles in the cpx⫺/⫺bouton after active dye loading (5 min at 5 Hz). Scale bar, 500 nm. D, The number of recycled vesicles determined by the dye photoconver-sion coupled with EM analysis is increased in cpx⫺/⫺boutons after active dye loading (5 min at 5 Hz). Data collected from 20 boutons for each genotype. E, WT and cpx⫺/⫺NMJs actively loaded with FM1– 43 during 5 min stimulation at a 5 Hz (0 min) at different time points during passive destaining (3, 7, and 15 min). Scale bar, 5m. F, The kinetics of passive destaining of actively loaded WT and cpx⫺/⫺NMJs. There is biphasic destaining at cpx⫺/⫺boutons, with a rapid dye loss during the initial 3 min of destaining followed by a slower destaining phase (between 3 and 15 min). Data collected from 35 boutons (9 larvae) for each genotype. Normal-ized FM-43 destaining (botton) shows a significantly faster dye loss at cpx⫺/⫺preparations.
G, The kinetics of passive destaining of cpx⫺/⫺preparations loaded actively (5 min at 5 Hz, solid line) and passively (10 min, dotted line). Data collected from 35 boutons (9 larvae) for each condition. *p⬍ 0.05. ***p ⬍ 0.001.
To further examine whether evoked and
spontaneous recycled vesicles are distinctly
mobilized, we took advantage of the proton
pump blocker Baf. Acute Baf application
in-hibits vesicle refilling; thus, the degree of
de-pression in the presence of Baf can be used
to monitor loss of the recycling vesicle pool
because recycled vesicles cannot participate
in subsequent rounds of neurotransmitter
release (
Cousin and Nicholls, 1997
;
Akber-genova and Bykhovskaia, 2007
). To test
whether the spontaneous release
compo-nent can deplete the evoked recycling pool,
we recorded spontaneous and evoked
post-synaptic responses (mEPSPs and EPSPs,
re-spectively) using sharp electrode potential
recordings from the postsynaptic muscle.
After recording basal neurotransmission,
we applied Baf (0.4
M) for 10 min and then
recorded additional mEPSPs and EPSPs
(
Fig. 5
A). We reasoned if the spontaneous
and evoked recycling pools intermix, the
en-hanced spontaneous release events in
cpx
⫺/⫺in the presence of Baf would
eventu-ally deplete the available vesicle pools, and
we would observe a depression in EPSPs. In
contrast, we anticipated that control NMJs
would not exhibit Baf-dependent depletion
due to the comparably low rate of
spontane-ous release events that would not deplete
vesicle pools during the 10 min of Baf
appli-cation. As predicted, control preparations
did not exhibit a significant depression in
either mEPSP frequency (4.1
⫾ 0.8 vs 4.9 ⫾
1.0 s) or EPSP amplitude (18.6⫾0.8vs21⫾
0.6 mV) after Baf treatment (
Fig. 5
A, B,
white bar). In contrast, cpx
⫺/⫺mutants
ex-hibited an
⬃50% decrease in mEPSP
fre-quency (46.1
⫾ 3.5 vs 87.9 ⫾ 4.4 s) and an
⬃35% decrease in EPSP amplitude (9.7 ⫾
0.3 vs 15.1
⫾ 0.4 mV) after Baf treatment
(
Fig. 5
A,B, gray bar). A potential confound
in these experiments is that cpx
⫺/⫺prepara-tions have reduced evoked release (
Hunt-work and Littleton, 2007
;
Jorquera et al.,
2012
), and this could potentially affect the
depression rates in cpx
⫺/⫺. To bypass this
confound, we used a Cpx mutant (HB
mCpx I) that has normal evoked release but
maintains highly elevated spontaneous
re-lease rates (
Cho et al., 2014
) (
Fig. 5
A). HB
Cpx mutants exhibited Baf-dependent
de-pression similar to the cpx null (36.9⫾4.6vs
85.9
⫾ 6.4 s mEPSP frequency, and 13.7 ⫾
0.3 vs 20.3
⫾ 0.9 mV EPSP amplitude).
To-gether, these results suggest that the elevated spontaneous release
events in the cpx null and the HB Cpx line deplete the pool of vesicles
available for evoked release, consistent with recycled vesicles pools
intermixing and becoming available for both spontaneous and
evoked release.
It should be noted that mEPSP frequency in the cpx
⫺/⫺and
HB mCpx1 lines before the treatment could be underestimated
due to high release rates and a potential overlap of individual
mEPSPs, and this would produce an underestimation in the
Baf-dependent depression of spontaneous release. Despite that, the
degree of Baf-dependent depression of spontaneous release
sig-nificantly exceeded the depression observed for evoked release
(
Fig. 5
B, C; 47.5
⫾ 2.6% for spontaneous vs 35.2 ⫾ 3.8% for
evoked, p
⬍ 0.001). These results support the conclusion that the
segregation of evoked and spontaneous recycling pools is only
partial.
Figure 5. Spontaneous and evoked vesicles pools are depleted by the elevated spontaneous transmission in cpx⫺/⫺and HB mCpx I lines treated with the proton pump blocker Baf. A, Sample spontaneous (left) and evoked (right) traces of the indicated genotypes (Control, cpx⫺/⫺, and HB mCpx I). After recording basal minis and EJPs (black traces), larvae were treated with 4MBaf for 10 min. After Baf treatment, the recordings were repeated (red lines). Post-treatment depression in both spontaneous and evoked transmission in the mutant lines but not in the control line. B, Spontaneous transmission is significantly reduced in cpx⫺/⫺ and HB mCpx I lines following Baf treatment (cpx⫺/⫺⫽ 52.4 ⫾ 3.8% of basal mini frequency [n ⫽ 8] and HB mCpx I ⫽ 42.3 ⫾ 3.1% of basal mini frequency [n⫽ 7]). Control animals exhibit only a minor decrease (88.4 ⫾ 6.7% of basal mini frequency [n ⫽ 7]). C, cpx⫺/⫺and HB mCpx I lines exhibit a modest but significant decrease in evoked transmission following Baf treatment (cpx⫺/⫺⫽ 64.8 ⫾ 2.6% of basal EPSP amplitude [n ⫽ 8] and HB mCpx I ⫽ 68.2 ⫾ 8.2% of basal EPSP amplitude [n ⫽ 7]). Control animals exhibited EJP amplitudes of 89.2⫾ 5.8% (n ⫽ 7) compared with the basal response. Each n value indicates a single muscle recording, with data generated from at least three individual larvae of each genotype. **p⬍ 0.01. ***p ⬍ 0.001. ****p⬍ 0.0001.
Together, these results suggest that
cpx
⫺/⫺terminals have an increased
recy-cling pool of vesicles, which is comprised of
partially segregated evoked and
spontane-ous pools. It could be suggested that the
elevated spontaneous exocytosis in cpx
⫺/⫺boutons enhances vesicle retrieval, and this
process occurs independently of nerve
stim-ulation. However, we cannot rule out the
possibility that cpx
⫺/⫺terminals have
mod-ified synaptic architecture, endocytic
ma-chinery, or Ca
2⫹levels, and these defects
produce enhanced vesicle retrieval in the
ab-sence of stimulation. To explore this
possi-bility, we examined synaptic architecture
and Ca
2⫹levels in cpx
⫺/⫺boutons.
Immu-nostaining for the AZ marker BRP and the
vesicle marker synaptogyrin (Gyrin) did not
show any detectable alterations in the
syn-aptic architecture of cpx
⫺/⫺boutons (
Fig.
6
A). Immunostaining for the endocytic
periactive zone marker NWK (
Rodal et al.,
2008
) suggested that the endocytic
peri-active zone is unaltered in cpx
⫺/⫺boutons
(
Fig. 6
B). Finally, imaging Fluo-4
AM-loaded terminals indicated that similar
Ca
2⫹levels are observed in cpx
⫺/⫺and WT
boutons at rest and during stimulation (
Fig.
6
C). These results support the idea that the
enhanced spontaneous exocytosis observed
in cpx
⫺/⫺boutons produces an increased
compensatory retrieval, which does not
de-pend on increased Ca
2⫹levels.
These findings suggest that evoked and
spontaneous recycling pools are largely
segregated during endocytosis, although
they may partially intermix during the
release process. To explore how the
recycling pools are formed during
endo-cytosis, we analyzed the spatial
distribu-tion of retrieved vesicles. We reasoned
that different endocytic pathways are
likely to produce different distributions of
FM1– 43-stained vesicles around AZs
(
Fig. 7
A). In particular, fast vesicle
re-trieval without the loss of vesicle identity
(
Murphy et al., 1998
;
Aravanis et al., 2003
)
would produce preferential staining of the
“Attached” vesicles (
Fig. 7
A1, red). In
contrast, retrieval at the periactive zone
followed by fast recycling (
Watanabe et
al., 2013a
,
b
) would produce preferential
staining of the vesicles “Around T-bar”
and possibly “Docked at AZ” (
Fig. 7
A2,
blue and green). Finally, an endocytic
pathway may involve the intraterminal
vesicle pool (
Rizzoli and Betz, 2004
,
2005
), which would produce preferential
staining of “Internal” vesicles (
Fig. 7
A3,
cyan). To discriminate between these
pathways, we analyzed the spatial
distri-bution of spontaneous and evoked
recy-cling pools.
Figure 6. cpx⫺/⫺mutants exhibit normal synaptic architecture and calcium levels compared with controls. A, Overall distri-bution of AZs is unaltered in the cpxSH1mutant compared with controls. Control and cpxSH1mutant larval NMJs were stained with antibodies to the AZ protein, BRP (anti-NC82), and the synaptic vesicle marker, synaptogyrin (anti-gyrin). Scale bars: main, 4m; inset, 2m. B, Overall distribution of the endocytic zone marker NWK is unaltered in the cpxSH1mutant compared with controls. Control and cpxSH1mutant larval NMJs were stained with antibodies against BRP and the periactive zone-enriched endocytic protein, NWK (anti-NWK). C, Calcium levels at rest and upon stimulation are unaltered in the cpxSH1mutant compared with controls. Scale bar, 10m. Image represents terminals loaded with Fluo-4 AM during the stimulation. Graph represents Fluo-4 fluorescence intensity at rest and during the stimulation; n⫽ 15 for each genotype.
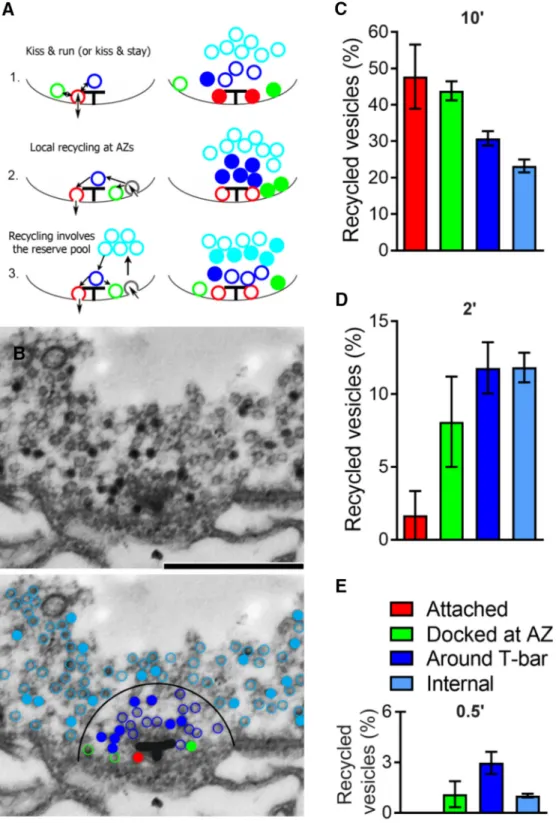
Figure 7. The spatial organization of vesicles recycled spontaneously at cpx⫺/⫺boutons. A, Diagram schematically showing that different endocytic mechanism would produce different spatial distributions of recycling vesicles around AZ. A1, Vesicles recycle without losing their identity: vesicles docked and attached to T-bars (Attached, red) are fused and retrieved (kiss and run mechanism). Such a pathway would produce preferential staining of attached vesicles (right, filled red circles). A2, Vesicles are recycled at the periactive zone and are directed to AZs. Such a pathway would produce preferential staining of vesicles around T-bar and docked at AZ (right, filled blue and green circles). A3, Recycled vesicles are intermixed with intraterminal vesicles and subsequently directed to AZs. Such a pathway would produce preferential staining of internal vesicles (right, filled cyan circles). B, Electron micrograph showing a T-bar surrounded by vesicles. The preparation was loaded with dye for 10 min. There are stained vesicles (black), many of which surround the T-bar. Scale bar, 500 nm. Bottom, Same micrograph with color-coded vesicles. Filled circles represent stained vesicles. Red represents attached. Green represents docked at AZ. Blue represents around T-bar. Cyan represents internal. The T-bar is outlined for clarity. A larger proportion of stained vesicles around the T-bar (filled blue vs filled cyan). C, The proportion of recycled vesicles within different groups after 10 min passive loading. A lower proportion of internal (cyan) stained vesicles compared with the attached (red) and docked at AZ (green) vesicles. Data collected from 14 AZs (2 larvae). D, The proportion of recycled vesicles at different groups after 2 min passive loading. A very low proportion of stained attached vesicles (red). Data collected from 12 AZs (2 larvae). E, The proportion of recycled vesicles at different groups after 30 s passive loading. The highest proportion of stained vesicles occurs around T-bar (blue). Data collected from 12 AZs (2 larvae).
First, we investigated the recycling
pathway that drives spontaneous fusion
by analyzing the spatial distribution of
vesicles stained after passive dye loading at
cpx
⫺/ ⫺boutons (
Fig. 7
B, C; 10 min
load-ing). Interestingly, we found that
⬃50%
of docked vesicles were stained (green and
red bars) and that the proportion of
stained docked vesicles significantly
ex-ceeded the proportion of stained internal
vesicles (⬃20%). This result suggests that
spontaneous vesicle retrieval is likely to
take place in the vicinity of T-bars, as
shown in
Figure 7
A1, A2. It should be
noted, however, that the 10 min dye
load-ing paradigm (
Fig. 7
B, C) would allow
considerable vesicle intermixing.
There-fore, we analyzed the spatial distribution
of stained vesicles produced with shorter
loading times (
Fig. 7
D, E). We found that
the shortest loading time used (30 s;
Fig.
7
E) produced a preferential staining of the
vesicles around T-bars (
Fig. 7
E, blue bar),
but none of the stained vesicles belonged
to the attached group (
Fig. 7
E, absent red
bar). This result suggests that the “kiss and
run” release and retrieval mode is
un-likely. A longer loading time (2 min;
Fig.
7
D) produced a very small proportion of
attached stained vesicles (2%, red bar),
and a larger proportion of stained vesicles
docked at AZs (8%, green bar), with the
largest proportion of stained vesicles
around the T-bar (13%, blue bar). This
overall retrieval pattern is most consistent
with the recycling pathway presented in
Figure 7
A2 where vesicles become
re-trieved in the vicinity of AZs and
subse-quently dock to the plasma membrane,
with some of the recycled vesicles being
directed toward the internal pool.
We next examined whether a similar
scenario would occur with the evoked
re-cycling pathway. To address this question,
we analyzed the distribution of recycled
vesicles (
Fig. 8
A) for preparations loaded
with dye during nerve stimulation (5 Hz
for 5 min). Because WT preparations
show very low spontaneous release rates
(
⬍1 vesicle per second per bouton) (
Byk-hovskaia et al., 2013
), the staining pattern
at stimulated evoked WT preparations
largely reflects the evoked recycling
path-way. In contrast, the staining pattern at
stimulated cpx
⫺/⫺preparations would
re-flect the simultaneous activity of evoked
and spontaneous recycling. We found
that in WT preparations the highest
pro-portion of recycled vesicles were in the
in-ternal pool (
Fig. 8
B, cyan bar). No
recycled vesicles were found in the
at-tached group in WT boutons (
Fig. 8
B,
ab-sent red bar, C). This staining pattern
Figure 8. The spatial organization of vesicles recycled during the nerve stimulation is altered in cpx⫺/⫺boutons. Preparations were stimulated at 5 Hz for 5 min. A, Representative micrograph showing recycled vesicles at WT and cpx⫺/⫺boutons after active dye loading. Stained (black) vesicles are uniformly distributed over the entire cpx⫺/⫺bouton, whereas in the WT bouton most of the stained vesicles are not in the vicinity of the T-bar (the area outlined by a black semicircle, at a radius of 300 nm around the T-bar). Scale bar, 500 nm. B, In WT preparations, recycled vesicles predominantly belong to the internal group (cyan bar). Data collected from 12 AZs (2 larvae). C, In cpx⫺/⫺boutons, recycled vesicles are distributed evenly and include those attached and docked at AZs, as well as internal. Data collected from 27 AZs (2 larvae). D, A model for evoked (1) and spontaneous (2) recycling pathways.