HAL Id: hal-01302191
https://hal.archives-ouvertes.fr/hal-01302191
Submitted on 13 Apr 2016
HAL is a multi-disciplinary open access
archive for the deposit and dissemination of
sci-entific research documents, whether they are
pub-lished or not. The documents may come from
teaching and research institutions in France or
abroad, or from public or private research centers.
L’archive ouverte pluridisciplinaire HAL, est
destinée au dépôt et à la diffusion de documents
scientifiques de niveau recherche, publiés ou non,
émanant des établissements d’enseignement et de
recherche français ou étrangers, des laboratoires
publics ou privés.
Experimental investigation of the wall dynamics of the
A-pillar vortex flow
Benjamin Levy, Pierre Brancher
To cite this version:
Benjamin Levy, Pierre Brancher.
Experimental investigation of the wall dynamics of the
A-pillar vortex flow.
Journal of Fluids and Structures, Elsevier, 2015, 55, pp.540-545.
Open Archive TOULOUSE Archive Ouverte (OATAO)
OATAO is an open access repository that collects the work of Toulouse researchers and
makes it freely available over the web where possible.
This is an author-deposited version published in :
http://oatao.univ-toulouse.fr/
Eprints ID : 15685
To link to this article :
DOI:10.1016/j.jfluidstructs.2015.03.020
URL :
http://dx.doi.org/10.1016/j.jfluidstructs.2015.03.020
To cite this version :
Levy, Benjamin and Brancher, Pierre Experimental investigation of
the wall dynamics of the A-pillar vortex flow. (2015) Journal of
Fluids and Structures, vol. 55. pp. 540-545. ISSN 0889-9746
Any correspondence concerning this service should be sent to the repository
administrator:
staff-oatao@listes-diff.inp-toulouse.fr
Brief Communication
Experimental investigation of the wall dynamics
of the A-pillar vortex flow
Benjamin Levy
a,b,c,d,e,n, Pierre Brancher
b,c,d,e,faDepartment of Engineering Science, University of Auckland, 70 Symonds Street, 1010 Auckland, New Zealand bUniversité de Toulouse, Allée Camille Soula, F-31400 Toulouse, France
cINPT, Allée Camille Soula, F-31400 Toulouse, France dUPS, Allée Camille Soula, F-31400 Toulouse, France
eIMFT (Institut de Mécanique des Fluides de Toulouse), Allée Camille Soula, F-31400 Toulouse, France fCNRS, F-31400 Toulouse, France Keywords: A-pillar Fluid–structure interaction Aero-acoustic Excitation Vortex Automobile
a b s t r a c t
The influence of the A-pillar vortex on the wall flow of the side window of a car is investigated experimentally using a 301 dihedron model. The measurement of the unsteady pressure at the wall provides a map of the pressure fluctuation intensity, and a spectral analysis is performed to track the dominant frequencies of the wall pressure fluctuations. The wall flow generated by the vortex structure that develops parallel to the side-wall is characterised by means of particle image velocimetry (PIV). Its structure is analysed and compared to cross-sections of the A-pillar vortex in order to identify the different separation and reattachment lines. A comparison of the field of turbulent kinetic energy obtained by PIV with the map of the pressure fluctuations shows a correlation between the structure of the A-pillar vortex and the pressure fluctuations. It is found that the dominant wall pressure fluctuations are located at the secondary separation line, whereas the primary reattachment line does not show any significant pressure variations, that the A-pillar vortex will not naturally break down and that discrete vortices may be associated with the pressure fluctuations.
1. Introduction
The A-pillar vortex is generated at the junction between the windshield and the front side window when a road vehicle is in motion. The upstream flow bypassing the windshield rolls into an intense three-dimensional coherent structure which interacts with the side window. Besides increasing the drag of the vehicle (Hucho, 1998), one consequence of the A-pillar vortex is to generate a source of aeroacoustic noise perceived inside the vehicle (Hoshino and Kato, 2002). The noise level inside a car can be perceived as a criterion of quality which can impact the commercial success of a vehicle. Consequently, many studies have tried to quantify or to control its aeroacoustic contribution. Nevertheless, some fundamental aspects of the flow dynamics are still not clearly understood.
The topology of the vortex structure was partly identified by (Watanabe et al., 1978;Haruna et al., 1990) who highlighted the existence of regions of separation and reattachment on the wall. Later, most of the studies have focused on the impact of
http://dx.doi.org/10.1016/j.jfluidstructs.2015.03.020
n
Corresponding author at: Department of Engineering Science, University of Auckland, 70 Symonds Street, 1010 Auckland, New Zealand. Tel./fax: þ64 022 420 3881. E-mail address:benjamin.levy@hotmail.fr(B. Levy).
side mirrors (Ono et al., 1999;Watkins and Oswald, 1999;Zimmer, 2004), the influence of the yaw angle (Alam et al., 2003;
Murad et al., 2004;Howel et al., 2009), the modification of the A-pillar radius of curvature (Ono et al., 1999;Gohlke et al., 2010) or strategies for active flow control (Lehugeur, 2007;Lehugeur et al., 2010). It has been identified that an idealised geometry with sharp corner would create a more defined vortex structure than the one observed on a real road vehicle. The aerodynamic pressure applied on the side window or panel is correlated to the yaw angle and the free stream turbulence. All these past studies have emphasised the complexity and numerous parameter of the A-pillar flow. The detailed analysis of the topology and dynamics of the A-pillar vortex created by a generic bluff body, namely a 301 dihedron, was the subject of multiple PhD dissertations over the past decade (Hoarau, 2006;Lehugeur, 2007;Levy, 2009), and has only been published relatively recently (Hoarau et al., 2008;Gilliéron et al., 2010;Levy and Brancher, 2013), as well asHowel et al. (2009)and
Passmore et al. (2010). The A-pillar vortex flow is found to be composed of a primary vortex and a secondary, counter-rotating vortex of lower intensity and smaller dimensions. The center of the primary vortex shifts away from the wall as it develops along the edge of the A-pillar while the secondary vortex remains near the wall. Despite erratic meandering, it has been shown that the primary vortex core displays a low-frequency motion of precession around its time-averaged position. In parallel to these works on the flow dynamics, other studies focused on the acoustics.Lawson et al. (2008)used a full scale automobile to map the field of pressure coefficient on the side window. Besides observing significant discrepancy between wind tunnel and road testing results, their map shows a decreasing pressure coefficient Cpas the measurements
were made closer to the A-pillar. The same observation was made byHowel et al. (2009), who also pointed out at the existence of two peaks of unsteady pressure as the vortex structure grew in size. It has been predicted numerically that the pressure fluctuation level is larger where the Cplevel is lower (Ono et al., 1999). Recent development of computational fluid
dynamics and computational aero-acoustics models has allowed to decompose the perceived noise as a function of their sources: the trailing edge flow perturbations and the turbulent boundary layer (Murad et al., 2013). The surface noise signature was predicted using a Lattice Boltzmann method.
Nevertheless, no correlation has ever been made to our knowledge between the detailed structure of the A-pillar vortex obtained from particle image velocimetry, planes parallel and perpendicular to the side panel, and the pressure fluctuations at the surface of the side window. This is the aim of the present paper, which presents an analysis of the wall pressure fluctuations correlated to particle image velocimetry measurements.
2. Experimental set-up
The experimental model is the same as inLevy and Brancher (2013). It is composed of a simplified geometry, namely a dihedron at 301 angle fixed on a reversed Ahmed body, replacing what is classically the back of the body (Fig. 1). The characteristic length associated with the model, defined as the square root of the apparent cross-section, is L0¼ 0:336 m.
The experiments were conducted in the S1 wind tunnel (Eiffel type) at the Institut de Mecanique des Fluides de Toulouse. One particularity of this type of wind tunnel is to have an open test section. The diameter of the flow inlet is 2.4 m and the distance to the flow outlet is 1.9 m. The turbulent intensity is less than 0.3%. The model was fixed on a mast, 1.5 m above the ground, at the centre of the test section. The velocity of the air flow was U0¼ 8 m=s, which corresponds to a typical Reynolds
number for the experiments of Re ¼ 1:7 # 105. The typical Reynolds number for a road vehicle is between 106 and 107,
however LES simulation compared to experimental data has shown that Reynolds numbers greater than 104 have little
impact on the topology and flow dynamics of a simplified road vehicle with sharp edges (Alam et al., 2003;Krajnović and Davidson, 2003,2004).
Particle Image Velocimetry (PIV) at a frequency of 4 Hz was used for the experimental data acquisition of the time averaged flow field. 1000 image pairs were acquired for each PIV plane, which proved to be sufficient for a convergence of the averaged flow field. Measurements were made in different sets of PIV planes, parallel to the side wall. The nearest set to the wall is at a minimum gap distance of 0.006 L0between the laser sheet and the wall surface (Fig. 1). The equipment
used for the PIV is a Quantel Laser CFR 200 with 2 # 200 mJ cavities operating at a frequency of 4 Hz and a PCO Sensicam camera with a resolution of 1280 # 1024 pixels mounted with a 55 mm Nikon lens. For the seeding of the flow,
60° 1.49 L0 0.86 L0 1.16 L0 Flow x y z side view top view PIV planes 2.50 L0
Di-Ethyl-Hexyl-Sebacat (DEHS) with particles of diameter 0:5–1:5
μ
m and a time response of about 25μ
s (Raffel et al., 2007)was used. The flow was analysed by cross-correlating 50% overlapping windows of 16 # 16 pixels, yielding fields of 160 # 128 with a spatial resolution of 1.25 mm (0.00375 L0). Less than 2% of the calculated vectors were detected as outliers
using a sort based on the norm, the signal-to-noise ratio, and a median test filter. These vectors were replaced using a second-order least-square interpolation scheme. There was a 2.4% uncertainty on the instantaneous data which were then averaged over 1000 frames. The uncertainties were estimated using 95% confidence interval without a normal distribution assumption, according toBenedict and Gould (1996). The same method and equipment had been successfully used in the past byPerrin et al. (2007)andLevy and Brancher (2013).
The pressure fluctuations were measured by a Bruel and Kjaer 1/4” Type 4135 microphone. The microphone was inserted in a wall cavity located inside the model. From the outside, only a microscopic pinhole of diameter 0.7 mm (0.0021 L0) was
visible and linked the surface pressure to the microphone. Such setup avoids having an exposed flush-mounted microphone as well as avoids any alteration of the surface flow and was first introduced byBlake (1970). Measurements were made at 105 different locations scattered on the side panel of the model at a frequency of 22.05 kHz. The open circuit frequency response of the microphone is 4 Hz to 100 kHz, for a dynamic range of 42–172 dB or 1.6 mv/Pa and the accuracy of the acquisition chain is r 0:5 Pa. The time length for each recording was 30 s.
3. Results 3.1. Wall pressure
The analysis of the pressure on the side wall provides two significant results. First, the pressure coefficient, Cp¼
P $P0
ð Þ= 1 2
ρ
U20! "
, matches the one recorded around a road vehicle (Lawson et al., 2008) in terms of magnitude and spatial repartition. The largest pressure drop is recorded near the upstream tip of the dihedron with a reduction of pressure drop further downstream from the tip and the A-pillar junction (Fig. 2(a)). The same observation, with a Cpof same magnitude,
was made byMurad et al. (2013)despite using a model with a rounded junction. The pressure coefficients are of similar magnitude than the ones recorded byHowel et al. (2009), who performed their experiments at Reynolds number of an order of magnitude greater than the present investigation. Second, the pressure fluctuation field, measured by the root mean square of the time-resolved pressure signal PRMS, displays a different tendency than the Cp. It is observed that the
maximum values of PRMSare not located at the A-pillar junction but significantly below (Fig. 2(b)). The maxima form distinct
patches with local extrema due to the low spatial resolution of the unsteady pressure measurements in this specific region (Fig. 2(c)). In spite of this spurious effect, the maxima are all aligned and it can be assumed that the maximum PRMS
describes a line inclined by approximately 241 from the x-axis (dashed line inFig. 2(b)).
A spectral analysis of the pressure signal is performed using the Matlab Welch's power spectral density estimate function. The results at four different locations along the A-pillar junction, designated as N1 $ 4inFig. 2(c), are displayed in
Fig. 3(a). Near the front of the model, the N1spectrum displays a small, wide, peak around 300 Hz, which corresponds to a
Strouhal number St ¼ fL0=U0of approximately 12.6.Hoarau et al. (2008)observed at the same frequency a high coherence of
x/L
0y/L
00
0.5
1
1.5
0
0.4
0.8
-1.2-0.8-0.5-0.1
C
px/L
0y/
L
00
0.5
1
1.5
0
0.4
0.8
1 5 10 14
P
RMSx/L
0y/L
00
0.5
1
1.5
0
0.4
0.8
N1 N3 N4 N5 N2 N7 N6Fig. 2. (a) Field of wall pressure coefficient Cp; (b) field of root mean square pressure PRMSin Pa; the dashed line represents a line of maximum PRMS; (c) mesh grid
low-magnitude pressure signals on the side panel, on a similar model with slanted sides. However, a representative length scale associated with this frequency, fL1=U0' 1, leads to L1' 0:08L0which does not match any characteristic length of our
model, unlikeHoarau et al. (2008). The phenomenon inducing this frequency does not persist along the A-pillar as it cannot be found on any other recordings. It might be linked to the specific dynamics of the flow at the very beginning of the A-pillar, the lack of a robust vortex structure guiding the flow fluctuations at that stage preventing their frequencies to propagate downstream. A Strouhal of similar value was measured bySims-Williams et al. (2006)on the C-pillar vortex dynamics and was identified as corresponding to the rate of discrete vortices production. Consequently, we can emit the hypothesis that a similar phenomenon may take place along the pillar but is only recorded at the ignition point of the A-pillar vortex due to its comparative small scale.
As the primary and secondary vortex structures develop along the A-pillar, a wide range of frequencies between 10 Hz and 450 Hz, which correspond to St¼0.42 and 18.9, are recorded with similar levels of intensity. A frequency of approximately 13 Hz, St¼0.55, can be associated with a representative length scale of the order of the full length of the A-pillar vortex.Hoarau et al. (2008)raised the hypothesis that it could be associated with the meandering of the vortex structure. However, a previous study byLevy and Brancher (2013)has identified the meandering of the primary vortex for the exact same configuration to be of much lower frequency, namely 1–2 Hz or St ¼ 0:042$0:084.
A relative peak of higher frequency, at lower power density levels, is recorded at 2250 Hz 75%, which corresponds to St¼94.5. It also defines the beginning of a logarithmic decrease of the power spectral density. Yet, a distinct frequency can be identified at 5940 Hz, which corresponds to St¼249.5. The power spectral density of pressure fluctuations at three measuring points distributed along a vertical line (points N5 $ 7inFig. 2(c)) shows the attenuation of the 2250 Hz frequency limit as the measurements are made further away from the A-pillar junction (Fig. 3(b)). Based on this result, we can make the assumption that this high frequency fluctuation originates at the A-pillar junction and that it is a localised phenomenon. Also, no well-defined frequency can be identified from the power spectral density plot, which emphasises the complexity of the A-pillar flow. The wall surface pressure fluctuation is mainly the result of multiple excitations in the frequency range
100 101 102 103 104 105 10−14 10−12 10−10 10−8 10−6 10−4 Frequency [Hz]
Power Spectral Density
N1 N2 N3 N4 100 101 102 103 104 105 10−14 10−12 10−10 10−8 10−6 10−4 Frequency [Hz]
Power Spectral Density
N5 N6 N7
Fig. 3. Log–log Power spectral density of pressure fluctuations at the seven locations N1-7on the side wall.
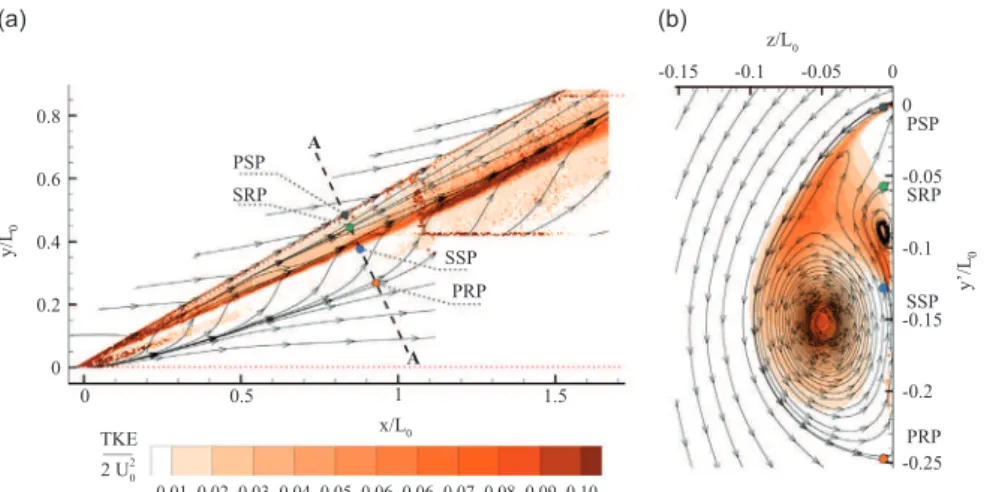
0 0.5 1 1.5 0 0.2 0.4 0.6 0.8 0.01 x/L y/L A TKE 2 U ___ PRP PSP SRP SSP A z/L -0.15 -0.1 -0.05 0 -0.25 -0.2 -0.15 -0.1 -0.05 0 SRP PRP PSP SSP y’/L 0.10 0.09 0.08 0.07 0.06 0.06 0.05 0.04 0.03 0.02
Fig. 4. (a) Normalised turbulent kinetic energy field parallel to the wall at a distance of 0.006 L0and streamlines. The red dotted line outlines the shape of
the model, the black dashed line localises the PIV plane normal to the wall and to the axis of the A-pillar vortex as inLevy and Brancher (2013). (b) Section “A-A”, collinear to the y0-axis, 251 inclined from the y-axis; normalised turbulent kinetic energy field in the plane perpendicular to the wall. Color dots mark
the location of the primary separation point (PSP), the secondary separation point (SSP), the primary reattachment point (PRP) and the secondary reattachment point (SRP). (For interpretation of the references to color in this figure caption, the reader is referred to the web version of this article.)
r2250 Hz. This frequency could be resulting from the turbulence emanating from the shear layer and evolving in the A-pillar vortex (Hoarau et al., 2008).
3.2. Wall flow
To understand the origin of the pressure fluctuations on the side panel, we performed multiple PIV acquisition in planes parallel to the surface (Fig. 1). The streamlines obtained from the PIV measurements close to the wall display the conical shape of the A-pillar vortex tube and its inclination of approximately 251 from the x-axis (Fig. 4(a)). The trace of the streamlines confirms that the separation and reattachment points observed in the cross-sections of the A-pillar vortex analysed inLevy and Brancher (2013)correspond to separation and reattachment lines extending along the side wall.
This is in agreement with past studies on real road vehicles (Haruna et al., 1990;Gaylard, 2007), which justifies the relevance of the 301 dihedron as a generic model to reproduce the A-pillar vortex flow.
The A-pillar vortex is characterised by the presence of an axial flow. PIV measurement in planes parallel to the wall and normal to the vortex axis allows the swirl number S, defined as the ratio of the local azimuthal velocity and the axial velocity, to be estimated. This non-dimensional parameter predicts the stability of vortices with axial flow (Billant et al., 1998) and particularly defines that vortex breakdown is observed when the Swirl number is S 4 ffiffiffi
2 p
. The axial velocity at various locations along the A-pillar vortex axis was obtained with the present set-up and multiple sets of PIV planes at various gap distances from the side wall (data not shown). The azimuthal velocity component is obtained from the previously published results (Levy and Brancher, 2013). For the present investigation, the swirl number of the A-pillar primary vortex is estimated between 0.85 and 0.97. Though the criterion for vortex breakdown has been experimentally found for free, unbounded vortices with axial flow, the present estimate suggests that vortex breakdown is not active for the A-pillar vortex flow. Therefore it can be conjectured that the measured velocity fluctuations at the wall are the results of unsteadiness of the A-pillar vortex and its surrounding flow with a physical origin instead of a vortex breakdown phenomenon.
These regions of unsteadiness can be identified by analysing the structure of the turbulent kinetic energy (TKE) field in the vicinity of the side wall (Fig. 4(a)). A well defined straight line of high turbulent kinetic energy inclined by 241 from the x-axis is observed. By comparison with a perpendicular cross-section of the vortex (Fig. 4(b)), this line is identified as corresponding to the mean position of the secondary separation line. Above the secondary separation line, the TKE is five times lower than along the separation line. Below this line, the magnitude of TKE is almost negligible and the primary reattachment line does not generate any significant fluctuations near the wall despite the meandering of the primary vortex. By comparison of this result with the map of maximum values of PRMS(Fig. 2(b)), we observe that the line of maximum
fluctuating kinetic energy which has been identified as the secondary separation line matches the line of maximum PRMs.
We conclude that the wall flow lying between the primary vortex and secondary vortex, identified as the secondary separation line, is responsible for producing the main pressure fluctuations at the wall.
4. Conclusion
Based on the premise that the A-pillar vortex is generating noise inside a road vehicle, we have investigated the aerodynamic structure responsible for this perturbation. The results of the present study have let us identify the origin of the main side panel excitation. The side panel of our model possesses a well-defined region of excitation. Correlated to the results published byLevy and Brancher (2013), we identified the PRMSto be aligned with the secondary separation line
localised between the primary and the secondary vortex.
The PIV data obtained during this study provides the axial velocity of the A-pillar which, combined with the azimuthal velocity, defines the robustness of a vortex. The A-pillar vortex will not naturally break down as its Swirl number is lower than ffiffiffi
2 p
.
Finally, through a frequency analysis, it was found that the frequencies of fluctuating pressure were of a different magnitude than the primary vortex precession displacement frequency. These fluctuations are emanating at the A-pillar corner and no representative length scales could be associated with these frequencies. Near the onset of the A-pillar vortex, a frequency that corresponds to St ¼12.6 was recorded and could be the results of discrete vortices. However, this hypothesis could not be visually verified.
References
Alam, F., Watkins, S., Zimmer, G., 2003. Mean and time-varying flow measurements on the surface of a family of idealised road vehicles. Experimental Thermal and Fluid Science 27, 639–654.
Benedict, L.H., Gould, R.D., 1996. Towards better uncertainty estimates for turbulence statistics. Experiments in Fluids 22, 129–136.
Billant, P., Chomaz, J., Huerre, P., 1998. Experimental study of vortex breakdown in swirling jets. Journal of Fluid Mechanics 376, 183–219.
Blake, W.K., 1970. Turbulent boundary-layer wall-pressure fluctuations on smooth and rough walls. Journal of Fluid Mechanics 44, 637–660.
Gaylard, A., 2007. Cfd simulation of side glass surface noise spectra for a bluff suv. SAE Transactions 115, 99–115.
Gilliéron, P., Leroy, A., Aubrun, S., Audier, P., 2010. Influence of the slant angle of 3d bluff bodies on longitudinal vortex formation. Journal of Fluids Engineering 132, 051104.
Gohlke, M., Beaucoin, J., Amielh, M., Anselmet, F., 2010. Shape influence on mean forces applied on a ground vehicle under steady cross-wind. Journal of Wind Engineering and Industrial Aerodynamics 98, 386–391.
Haruna, S., Nouzawa, T., Kamimoto, I., 1990. An experimental analysis and estimation of aerodynamic noise using a production vehicle. SAE Transactions, 667–680.
Hoarau, C., 2006. Mesures multipoints pression – vitesse pour l'analyse de l'aérodynamique d'écoulements décollés instationnaire – Application aux véhicules terrestres (Ph.D. thesis). Université de Poitiers.
Hoarau, C., Borée, J., Laumonier, J., Gervais, Y., 2008. Unsteady wall pressure field of a model A-pillar conical vortex. International Journal of Heat and Fluid Flow 29, 812–819.
Hoshino, H., Kato, H., 2002. A new objective evaluation method of wind noise in a car based on human hearing properties. Acoustical Science and Technology 23, 17–24.
Howel, J., Fuller, J., Passmore, M., 2009. The Effect of Free Stream Turbulence on A-pillar Airflow. SAE Technical Paper 2009-01-0003. Hucho, W.H., 1998. Aerodynamics of Road Vehicles, 4th edition, SAE.
Krajnović, S., Davidson, L., 2003. Numerical study of the flow around the bus-shaped body. Journal of Fluids Engineering 125, 500–509. Krajnović, S., Davidson, L., 2004. Large-Eddy Simulation of the Flow around Simplified Car Model. SAE Technical Paper 2004-01-0227.
Lawson, A., Sims-Williams, D., Dominy, R., 2008. Effects of on-road turbulence on vehicle surface pressures in the A-pillar region. SAE International Journal of Passenger Cars—Mechanical Systems 1, 333–340.
Lehugeur, B., 2007. Caractérisation et contrôle des structures tourbillonnaires longitudinales en aérodynamique automobile (Ph.D. thesis). Université Pierre et Marie Curie.
Lehugeur, B., Gilliéron, P., Kourta, A., 2010. Experimental investigation on longitudinal vortex control over a dihedral bluff body. Experiments in Fluids 48, 33–48.
Levy, B., 2009. Analyse et contrôle de l'écoulement de montant de baie (Ph.D. thesis). Université Paul Sabatier, Toulouse III.
Levy, B., Brancher, P., 2013. Topology and dynamics of the A-pillar vortex. Physics of Fluids 25, 037102.
Murad, N., Naser, J., Alam, F., Watkins, S., 2004. Simulation of Vehicle A-Pillar Aerodynamics Using Various Turbulence Models. SAE Paper 0231, pp. 55–70.
Murad, N., Naser, J., Alam, F., Watkins, S., 2013. Computational fluid dynamics study of vehicle A-pillar aero-acoustics. Applied Acoustics 74, 882–896.
Ono, K., Himeno, R., Fukushima, T., 1999. Prediction of wind noise radiated from passenger cars and its evaluation based on auralization. Journal of Wind Engineering and Industrial Aerodynamics 81, 403–419.
Passmore, M., Spencer, A., Wood, D., Jowsey, L., 2010. The Application of Particle Image Velocimetry in Automotive Aerodynamics. SAE Technical Paper 2010-01-0120.
Perrin, R., Cid, E., Cazin, S., Sevrain, A., Braza, M., Moradei, F., Harran, G., 2007. Phase-averaged measurements of the turbulence properties in the near wake of a circular cylinder at high Reynolds number by 2C-PIV and 3C-PIV. Experiments in Fluids 42, 93–109.
Raffel, M., Willert, C.E., Wereley, S.T., Kompenhans, J., 2007. In: Particle Image Velocimetry—A Practical Guide. Springer. ISBN: 978-3-540-72308-0. Sims-Williams, D.B., Kaye, S., Watkins, S., 2006. Periodic Structures within the Formation Region of Trailing Vortices. SAE Technical Paper 2006-01-1032. Watanabe, M., Harita, M., Hayashi, E., 1978. The Effect of Body Shapes on Wind Noise. SAE Paper.
Watkins, S., Oswald, G., 1999. The flow field of automobile add-ons with particular reference to the vibration of external mirrors. Journal of Wind Engineering and Industrial Aerodynamics 83, 541–554.