Marc Feissel Jean-Louis Teboul Paolo Merlani Julio Badie Jean-Pierre Faller Karim Bendjelid
Plethysmographic dynamic indices predict fluid
responsiveness in septic ventilated patients
Received: 16 May 2006 Accepted: 27 February 2007 Published online: 29 March 2007 © Springer-Verlag 2007
Electronic supplementary material The online version of this article
(doi:10.1007/s00134-007-0602-6) contains supplementary material, which is available to authorized users.
Funding: No external funding
This work was performed in the Medical Intensive Care Unit, Centre Hospitalier, Belfort, France.
M. Feissel · J. Badie · J.-P. Faller Centre Hospitalier, Intensive Care Unit, Belfort, France
J.-L. Teboul
Paris Sud Medical School, Réanimation médicale, Bicêtre Hospital,
Le Kremlin Bicêtre, France P. Merlani · K. Bendjelid (u)
Geneva University Hospitals, Intensive Care Unit, Department of Anesthesiology, Pharmacology and Intensive Care, 1211 Geneva 14, Switzerland e-mail: [email protected] Tel.: +41-22-3827452
Fax: +41-22-3827455
Abstract Objectives: In septic patients, reliable non-invasive pre-dictors of fluid responsiveness are needed. We hypothesised that the respiratory changes in the amplitude of the plethysmographic pulse wave (∆PPLET) would allow the prediction of changes in cardiac index following volume administration in mechan-ically ventilated septic patients. Design: Prospective clinical investi-gation. Setting: An 11-bed hospital medical intensive care unit. Patients: Twenty-three deeply sedated septic patients mechanically ventilated with tidal volume≥ 8 ml/kg and equipped with an arterial catheter and a pulse oximetry plethysmographic sensor. Interventions: Respiratory changes in pulse pressure (∆PP), ∆PPLET and cardiac index (transthoracic Doppler echocardiography) were determined before and after volume infusion of colloids (8 ml/kg). Measurements and main results: Twenty-eight volume challenges were performed in 23 patients. Before volume expan-sion,∆PP correlated with ∆PPLET (r2= 0.71, p< 0.001). Changes in
cardiac index after volume expansion significantly (p< 0.001) correlated with baseline∆PP (r2= 0.76) and
∆PPLET (r2= 0.50). The patients were defined as responders to fluid challenge when cardiac index in-creased by at least 15% after the fluid challenge. Such an event oc-curred 18 times. Before volume challenge, a∆PP value of 12% and a∆PPLET value of 14% allowed discrimination between responders and non-responders with sensitivity of 100% and 94% respectively and specificity of 70% and 80% respec-tively. Comparison of areas under the receiver operator characteristic curves showed that∆PP and ∆PPLET predicted similarly fluid responsive-ness. Conclusion: The present study found∆PPLET to be as accurate as
∆PP for predicting fluid
respon-siveness in mechanically ventilated septic patients.
Keywords Fluid resuscitation · Heart–lung interactions · Volume responsiveness · Monitoring
Introduction
There are now a great number of clinical studies support-ing the usefulness of dynamic indices based on heart–lung interaction for guiding volume resuscitation in patients re-ceiving mechanical ventilation [1, 2]. Accordingly, the res-piratory variations of arterial pulse pressure, of “pulse
con-tour” stroke volume, and of Doppler aortic blood velocity have been shown to predict volume responsiveness far bet-ter than static markers of preload such as cardiac filling pressures or dimensions [3–5]. The pulse oximeter could be an attractive device for detecting volume responsiveness since it is non-invasive and easy to use and also since the pulse oximetry plethysmographic signal resembles the
pe-ripheral arterial pressure waveform [6]. In this regard, res-piratory variation of pulse oximeter waveforms has been correlated with that of systolic arterial pressure [6–8] and pulse pressure [9].
The plethysmographic “pulse” wave (nadir–peak) displayed on the monitor is assumed to reflect the pul-satile changes in absorption of the infrared light between the light source and the photo detector of the pulse oximeter [10]. Consequently, the beat-to-beat changes in the amplitude of the plethysmographic pulse wave are assumed to be the result of the beat-to-beat changes in stroke volume transmitted to the arterial blood [11]. In this respect, the degree of respiratory changes in the amplitude of the plethysmographic pulse (∆PPLET) wave should be a potential marker of respiratory stroke volume variation and hence a marker of volume responsiveness [12, 13]. In this regard, ∆PPLET was demonstrated to be influenced by changes in preload [14]. In a clinical study, it was recently shown that each time ∆PPLET was greater than the threshold value of 15%, fluid challenge resulted in an increased of cardiac output by more than 15% [15]. On the other hand, ∆PPLET values lower than 15% poorly predicted volume responsiveness, maybe because half of the patients were ventilated with tidal volumes lower than 8 ml/kg [15], a condition where dynamic indices like pulse pressure variation fail to predict accurately volume responsiveness [16].
The aim of our study was to test the hypothesis that
∆PPLET could be as valuable to predict volume respon-siveness as respiratory changes in arterial pulse pressure in septic patients receiving mechanical ventilation with a tidal volume > 8 ml/kg and exhibiting neither inspiratory ef-forts nor arrhythmias.
Materials and methods
The institutional review board for human subjects ap-proved the protocol, considering it as a part of routine clinical practice, and patients were informed that they were participating in this study. We included only me-chanically ventilated patients with septic shock, as defined by the International Sepsis Definitions Conference [17], who were equipped with a systemic arterial catheter and for whom the decision to give fluid was taken by their attending physician in the context of standard treatment. We excluded those patients with moderate to severe valve disease and those who experienced inspiratory efforts or cardiac arrhythmias.
Patient management
Sedation and analgesia were provided by continuous infu-sion of midazolam and remifentanil titrated for a Ramsay score of 6 [18]. Patients were therapeutically paralysed
(with cisatracurium) if the attending physician deemed this appropriate. All patients were ventilated with positive pressure ventilation (tidal volume, 8–10 ml/kg of body weight). The respiratory rate was set to obtain a PaCO2 of 35–45 mmHg. The inspired fraction of oxygen was adjusted in order to obtain an arterial oxygen saturation
> 92%. Inspiratory to expiratory ratio was approximately
0.5:1 in all patients.
Haemodynamic monitoring
All pressure transducers were referenced to mid-chest. All patients were monitored using a pulse oximetry sensor with plethysmography (SpO2/Pleth, M3150A technology, Philips Medical Systems, Andover, MA) attached to the patient’s finger (phalanx) with a clip.
Cardiac output measurements
All patients had a colour-Doppler echocardiography-investigation shortly before and after volume infusion. Complete two-dimensional echocardiography and colour-Doppler ultrasound examinations were performed using a commercially available echocardiographic system (Sonos 5500, Philips Medical Systems, Eindhoven, Netherlands) in a semi-recumbent position with head at 45 °. All tracings were recorded by one investigator, and each value represented the average of five tracings. Echocardiography–Doppler traces were analysed off line. The cardiac output was measured at the level of the aortic annulus. Aortic annulus diameter (DAo) was measured at mid-systole, (T wave on ECG) and during the expiratory phase of the respiratory cycle, from a zoomed two-dimensional image in the parasternal long axis view. From an apical five-chamber view, aortic flow (at the annulus level) was recorded using pulsed Doppler. Veloc-ity–time integral for aortic flow (VTIAo) was measured at the end of the expiratory period. With the use of these measurements, stroke volume could be calculated using the following formula: (DAo)2× 3.14× VTIAo/4. To obtain cardiac output, stroke volume was multiplied by heart rate. The cardiac output was divided by the body surface area (in m2) to obtain the cardiac index. We did not recalculate the area of the aortic orifice over time since it is assumed to be unchanged because of the fibrotic nature of the annulus.
Respiratory change in the amplitude of the plethysmographic pulse wave
Arterial blood pressure–time, pulse plethysmography– time, ECG–time and airway pressure–time curves were
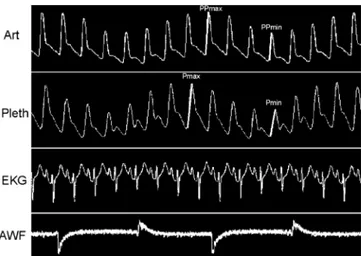
Fig. 1 Simultaneous recording of systemic arterial pressure (Art),
plethysmographic “pulse” (Pleth), EKG and airway flow (AWF) curves in one patient with large∆PP and ∆PPLET. (AcqKnowledge software, Biopac Systems, Santa Barbara, CA, USA)
digitised at 500 Hz and sampled using an analogue/ numeric system (Biopac Systems, Goleta, CA, USA). Recording was assessed using an MP100wsw Starter sys-tem for PC/Windows (AcqKnowledge software, Biopac Systems, Santa Barbara, CA, USA). The data acquired online were stored on a laptop computer for subsequent analysis of the respiratory changes in arterial pulse pressure (∆PP) and ∆PPLET (Fig. 1). The inter-observer variability of ∆PP and ∆PPLET measurements was de-termined in a “blinded” fashion, with a second observer (M. F., J. B.). All measurements were made before the analysis of∆PP so as not to be influenced by the results. The ∆PP and ∆PPLET were calculated as previously described [4] and expressed in percentage. Pulse pressure was calculated on a beat-to-beat basis as the difference between systolic and diastolic arterial pressure. Maximal pulse pressure (PPmax) and minimal pulse pressure (PPmin) values were determined over a single respiratory cycle. To assess the respiratory changes in pulse pressure, the percent change in pulse pressure was calculated as:
∆PP = 100 × {(PPmax–PPmin)/([PPmax+PPmin]/2)}.
Study protocol
All studies were performed in patients in a semi-recumbent position with head at 45 ° position. Measurements were performed in duplicate, first before volume expansion and then 30 min after volume expansion using 8 ml/kg 6% hydroxyethyl starch (Voluven; Fresenius Kabi, Sèvres, France). The ventilatory settings and the rate of adminis-tration of vasoactive drugs were not changed throughout the study. Regarding the echocardiographic measurement of cardiac output, the area of the aortic orifice has been measured only before fluid infusion as it is assumed to be
unchanged because of the fibrotic nature of the annulus. Therefore, VTIAo was the only variable measured before and after fluid challenge.
Statistical analysis
For the statistical analysis, Stata Statistical Software, Re-lease 8.0®(Stata Corporation, College Station, TX, USA) was used. Data were compared using paired t-test for con-tinuous variables. Ordinal data or non-normally distributed continuous data were compared using the Mann–Whitney
U-test or the non-parametric Wilcoxon rank sum test for
paired observations. Correlations were determined using linear regression analysis. We also randomly selected a sin-gle paired observation for each of the n = 23 patients and performed all analyses that had already been conducted.
For the set of measurements obtained before fluid challenge, the intraobserver and interobserver variability of VTIAo measurements was determined in all patients and expressed as the mean percent error (i.e. the difference between two observations, divided by the mean of the two observed values).
Patients were divided into two groups according to the percent increase in cardiac index in response to volume expansion. In accordance with previous studies [1, 2, 15, 16, 19], we took the benchmark of 15% for dif-ferentiating responders from non-responders [20]. We compared haemodynamic parameters before and after vol-ume expansion in responder and non-responder patients using a paired t-test for continuous variables. Receiver operating characteristic (ROC) curves for responders–non-responders were generated for∆PP and ∆PPLET, varying the discriminating threshold of each parameter. The areas under the ROC curves (± SE) were calculated for each parameter and compared [21]. A method of comparing the areas under ROC curves derived from the same cases. All tests were two-tailed, and a p-value less than 0.05 was considered statistically significant.
Results
Twenty-three patients (mean age 62± 17 years) were in-cluded. Fourteen patients survived. Mean tidal volume was 9.0± 0.9 ml/kg and plateau pressure less than 30 cmH2O in all patients. A total of 28 fluid challenges were analysed. All patients received catecholamines: dobu-tamine (5µg/kg/min) in association with norepinephrine (n = 4), norepinephrine alone (n = 15) and dopamine (5µg/kg/min) alone (n = 4). Mean norepinephrine dose was 0.42± 0.24 µg/kg/min. No patient experienced hypothermia at the time of the study. Haemodynamic variables before and after volume infusion are shown in Table 1. Volume infusion produced an increase in cardiac index from 2.5± 0.7 to 3.0 ± 0.9 l/min/m2(p< 0.0001).
Before VE After VE pa HR (beats/min) 111± 25 101± 24 < 0.001 MAP (mmHg) 74± 16 87± 19 < 0.01 ∆PP (%) 18± 11 5± 3 < 0.001 ∆PPLET(%) 23± 15 7± 5 < 0.001 CI (l/min/m2) 2.5± 0.7 3.0± 0.9 < 0.001
HR, heart rate; MAP, mean arterial pressure; ∆PP, respiratory changes in arterial pulse pressure;
∆PPLET, respiratory changes in the amplitude of the plethysmographic pulse wave (with pulse oxime-ter); CI, cardiac index; VE, volume expansion;aBefore VE/after VE (paired t-test)
Table 1 Effects of volume
infusion on patients’
haemodynamic parameters (28 fluid challenges in 23 patients)
Fig. 2 Linear regression analysis of the relationship between change
in ∆PP and change in ∆PPLET following volume infusions (28 fluid challenges in 23 patients).∆PP, respiratory changes in arterial pulse pressure;∆PPLET, respiratory changes in the amplitude of the plethysmographic pulse wave (with pulse oximeter)
Before volume expansion, ∆PP correlated with
∆PPLET (r2= 0.71, p< 0.001). Changes in ∆PP cor-related with changes in ∆PPLET following volume expansion, (p< 0.01; Fig. 2). Changes in cardiac index
Fig. 3 Linear regression analysis
of the relationship between∆PP and ∆PPLET measured before volume expansion and changes in cardiac index (CI) following volume expansion (28 fluid chal-lenges in 23 patients). p < 0.05 was considered significant
after volume expansion significantly (p< 0.001) cor-related with baseline ∆PP (r2= 0.76) and ∆PPLET (r2= 0.50) (Fig. 3). The fluid-induced decreases in ∆PP and ∆PPLET were significantly correlated with the fluid infusion–induced increases in cardiac index (r2= 0.64 and
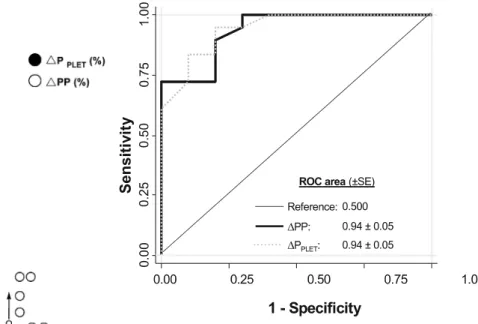
r2= 0.38; p< 0.01, respectively). In 18 cases patients were classified as responders (cardiac index increase≥ 15%), and in 10 cases patients were classified as non-responders. Before volume expansion, mean∆PP and ∆PPLET were significantly higher in responders than in non-responders (p< 0.01; Fig. 4). Before volume challenge, a ∆PP value of 12% and a ∆PPLET value of 14% allowed discrim-ination between responders and non-responders with sensitivity of 100% and 94% respectively and specificity of 70% and 80% respectively. Comparison of areas under the ROC curves showed that ∆PP and ∆PPLET predicted fluid responsiveness similarly (Fig. 5). The combination of the two measurements (∆PP and ∆PPLET) did not improve the power of prediction.
When a single paired observation for each of the 23 patients was selected (after removing five pairs of values using a random selection) the results were statistically unchanged (see ESM). For 23 pairs of measurements, the areas under the ROC curves were 0.99 (0.98–1.0) and 0.96 (0.85–1.0) for ∆PP (optimal cut-off value of 13%) and∆PPLET (optimal cut-off value of 12%) respectively.
Fig. 4 Distribution of all the individual results (28 fluid challenges
in 23 patients) of∆PP and ∆PPLET(measured before volume expan-sion in %). R, Responders (cardiac index increase≥ 15% after vol-ume challenge); NR, non-responders (cardiac index increase < 15% after volume challenge). Points and arrows indicate mean and SD respectively
The intraobserver variability of VTIAo measurements was 0.5± 0.7% and the interobserver (M. F., J. B.) variability of VTIAo measurements was 2.2± 0.8%.
Discussion
The present study shows that ∆PPLET is as valuable as ∆PP for predicting volume responsiveness in
mechani-cally ventilated septic patients. Similar threshold values were found for∆PPLET (14%) and for∆PP (12%).
Previous studies demonstrated that pulse pressure vari-ation was more reliable than static parameters of preload to predict volume responsiveness in critically ill patients re-ceiving mechanical ventilation [1, 4, 16, 19]. The rationale for guiding fluid therapy on∆PP or on other heart–lung in-teraction indices [1–3, 21] is that influence of positive pres-sure ventilation on haemodynamics is greater when central blood volume is low than when it is normal or high.
The finger pulse oximetry plethysmographic signal resembles the peripheral arterial pressure waveform [12]. Analysis of the respiratory variation in pulse oxime-ter waveforms has been proposed for a long time as a technique with which to assess blood volume status in mechanically ventilated patients [13]. In a recent study,
Fig. 5 Receiver operating characteristic (ROC) curves comparing
the ability of∆PP and ∆PPLETto discriminate responders (cardiac index increase ≥ 15%) and non-responders to volume expansion (n = 28). The areas under the ROC curve were not significantly different (p = NS)
we demonstrated that a derived plethysmographic index— the respiratory change in pre-ejection period—was as accurate as∆PP to assess preload responsiveness in septic mechanically ventilated patients [22]. In the present study, we used∆PPLETsince we postulated that this index might reflect the respiratory changes in left ventricular stroke volume. Indeed, by reflecting the pulsatile changes in absorption of infrared light between the light source and the photo detector of the pulse oximeter, the ‘pulse’ wave is assumed to be the result of the beat-to-beat changes in stroke volume transmitted to arterial blood, which was reported to correlate with∆PP in mechanically ventilated patients [9]. In this respect,∆PPLETis potentially a marker of respiratory stroke volume variation and thus of volume responsiveness [14, 15]. Interestingly, we found threshold values of 12% and 14% that allowed discrimination between responder and non-responder patients for ∆PP and ∆PPLET respectively. These values were very close to the threshold values (13%, 11.8%, 17%, 12%) found in previous studies examining the significance of ∆PP to predict fluid responsiveness in septic patients [4, 16, 22, 23]. It has to be noted that the prediction of fluid responsiveness was not improved by the combination of the two measurements (∆PP and ∆PPLET). This may suggest that these indices give similar information in terms of prediction of fluid responsiveness. However, as indicated by the data displayed in Fig. 3, the proportion-ality between ∆PP and cardiac index changes following volume expansion was closer to the identity line than was the proportionality between ∆PPLET and cardiac index
changes. These results emphasise the clinical usefulness of ∆PP not only for predicting volume responsiveness but also for quantifying the haemodynamic response to fluid challenge, thus confirming the findings of a previous study [4]. On the other hand, the advantages of ∆PPLET are its acquisition with a non-invasive technique (pulse plethysmography) and its immediate availability, which allows accurate assessment of volume responsiveness in mechanically ventilated patients before insertion of any arterial catheter.
Some limitations of this work should be acknow-ledged. First, we studied sedated patients such that our results cannot be extrapolated to patients experiencing spontaneous breathing activity, a condition that is fre-quently encountered in the intensive care unit (ICU). Second, our patients had regular cardiac rhythm, a manda-tory condition for the use of heart–lung interaction indices [1]. Third, we used a tidal volume > 8 ml/kg in our patients and thus we cannot extrapolate our results to patients ventilated with lower tidal volume. Indeed, in such conditions of low cyclic changes in intrathoracic and transpulmonary pressures, volume responsiveness may coexist with low values of∆PP [16] and presumably in ∆PPLET. In this regard, in a series of 22 hypotensive patients ventilated with tidal volumes ranging from 6 to 10 ml/kg (median value of 8 ml/kg), Natalini et al. showed that ∆PPLET values lower than the threshold value of 15% poorly predicted volume responsiveness, while all
∆PPLETvalues above 15% were associated with a positive response to fluid challenge [15]. Fourth, we defined the positive response to volume challenge as an increase in cardiac index by more than 15% after fluid administration. We chose 15% because this benchmark was employed in
numerous previous studies which addressed the issue of fluid responsiveness [4, 15, 16, 22]. Since the diameter of the aortic annulus is assumed to remain constant during short-term haemodynamic interventions, we only measured the response of VTIAo to volume challenge. In this respect, the benchmark of 15% increase was far above the low intraobserver variability of the VTIAo (0.5± 0.7%) that we calculated. Fifth, we did not measure abdominal pressure since there was no clinical suspicion of increased abdominal pressure in this series of medical ICU patients suffering from septic shock. Our results cannot be extrapolated to patients with significant increase in abdominal pressure, since an animal study recently showed that increasing intra-abdominal pressure may result in increase in ∆PP [24]. Finally, in our study, we recorded correct pulse oximetry signals in all patients who were not hypothermic and in whom peripheral vasocon-striction was unlikely. Indeed, in this context of septic shock, vasomotor tone was expected to be reduced and catecholamines were given in the attempt to restore organ perfusion pressure. However, the pulse oximetry signal might be of poor quality in the presence of hypothermia or arterial vasoconstriction, although the quality of the displayed signal has been improved with the current generation of pulse oximetry devices.
In conclusion, the present study shows that ∆PPLET may be as valuable as∆PP for predicting volume respon-siveness in septic patients ventilated with a tidal volume greater than 8 ml/kg. Since∆PPLET is obtained from pulse oximetry, a totally non-invasive monitoring technique, it may represent an attractive method to detect fluid respon-siveness in mechanically ventilated patients in whom arte-rial catheters have not yet been inserted.
References
1. Bendjelid K, Romand JA (2003) Fluid responsiveness in mechani-cally ventilated patients: a review of indices used in intensive care. Intensive Care Med 29:352–360 2. Michard F, Teboul JL (2002) Predicting
fluid responsiveness in ICU patients: a critical analysis of the evidence. Chest 121:2000–2008
3. Feissel M, Michard F, Mangin I, Ruyer O, Faller JP, Teboul JL (2001) Respiratory changes in aortic blood velocity as an indicator of fluid re-sponsiveness in ventilated patients with septic shock. Chest 119:867–873
4. Michard F, Boussat S, Chemla D, Anguel N, Mercat A, Lecarpentier Y, Richard C, Pinsky MR, Teboul JL (2000) Relation between respiratory changes in arterial pulse pressure and fluid responsiveness in septic patients with acute circulatory failure. Am J Respir Crit Care Med 162:134–138 5. Reuter DA, Felbinger TW, Schmidt C,
Kilger E, Goedje O, Lamm P, Goetz AE (2002) Stroke volume variations for assessment of cardiac responsiveness to volume loading in mechanically ventilated patients after cardiac surgery. Intensive Care Med 28:392–398
6. Awad AA, Ghobashy MA, Stout RG, Silverman DG, Shelley KH (2001) How does the plethysmogram de-rived from the pulse oximeter relate to arterial blood pressure in coro-nary artery bypass graft patients? Anesth Analg 93:1466–1471 7. Murray WB, Foster PA (1996) The
peripheral pulse wave: information overlooked. J Clin Monit 12:365–377 8. Shelley KH, Murray WB, Chang D
(1997) Arterial-pulse oximetry loops: a new method of monitoring vascular tone. J Clin Monit 13:223–228
9. Cannesson M, Besnard C, Durand PG, Bohe J, Jacques D (2005) Relation between respiratory variations in pulse oximetry plethysmographic waveform amplitude and arterial pulse pressure in ventilated patients. Crit Care 9:R562–568
10. Alexander CM, Teller LE, Gross JB (1989) Principles of pulse oximetry: theoretical and practical considerations. Anesth Analg 68:368–376
11. Awad AA, Stout RG, Ghobashy MA, Rezkanna HA, Silverman DG, Shelley KH (2006) Analysis of the ear pulse oximeter waveform. J Clin Monit Comput 20:175–184 12. Monnet X, Lamia B, Teboul JL (2005)
Pulse oximeter as a sensor of fluid re-sponsiveness: do we have our finger on the best solution? Crit Care 9:429–430 13. Shamir M, Eidelman LA, Floman Y,
Kaplan L, Pizov R (1999) Pulse oximetry plethysmographic waveform during changes in blood volume. Br J Anaesth 82:178–181
14. Cannesson M, Desebbe O, Hachemi M, Jacques D, Bastien O, Lehot JJ (2007) Respiratory variations in pulse oximeter waveform amplitude are influenced by venous return in mechanically venti-lated patients under general anaesthesia. Eur J Anaesthesiol 24:245–251
15. Natalini G, Rosano A, Taranto M, Faggian B, Vittorielli E, Bernardini A (2006) Arterial versus plethysmo-graphic dynamic indices to test respon-siveness for testing fluid administration in hypotensive patients: a clinical trial. Anesth Analg 103:1478–1484
16. De Backer D, Heenen S, Piagnerelli M, Koch M, Vincent JL (2005) Pulse pressure variations to predict fluid re-sponsiveness: influence of tidal volume. Intensive Care Med 31:517–523 17. Levy MM, Fink MP, Marshall JC,
Abra-ham E, Angus D, Cook D, Cohen J, Opal SM, Vincent JL, Ramsay G (2003) 2001 SCCM/ESICM/ACCP/ATS/SIS International Sepsis Definitions Confer-ence. Intensive Care Med 29:530–538 18. Ramsay MA, Savege TM, Simpson BR,
Goodwin R (1974) Controlled seda-tion with alphaxalone–alphadolone. Br Med J 2:656–659
19. Preisman S, Kogan S, Berkenstadt H, Perel A (2005) Predicting fluid responsiveness in patients under-going cardiac surgery: functional haemodynamic parameters including the Respiratory Systolic Variation Test and static preload indicators. Br J Anaesth 95:746–755
20. Stetz CW, Miller RG, Kelly GE, Raffin TA (1982) Reliability of the ther-modilution method in the determination of cardiac output in clinical practice. Am Rev Respir Dis 126:1001–1004 21. Hanley JA, McNeil BJ (1983)
A method of comparing the areas under receiver operating characteristic curves derived from the same cases. Radiology 148:839–843
22. Feissel M, Badie J, Merlani PG, Faller JP, Bendjelid K (2005) Pre-ejection period variations predict the fluid responsiveness of septic ventilated patients. Crit Care Med 33:2534–2539 23. Vieillard-Baron A, Chergui K,
Ra-biller A, Peyrouset O, Page B, Beauchet A, Jardin F (2004) Superior vena caval collapsibil-ity as a gauge of volume sta-tus in ventilated septic patients. Intensive Care Med 30:1734–1739 24. Duperret S, Lhuillier F, Piriou V, Vivier E, Metton O, Branche P, An-nat G, Bendjelid K, Viale JP (2007) Increased intra-abdominal pressure affects respiratory variations in arte-rial pressure in normovolaemic and hypovolaemic mechanically ventilated healthy pigs. Intensive Care Med 33:163–171