Tiziano Schepis Pascal Koepfli Sebastian Leschka Lotus Desbiolles Lars Husmann Oliver Gaemperli Franz R. Eberli Simon Wildermuth Borut Marincek Thomas F. Lüscher Hatem Alkadhi Philipp A. Kaufmann Received: 11 August 2006 Revised: 6 October 2006 Accepted: 12 October 2006 Published online: 6 January 2007 # Springer-Verlag 2007
Coronary artery stent geometry and in-stent
contrast attenuation with 64-slice computed
tomography
Abstract We aimed at assessing stent geometry and in-stent contrast atten-uation with 64-slice CT in patients with various coronary stents. Twenty-nine patients (mean age 60±11 years; 24 men) with 50 stents underwent CT within 2 weeks after stent placement. Mean in-stent luminal diameter and reference vessel diameter proximal and distal to the stent were assessed with CT, and compared to quantitative coronary angiography (QCA). Stent length was also compared to the manufacturer’s values. Images were reconstructed using a medium-smooth (B30f) and sharp (B46f) kernel. All 50
stents could be visualized with CT. Mean in-stent luminal diameter was systematically underestimated with CT compared to QCA (1.60±0.39 mm versus 2.49±0.45 mm; P<0.0001), resulting in a modest correlation of QCA versus CT (r=0.49; P<0.0001). Stent length as given by the manu-facturer was 18.2±6.2 mm, correlating well with CT (18.5±5.7 mm; r=0.95; P<0.0001) and QCA (17.4±5.6 mm; r=0.87; P<0.0001). Proximal and distal reference vessel diameters were similar with CT and QCA (P=0.06 and P=0.03). B46f kernel images showed higher image noise (P<0.05) and lower in-stent CT attenuation values (P<0.001) than images recon-structed with the B30f kernel. 64-slice CT allows measurement of coronary artery in-stent density, and signifi-cantly underestimates the true in-stent diameter compared to QCA.
Keywords Stents . 64-slice CT . Coronary angiography
Introduction
Multi-detector row computed tomography (CT) is increas-ingly becoming an important modality for the non-invasive imaging of patients with suspected coronary artery disease (CAD). Recent studies with 16- and 64-detector row CT showed a high sensitivity and specificity for the detection of coronary artery stenoses [1–7]. On the other hand, assessment of coronary artery stents with multi-detector
row CT still remains a major problem, due to partial volume artifacts from the highly attenuated stent struts, which lead to artificial narrowing of the lumen and thus hamper reliable visualization of the stent lumen [8–14]. Stents are now used in approximately 80–90% of all percutaneous coronary interventions [15]. Although the introduction of drug-eluting stents has significantly re-duced the incidence of in-stent restenosis [16], an efficient noninvasive diagnostic tool for the follow-up after stent
Philipp A. Kaufmann was supported by a grant from the Swiss National Science Foundation (SNSF-professorship grant No. PP00A-68835).
Hatem Alkadhi and Lotus Desbiolles were supported by the National Center of Competence in Research, Computer Aided and Image Guided Medical Interventions (NCCR CO-ME) of the Swiss National Science Foundation.
T. Schepis . P. Koepfli . O. Gaemperli . F. R. Eberli . T. F. Lüscher .
P. A. Kaufmann (*) Cardiovascular Center, University Hospital Zurich, Raemistr. 100, CH-8091 Zurich, Switzerland e-mail: [email protected] Tel.: +41-1-2553555 Fax: +41-1-2554414 S. Leschka . L. Desbiolles . L. Husmann . S. Wildermuth . B. Marincek . H. Alkadhi Institute of Diagnostic Radiology, University Hospital Zurich, Zurich, Switzerland P. A. Kaufmann
Zurich Center for Integrative Human Physiology, Zurich, Switzerland
implantation is of great clinical interest. While accuracy of stent lumen analysis was modest with 4-, 16- and 40-detector row CT scanners, the recently developed 64-slice CT scanner may allow more accurate stent characterization, due to an increased spatial and temporal resolution [17]. First in vitro and ex vivo experience with coronary artery stents using 64-slice CT has shown a superior visualization of the stent lumen and in-stent stenosis compared with 16-detector row CT [18, 19]. The aim of our study was to prospectively assess quantitative parameters, such as stent geometry and in-stent contrast attenuation, with 64-slice CT in patients with various coronary artery stents.
Materials and methods Patients
The study protocol was approved by the local ethics committee, and written informed consent was obtained from all patients. Between February 2005 and June 2005, we prospectively enrolled 29 patients (5 women, 24 men; mean age 60±11 years, range 39–81 years) who had undergone PCI with stent implantation. All patients and stents were examined by conventional coronary angiogra-phy with quantitative coronary angiograangiogra-phy (QCA) within 8±14 days prior to conducting the CT scans with unchanged medication. Stent diameters and stent length measured during this invasive angiography were used for comparison with CT. Only patients in sinus rhythm able to perform breath hold commands were included. Exclusion criteria were renal insufficiency (serum creatinine level >115 μmol/L) or known allergy to iodinated contrast agents.
Multi-detector row CT protocol
All CT examinations were performed on a 64-slice CT scanner (Somatom Sensation 64, Siemens Medical Solu-tions, Forchheim, Germany) with a detector collimation of 32×0.6 mm, a slice collimation of 64×0.6 mm, and a table feed of 9.2 mm per rotation. Gantry rotation time was 330 ms, tube voltage was 120 kV, and effective tube current-time product 650–780 mAs. All subjects received 0.4 mg nitroglycerin sublingually 2 minutes before data acquisition. A bolus of 80 ml non-ionic, iodinated contrast agent (Visipaque 320 mg/ml, Amersham Health, Buck-inghamshire, United Kingdom) was continuously injected into an antecubital vein via a 18–20-gauge catheter at a flow rate of 5.0 ml/s, followed by a 30 ml saline flush. An automated bolus tracking system was used to synchronize the arrival of the contrast material with initiation of the scan. A region of interest (ROI) was placed into the aortic root, and image acquisition started 5 s after the signal density reached the predefined threshold of 140 Hounsfield
units (HU). After this, scanning was performed covering the distance from the tracheal bifurcation to the diaphragm. For optimal heart phase selection, retrospective electrocar-diography (ECG) gating was used. Axial images synchro-nized to the ECG were reconstructed by a single sector (<65 bpm) or two-sector (>65 bpm) algorithm, using data from one or two consecutive heart beats. The estimated effective radiation dose (using ECG-controlled dose mod-ulation) for this protocol is in the range of 6.9–11.1 mSv [20]. Two sets of CT images were reconstructed, one with a medium-smooth kernel (B30f; 50% value of the modula-tion transfer, approximately 4.0 cm−1), the other with a sharp kernel (B46f; 50% value of the modulation transfer, approximately 5.0 cm−1). Images were reconstructed every 5% interval from 0 to 95% of the R-R interval, with an effective slice thickness of 0.75 mm at 0.5 mm increments. The images in that phase showing least motion artifacts were used for further analysis. As previously reported [21], the optimal reconstruction phase was found at 60% and 65% of the R-R interval, with the individual %-interval presenting the beginning of the reconstruction. All data were transferred to a remote workstation (Leonardo with Syngo InSpace4D application, Siemens, Forchheim, Germany) for further post-processing.
Stent visualization and image quality
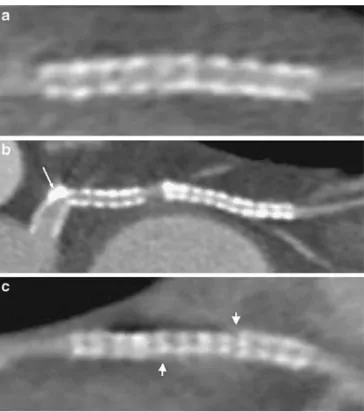
Transverse CT images and the corresponding curved multi-planar reformations (MPR) along the course of the stents were analyzed by two independent radiologists, each with 5 years of experience in cardiovascular radiology, who were both blinded to the clinical history, to the indication for referral, and to the results from invasive coronary angiography. The data sets reconstructed with the sharp kernel (B46f) were used for image quality and stent patency analysis, because they are known to provide a better delineation of the stent as compared to images reconstructed with the medium-smooth (B30f) kernel [11, 18]. The two readers were allowed to individually adjust the window settings in each patient. The stent was considered assessable when the stent lumen was visible and the contrast in the lumen could be visually evaluated. Image quality of each stent was qualitatively graded on a 4-point scale as follows: 1 = no artifacts in the surrounding of the stent, 2 = minor artifacts, 3 = moderate artifacts partially obscuring the stent surrounding, and 4 = severe artifacts totally obscuring the stent lumen and vicinity leading to completely non-evaluable stents. Thus, scores 2 and 3 indicated partially non-evaluable stents. When artifacts were found (i.e., scores 2–4), the reasons for impaired image quality were assigned as partial volume artifacts, motion artifacts or calcifications. Examples for each artifact type are provided on Fig. 1. Finally, stent patency was visually graded according to the proportion of the stent lumen that showed no contrast enhancement:
grade 1 = homogenous enhancement with no lumen narrowing indicating a patent stent, grade 2 = eccentric or concentric non-enhanced area between the stent and the contrast-enhanced lumen with a lumen decrease ≤50%— indicating a non-significant in-stent restenosis, grade 3 = non-enhanced area within the stent leading to a reduction of the contrast-enhanced lumen >50%—indicating a signifi-cant in-stent restenosis, and grade 4 = no contrast en-hancement within the stent indicating stent occlusion.
Attenuation measurements
Attenuation measurements were performed on transverse and curved MPR images reconstructed with both medium-smooth (B30f) and sharp (B46f) kernels by the same two radiologists in consensus. For all measurements, the images were zoomed to ensure exact placement of the ROIs. Image noise was measured by calculating the standard deviation of the mean CT attenuation in a ROI set in the ascending aorta. CT attenuation was measured within the stent lumen and in the coronary artery lumen 5 mm proximal and distal to the stent. Areas with decreased attenuation, indicating steno-sis, were avoided when setting the ROI. At each site,
measurements were made on transverse images of three adjacent sections, and the results were averaged. If the axis of the stent was neither perpendicular nor parallel to the imaging plane, the measurements were performed on the curved MPR images along the course of the stent.
Stent geometry
Stent geometry was analyzed on curved MPR images reconstructed with the sharp kernel (B46f), as the B46f kernel has been shown to be superior for quantitative assessment of stent geometry with both 16- and 64-detector row CT [11, 18, 22]. For all measurements, the images were zoomed to ensure exact placement of the calipers. To standardize the analysis, images were displayed with a fixed window level at 200 HU and a window width at 1500 HU, as this window setting has been reported to provide good visualization of coronary artery stents with respect to in-stent luminal dimensions and stent strut contrast enhancement, while changes in these parameters may interfere with the results of geometry measurements [9,11]. The in-stent luminal diameter was measured three to six times (depending on the length of the stent) by using electronic calipers, and all measurements were averaged for each stent. Similarly, stent length and diameters of the reference vessel 5 mm proximal and 5 mm distal to the stent were measured twice, and values were averaged. An example illustrating stent geometry measurements is provided in Fig.2.
Fig. 1 Three examples of artifact types deteriorating image quality of coronary artery stents with 64-slice CT using curved multiplanar reconstruction along the stent-axis. a Partial volume artifact from the highly attenuated metal stent strut (image quality score 3), b minor artifact due to coronary vessel wall calcification (arrow) in the proximal stent (image quality score 2), and c moderate motion artifact (arrowheads) in a patient with a heart rate of 76 bpm (image quality score 3)
Fig. 2 Curved multiplanar reconstruction of 64-slice CT coronary angiography images illustrating stent geometry measurements. In-stent luminal diameter was measured 3 to 6 times (depending on the length of the stent) by using electronic calipers and all measure-ments were averaged for each stent. Stent length was also measured several times and the values were averaged
Quantitative coronary angiography
Angiograms of the target vessels were obtained in at least two orthogonal projections after administering intracor-onary nitrates. One cardiologist with 2 years of experience with invasive coronary angiography, who was blinded to the CT results, examined each catheter angiogram. First, the sites of stent implantation were identified before contrast injection. Thereafter, the contrast-filled angiogra-phy catheter was used as reference for calibration by using a computerized QCA analysis software (Xcelera, Philips Medical Systems, the Netherlands). Normal reference segments were identified 5 mm proximal and 5 mm distal to the stent. Mean in-stent luminal diameters, stent lengths, and reference vessel diameters were obtained on diastolic-phase images in each patient. The results from two orthogonal views (average) were recorded. Narrowing of ≥50% of in-stent luminal diameter in relation to a reference segment was defined as significant in-stent restenosis.
Statistical analysis
Quantitative variables were expressed as mean±standard deviation. Inter-observer agreements for image quality and stent patency read-out were expressed as Cohenκ statistics and were interpreted as follows [23]: Aκ value of 0.20 or less indicated poor agreement; aκ value of 0.21–0.40, fair agreement; aκ value of 0.41–0.60, moderate agreement; a κ value of 0.61–0.80, good agreement; and a κ value of 0.81–1.00, excellent agreement. Image noise in CT images reconstructed with B30f and B46f kernels, CT attenuation between the different measured sites, and CT attenuation between the B30f and B46f kernel CT images was compared. Pearson correlation coefficients were calculated to compare the CT attenuation in the stent lumen and in the coronary artery segments proximal and distal to the stent. Pearson correlation analysis and Bland and Altman analysis [24] were performed to compare quantitative stent geometry, and reference vessel diameter measurements between CT, QCA, and the manufacturer values. Comparisons were performed using the two-sided paired Student t-test and analysis of variance (ANOVA) using the Scheffe’s F-test. A P value less than 0.05 indicated a statistically significant difference. All statis-tical analyses except calculation of Cohen’s kappa value were performed using a commercially available software package (StatView for Windows, Version 5.0.1, SAS Institute, Cary, NC, USA). Cohen’s kappa was calculated using the Statistical Package for the Social Sciences (SPSS 12.0 for Windows, SPPS Incorporation, Chicago, IL, USA).
Results
Study population
Twenty-nine consecutive patients with 50 stents (1 to 5 stents per patient, mean 1.9±1.3 stents) were analyzed with 64-slice CT and QCA. Seventeen patients were studied after acute myocardial infarction. One patient had under-gone prior coronary artery bypass surgery. Nineteen patients were on continuous β-blocker medication. In six patients, intravenous metroprolol (5 to 20 mg) was administered prior to the CT examination to achieve a target heart rate <75 beats per minute (bpm). The average heart rate during scan was 67±12 bpm (range 40–91 bpm). The clinical characteristics of the study group are summarized in Table1.
Stent characteristics and location
Forty-two drug eluting and eight bare metal stents were analyzed in the left anterior descending (LAD; n=23), in the left circumflex (LCX; n=8), in the right coronary (RCA; n=13) artery, and in side branches (n=6). Five different types of stents were included, i.e. Cypher Select (Cordis, Miami, FL, USA; n=28), Taxus (Boston Scientific, Boston, MA, USA; n=14), Lekton Motion (Biotronik, Switzerland; n=5), AVE (Medtronic, Natick, MA, USA; n=2), and Driver (Medtronic, Natick, MA, USA; n=1). Labeled stent
di-Table 1 Patient characteristics
Clinical characteristics Values
No. of patients 29
Age (years) 60±11
Male gender 24
Body mass index (kg/m2) 27±5
Reasons for coronary angiography
ST-segment elevation myocardial infarction 8 Non-ST-segment elevation myocardial infarction 9
Chest pain 12
Coronary artery disease
Single-vessel 12
Two-vessel 9
Three-vessel 8
Previous stent angioplasty≥6 months 10 Previous coronary artery bypass grafting 1 Cardiovascular risk factors
Smoking history 13
Hypertension 20
Diabetes 5
ameters were distributed as follows: 2.25 mm (n=5), 2.5 mm (n=7), 2.75 mm (n=13), 3.0 mm (n=17), and 3.5 mm (n=8). Strut thickness ranged from 0.008 to 0.14 mm. One stent (Driver) was made of a cobalt alloy, the remaining stents were made of stainless steel.
Stent visualization and image quality
All 50 stents could be visualized with 64-slice CT. Overall image quality was good, with a mean score of 1.8± 0.7 (inter-observer agreement κ=0.73). The score tended to be higher (2.2± 0.7) for stents with a diameter <3.0 mm versus those with a diameter ≥3.0 mm (1.7± 0.6; P<0.05). Using the best reconstruction interval, artifact-free images (score 1) were found in 36% of the coronary stents (n=18), minor artifacts (score 2) were found in 50% (n=25), and moderate artifacts (score 3) were present in 14% (n=7). None of the coronary artery stents was rated as being completely non-evaluable
(score 4). Reasons for impaired image quality were partial volume artifacts in 66% (n=21), motion artifacts in 25% (n=8), and calcifications in 9% (n=3). Sixty percent of the patients with motion artifacts had heart rates >70 bpm (mean 74± 12 bpm). Lumen interpret-ability did not differ significantly from one stent location to another, or from one type of stent to another.
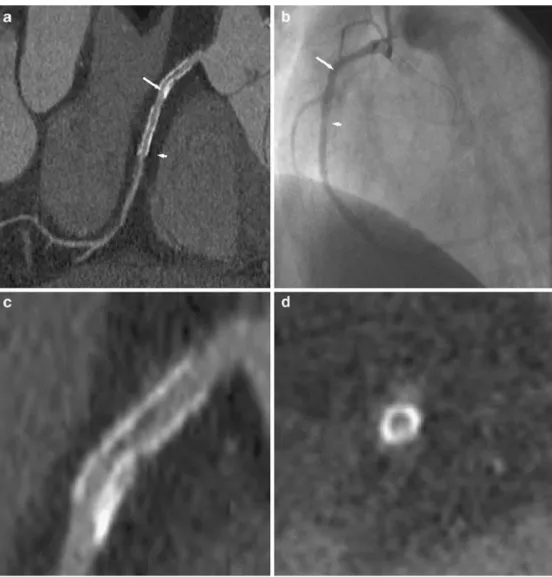
The inter-observer agreement for stent patency grading was good (κ=0.82). Both readers correctly identified one stent in the LAD (Cypher Select) with significant in-stent restenosis (≥50% diameter stenosis, grade 3) and two serial stents in the RCA (2×AVE) in one patient with non-significant in-stent restenosis (grade 2) (Fig.3). These three stents had been implanted at a previous intervention 17 and 7 months before. In two patients, the stents were incorrectly rated by one reader as having a non-significant in-stent restenosis (grade 2) and by the other reader as being patent (grade 1), and vice versa. All other stents were correctly classified by both readers as being patent (grade 1).
Fig. 3 Two AVE stents in the right coronary artery demon-strated with 64-slice CT using (a) curved multiplanar recon-struction along the vessel, and (b) by conventional coronary angiography. Proximal stent shows a non-significant in-stent restenosis (arrows) with a cres-cent-shaped lack of contrast en-hancement (magnified parallel and perpendicular image, c and d). Distal stent (a and b) shows also non-significant in-stent restenosis (arrowheads), corresponding to neointimal hyperplasia
Attenuation measurements
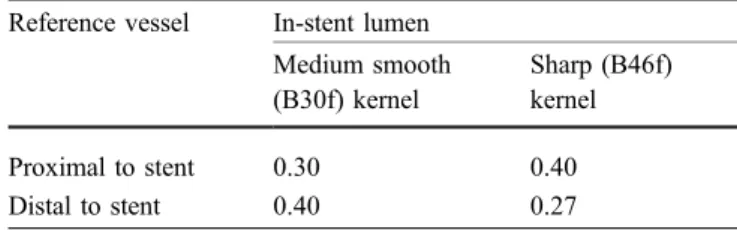
The mean image noise measured on the B30f kernel images (22.1±6.3 HU) was significantly lower than that on the B46f kernel images (35.1±11.0 HU; P<0.05). Table2lists the mean CT attenuation values measured within the stent lumen and in the reference vessel lumen proximal and distal to the stent. In-stent luminal CT attenuation measured on the B46f kernel images was significantly lower compared to in-stent luminal CT attenuation measured on the B30f kernel images (P<0.001). No significant differ-ences in CT attenuation between the B46f kernel and B30f kernel images was found in the reference lumen proximal and distal to the stent. In-stent luminal attenuation was higher than the attenuation in the proximal and distal reference vessel (P<0.001). The in-stent luminal CT attenuation measured on the B46f kernel images was closer to the densities measured in the proximal or distal reference vessels images (F-test; all P=ns) when compared to in-stent luminal CT attenuation on the B30f kernel images (F-test: 69.8; P<0.0001). The in-stent CT attenu-ation measured on both B30f kernel and B46f kernel images showed a weak but significant correlation with the attenuation in the reference vessels proximal and distal to the stent (Table3).
Stent geometry
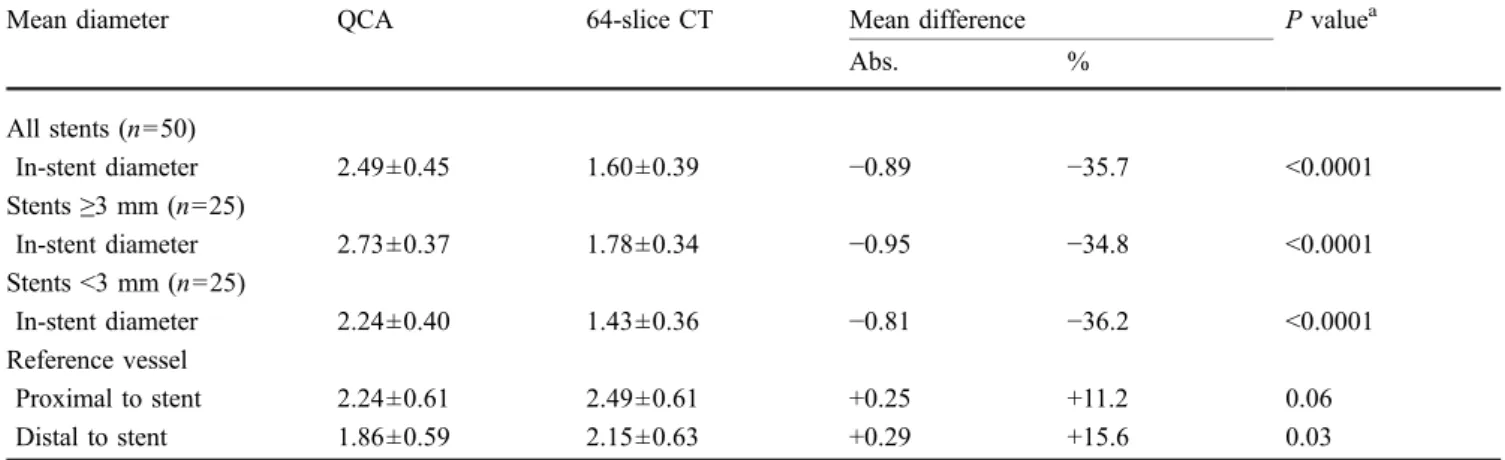
True average stent length as given by the manufacturer (18.2±6.2 mm) showed an excellent correlation with 64-slice CT (18.5±5.7 mm; r=0.95; P<0.0001) but somewhat less with QCA (17.4±5.6 mm; r=0.87; P<0.0001). By contrast, mean in-stent luminal diameter was system-atically underestimated with 64-slice CT compared to QCA (1.60±0.39 mm versus 2.49±0.45 mm; mean difference −0.89 mm; P<0.0001) and limits of agreement were wide (−0.03 to −1.71 mm), indicating only a modest correlation and agreement of QCA versus 64-slice CT (r=0.49;
P<0.0001) (Fig. 4c). Mean in-stent luminal diameter values as given by the manufacturer (2.88±0.38 mm) correlated slightly better with QCA (r=0.66; P<0.0001) than to 64-slice CT (r=0.53; P<0.0001), with somewhat narrower limits of agreement (Fig.4a,b). Accordingly, the extent of underestimation of in-stent diameters was significantly lower between the manufacturer and QCA (mean difference, 0.38 mm) versus between the manufac-turer and 64-slice CT (mean difference, 1.27 mm; P<0.0001), whereas the F-test disclosed no significant difference for the limits of agreement between these two comparisons (F-test: 3.82; P=0.057). Quantification of vessel diameters by 64-slice CT in the reference vessel 5 mm proximal and 5 mm distal to the stent was comparable to QCA (Table 4). Quantification of stent diameter by 64-slice CT was not affected by stent size (Table4) nor by stent type (Table5).
Discussion
This study reports the in vivo visualization and quantitative assessment of various coronary artery stents compared to QCA. From a total of 50 examined stents, all reached sufficient image quality to allow assessment of stent lumen. Even the smallest stents could be correctly analyzed with 64-slice CT, as opposed to previous studies with 16-slice CT [25], indicating a possible improvement of the 64-slice CT technique compared to previous scanner generations. However, quantitative analysis by 64-slice CT substantially underestimates in-stent luminal diameters (by at least 35%) as compared to the gold standard QCA.
A reliable noninvasive diagnostic procedure for follow-up of patients with previous stent angioplasty would be desirable in symptomatic patients with suspected in-stent restenosis, as the absolute number of stent implantations increases while the restenosis rate has remained important, i.e. between 6% and 12% [16]. Although multi-detector row CT plays an increasing role as an alternative to conventional coronary angiography, reliable visualization of coronary artery stents with CT has been difficult so far, due to partial volume artifacts from the highly attenuated
Table 2 Comparison of contrast-enhanced CT attenuation measure-ments on images reconstructed with medium-smooth and sharp kernels
Location of measurement
Measured attenuation values (HU) Medium smooth (B30f) kernel Sharp (B46f) kernel P valuea Stent In-stent lumen 483.7±143.2 388.0±96.8 <0.001 Reference vessel Proximal to stent 325.3±52.6 322.1±55.0 0.69 Distal to stent 291.7±73.9 296.9±63.5 0.44 Data are attenuation values as mean±SD. All absolute values given
in Hounsfield units (HU).
a
Calculated with two-sided paired Student t-test.
Table 3 Correlation of contrast-enhanced CT attenuation measure-ments in the stent lumen and reference vessel with medium-smooth and sharp kernels
Reference vessel In-stent lumen Medium smooth (B30f) kernel Sharp (B46f) kernel Proximal to stent 0.30 0.40 Distal to stent 0.40 0.27
Data are Pearson correlation coefficients (r) for bivariate analysis (P<0.001 for all comparisons).
stent struts. In our study, none of the 50 stents was incorrectly identified with CT as having a significant stenosis. However, as only one high grade in-stent
restenosis und two stents with non-significant in-stent restenosis were found, no meaningful number on sensitiv-ity can be provided.
Fig. 4 Linear regression analysis for mean in-stent luminal diameter in millimeters (mm) in all stents (n=50) between (a) manufacturer and quantitative coronary angiography (QCA) (Pearson correlation; r=0.66, P<0.0001),(b) manufacturer and 64-slice CT (Pearson correlation; r=0.53, P<0.0001), and (c) between QCA and 64-slice
CT (Pearson correlation; r=0.49, P<0.0001). Bland–Altman plots for mean in-stent luminal diameter between (d) manufacturer and QCA, (e) manufacturer and 64-slice CT, and (f) between QCA and 64-slice CT
Table 4 Comparison of in-stent luminal diameters and reference vessel diameters between quantitative coronary angiography (QCA) and 64-slice CT
Mean diameter QCA 64-slice CT Mean difference P valuea
Abs. % All stents (n=50) In-stent diameter 2.49±0.45 1.60±0.39 −0.89 −35.7 <0.0001 Stents≥3 mm (n=25) In-stent diameter 2.73±0.37 1.78±0.34 −0.95 −34.8 <0.0001 Stents <3 mm (n=25) In-stent diameter 2.24±0.40 1.43±0.36 −0.81 −36.2 <0.0001 Reference vessel Proximal to stent 2.24±0.61 2.49±0.61 +0.25 +11.2 0.06 Distal to stent 1.86±0.59 2.15±0.63 +0.29 +15.6 0.03
In vitro analyses with CT of various stent types with different diameters have shown that artifacts depend on strut thickness, which leads to artificial narrowing and thus reduced interpretability of the intra-stent lumen. Further-more, artifacts vary substantially according to the metal employed, the problem being most severe with tantalum or gold-coated stents [22, 26, 27]. In a study published by Krueger et al. [8] a total of 32 stents were assessed in vivo by 4-detector row CT. The lumen of the stents could not be interpreted in any of these stents due to severe artifacts. This finding was independent of the size and type of examined stents. Gilard et al. [28] analyzed 232 stents in vivo by 16-detector row CT. Intra-stent lumen was interpretable only in about one half of the patients. A stent diameter of 3 mm or more was associated with better lumen visibility and better ability to detect intra-stent restenosis. In a recent study using 40-detector row CT, Gaspar et al. [29] assessed 111 stents in 65 patients referred for repeat invasive angiography after clinical suspicion of in-stent restenosis. Although in-stent restenosis could be diagnosed with moderate sensitivity (88.9%) and specific-ity (80.6%), the high negative predictive value (97.4%) implies a significant role for multi-detector row CT in excluding in-stent restenosis.
The 64-slice CT scanners provide a high temporal and spatial resolution, potentially reducing partial volume artifacts in stent imaging [17]. Therefore, the introduction of 64-slice CT might improve the yield in this application. Our results confirm the progress achieved by the latest technique, as in the present study each stent lumen was at least partially assessable. Mean in-stent luminal diameters assessed by 64-slice CT were smaller than those measured on conventional angiograms. These findings are in accordance with a previous study by Hong et al. [11] where a roughly 20% size underestimation of the mean in-stent luminal diameters was also reported. This indicates
that the present spatial resolution of 64-slice CT may still be not sufficient to avoid partial volume averaging artifacts. This holds true, although the role of QCA as gold standard is challenged by the fact that true stent length as given by the manufacturer showed a better agreement with 64-slice CT than with QCA. The underestimation of in-stent luminal diameters reflecting the problem of partial volume averaging close to the stent strut may be also the reason for the two incorrect ratings of non-significant in-stent restenoses in two patients with patent stents.
Similar to the 16-detector row CT study by Hong et al. [11], we have demonstrated the capability of 64-slice CT to assess stent patency by means of intraluminal contrast enhancement measurements. Because of partial volume averaging artifacts from the stent struts, the CT attenuation values were significantly higher than those measured in the reference coronary vessel proximal and distal to the stent. The in-stent luminal CT attenuation measured on images reconstructed with the sharp kernel was closer to that measured in the proximal or distal lumen than was the in-stent luminal CT attenuation measured on the medium-smooth kernel reconstructed images. This can be explained by a reduction in partial volume averaging artifacts with the sharp convolution kernel reconstructions [11].
Our study has several limitations. As the study was primarily designed to assess stent geometry, 64-slice CT was performed within a few days after the actual stent implantation. Only 15 stents had been implanted at a previous intervention, and therefore just a small number of stents with restenosis was found. As a consequence, no meaningful data on sensitivity and specificity for the detection of in-stent restenosis by 64-slice CT can be provided. Another important limitation is that the true gold standard for assessment of stent geometry would have been intravascular ultrasound (IVUS) which has been shown to characterize stent geometry more accurately than invasive
Table 5 Comparison of in-stent luminal diameters between quantitative coronary angiography (QCA) and 64-slice CT according to stent type
Mean stent diameter QCA 64-slice CT Mean difference P valuea
Abs. % Cypher (n=28) In-stent diameter 2.40±0.45 1.61±0.23 −0.79 −32.9 <0.0001 Taxus (n=14) In-stent diameter 2.55±0.40 1.60±0.49 −0.95 −37.3 <0.0001 Lekton Motion (n=5) In-stent diameter 3.00±0.19 1.50±0.23 −1.50 −50.0 <0.005 AVE (n=2) In-stent diameter 2.10±0.39 1.21±0.30 −0.89 −42.4 NAb Driver (n=1) In-stent diameter 3.36 1.83 −1.53 −45.5 NAb
angiography [30]. In our study, mean in-stent luminal diameter values as given by the manufacturer were also slightly underestimated by QCA. A possible reason for this might be related to incomplete stent expansion. Nakamura et al. [31] demonstrated that, despite excellent angio-graphic appearance, the majority of stents deployed at low pressure remain suboptimally expanded by IVUS criteria. Potential explanations for this persistent stent undersizing measured by QCA include balloon underexpansion (despite high inflation pressures), acute stent recoil, or a combination of the two mechanisms. Finally, effective radiation doses were not individually calculated in each patient, but derived from estimates from commercially available software.
In conclusion, 64-slice CT allows measurement of coronary artery stent density, and significantly under-estimates the true in-stent diameter compared to QCA.
Acknowledgements Philipp A Kaufmann was supported by a grant from the Swiss National Science Foundation (SNSF-professorship grant No. PP00A-68835).
Hatem Alkadhi and Lotus Desbiolles were supported by the National Center of Competence in Research, Computer Aided and Image Guided Medical Interventions (NCCR CO-ME) of the Swiss National Science Foundation.
Conflict of interest statement No conflict of interest to disclose.
References
1. Nieman K, Cademartiri F, Lemos PA et al (2002) Reliable noninvasive coro-nary angiography with fast submilli-meter multislice spiral computed tomography. Circulation 106:2051– 2054
2. Ropers D, Baum U, Pohle K et al (2003) Detection of coronary artery stenoses with thin-slice multi-detector row spiral computed tomography and multiplanar reconstruction. Circulation 107:664–666
3. Mollet NR, Cademartiri F, Nieman et al (2004) Multislice spiral computed tomography coronary angiography in patients with stable angina pectoris. J Am Coll Cardiol 43:2265–2270 4. Leber AW, Knez A, von Ziegler F et al
(2005) Quantification of obstructive and nonobstructive coronary lesions by 64-slice computed tomography: a comparative study with quantitative coronary angiography and intravascular ultrasound. J Am Coll Cardiol 46:147– 154
5. Leschka S, Alkadhi H, Plass A et al (2005) Accuracy of MSCT coronary angiography with 64-slice technology: first experience. Eur Heart J 26:1482– 1487
6. Raff GL, Gallagher MJ, O’Neill WW et al (2005) Diagnostic accuracy of noninvasive coronary angiography using 64-slice spiral computed tomog-raphy. J Am Coll Cardiol 46:552–557
7. Achenbach S, Ropers D, Pohle FK et al (2005) Detection of coronary artery stenoses using multi-detector CT with 16×0.75 collimation and 375 ms rota-tion. Eur Heart J 26:1978–1986 8. Kruger S, Mahnken AH, Sinha AM
et al (2003) Multislice spiral computed tomography for the detection of coro-nary stent restenosis and patency. Int J Cardiol 89:167–172
9. Maintz D, Juergens KU, Wichter T et al (2003) Imaging of coronary artery stents using multislice computed tomography: in vitro evaluation. Eur Radiol 13:830–835
10. Schuijf JD, Bax JJ, Jukema JW et al (2004) Feasibility of assessment of coronary stent patency using 16-slice computed tomography. Am J Cardiol 94:427–430
11. Hong C, Chrysant GS, Woodard PK et al (2004) Coronary artery stent patency assessed with in-stent contrast enhancement measured at multi-detec-tor row CT angiography: initial expe-rience. Radiology 233:286–291 12. Cademartiri F, Mollet N, Lemos PA
et al (2005) Usefulness of multislice computed tomographic coronary angi-ography to assess in-stent restenosis. Am J Cardiol 96:799–802
13. Seifarth H, Raupach R, Schaller S et al (2005) Assessment of coronary artery stents using 16-slice MDCT angiogra-phy: evaluation of a dedicated recon-struction kernel and a noise reduction filter. Eur Radiol 15:721–726
14. Kefer JM, Coche E, Vanoverschelde JL et al (2006) Diagnostic accuracy of 16-slice multidetector-row CT for detec-tion of in-stent restenosis vs detecdetec-tion of stenosis in nonstented coronary arteries. Eur Radiol May 30 [Epub ahead of print]
15. Anderson HV, Shaw RE, Brindis RG et al (2002) A contemporary overview of percutaneous coronary interventions. The American College of Cardiology-National Cardiovascular Data Registry (ACC-NCDR). J Am Coll Cardiol 39:1096–1103
16. Windecker S, Remondino A, Eberli FR et al (2005) Sirolimus-eluting and paclitaxel-eluting stents for coronary revascularization. N Engl J Med 353:653–662
17. Flohr TG, Stierstorfer K, Ulzheimer S et al (2005) Image reconstruction and image quality evaluation for a 64-slice CT scanner with z-flying focal spot. Med Phys 32:2536–2547
18. Seifarth H, Ozgun M, Raupach R et al (2006) 64-Versus 16-slice CT angiog-raphy for coronary artery stent assess-ment: in vitro experience. Invest Radiol 41:22–27
19. Rist C, Nikolaou K, Flohr T et al (2006) High-resolution ex vivo imaging of coronary artery stents using 64-slice computed tomography-initial experi-ence. Eur Radiol 16:1564–1569 20. Application Guide, Somatom Sensation
Cardiac 64. Siemens AG Medical Solutions, Forchheim, Germany (2004) 21. Leschka S, Alkadhi H, Plass et al
(2006) Optimal image reconstruction intervals for non-invasive coronary an-giography with 64-slice CT. Eur Radiol 16:1964–1972
22. Mahnken AH, Buecker A, Wildberger JE et al (2004) Coronary artery stents in multislice computed tomography: in vitro artifact evaluation. Invest Radiol 39:27–33
23. Landis JR, Koch GG (1977) An application of hierarchical kappa-type statistics in the assessment of majority agreement among multiple observers. Biometrics 33:363–374
24. Bland JM, Altman DG (1986) Statistical methods for assessing agreement between two methods of clinical measurement. Lancet 1:307– 310
25. Kitagawa T, Fujii T, Tomohiro Y et al (2006) Noninvasive assessment of cor-onary stents in patients by 16-slice computed tomography. Int J Cardiol 109:188–194
26. Maintz D, Grude M, Fallenberg EM et al (2003) Assessment of coronary arterial stents by multislice-CT angiog-raphy. Acta Radiol 44:597–603 27. Maintz D, Seifarth H, Raupach R et al
(2006) 64-slice multidetector coronary CT angiography: in vitro evaluation of 68 different stents. Eur Radiol 16:818– 826
28. Gilard M, Cornily JC, Pennec PY et al (2006) Assessment of coronary artery stents by 16-slice computed tomogra-phy. Heart 92:58–61
29. Gaspar T, Halon DA, Lewis BS et al (2005) Diagnosis of coronary in-stent restenosis with multidetector row spiral computed tomography. J Am Coll Cardiol 46:1573–1579
30. Fitzgerald PJ, Oshima A, Hayase M et al (2000) Final results of the Can Routine Ultrasound Influence Stent Expansion (CRUISE) study. Circulation 102:523–530
31. Nakamura S, Colombo A, Gaglione A et al (1994) Intracoronary ultrasound observations during stent implantation. Circulation 89:2026–2034