DOI 10.1007/s10723-008-9109-9
Evaluation of an Accounting Model
for Dynamic Virtual Organizations
Martin Waldburger· Matthias Göhner ·
Helmut Reiser· Gabi Dreo Rodosek ·
Burkhard Stiller
Received: 4 March 2008 / Accepted: 3 September 2008 / Published online: 25 September 2008 © Springer Science + Business Media B.V. 2008
Abstract Accounting of Grid resource and
ser-vice usage determines the central support activity for Grid systems to be adopted as a means for service-oriented computing in Dynamic Virtual Organizations (DVO). An all-embracing study of existing Grid accounting systems has revealed that these approaches focus primarily on tech-nical precision, while they lack a foundation of
M. Waldburger (
B
)· B. Stiller Department of Informatics (IFI),University of Zurich, 8050 Zürich, Switzerland e-mail: waldburger@ifi.uzh.ch
B. Stiller
e-mail: stiller@ifi.uzh.ch M. Göhner· G. Dreo Rodosek
Universität der Bundeswehr München (UniBwM), 85577 Neubiberg, Germany M. Göhner e-mail: matthias.goehner@unibw.de G. Dreo Rodosek e-mail: gabi.dreo@unibw.de H. Reiser
Leibniz Supercomputing Centre, 85748 Garching near Munich, Germany e-mail: reiser@lrz.de
B. Stiller
ETH Zürich, Computer Engineering and Networks Lab (TIK), 8092 Zürich, Switzerland
e-mail: stiller@tik.ee.ethz.ch
appropriate economic accounting principles and the support for multi-provider scenarios or vir-tualization concepts. Consequently, a new, flexi-ble, resource-based accounting model for DVOs was developed, combining technical and economic accounting by means of Activity-based Costing. Driven by a functional evaluation, this paper pur-sues a full-fledged evaluation of the new, gener-ically applicable Grid accounting model. This is done for the specific environment of the Leibniz Supercomputing Centre (LRZ) in Garching, Germany. Thus, a detailed evaluation methodol-ogy and evaluation environment is outlined, lead-ing to actual model-based cost calculations for a defined set of considered Grid services. The results gained are analyzed and respective conclu-sions on model applicability, optimizations, and further extensions are drawn.
Keywords Grid computing· Accounting ·
Dynamic virtual organization· Activity-based costing
1 Introduction
Grid service accounting constitutes a central func-tional support activity in both, research-oriented and business Grid systems, as it facilitates the creation of service and resource usage records.
Accounting relies on successful user authentica-tion and authorizaauthentica-tion. Once access to a resource or respectively a service is granted, resource usage has to be accounted reliably. This results from the fact that accounting data becomes retrievable for auditing purposes or—in a fully competitive environment—it is finally transferred into charg-ing records which in turn will be equipped by mon-etary values so that a bill to the service consumer can be issued. These steps are reflected by Au-thentication, Authorization, Accounting (AAA) [19, 27] and its extended view, A4C (AAA plus Auditing and Charging) [10,20].
Accounting for Grid systems represents an important research focus, since it constitutes on the one hand the key mechanism for commer-cial electronic services to be offered and charged to customers and on the other hand, accounting data potentially contain valuable information for a Grid service provider regarding current and past service usage as well as resource consump-tion. Such information can be used for charg-ing purposes as well as for internal optimization processes or service portfolio optimization. Both require accountable units that equip a service provider with significant information that corre-lates closely with chosen optimization criteria. For instance, a service provider may want to optimize its cost-benefit ratio. For that purpose Grid service accounting is required to produce records that allow this service provider to identify and classify the relevant set of cost drivers.
In the same way as Grid service accounting is of key importance to outlined reasons like suc-cessful commercialization and cost management, the respective steps of Grid service accounting have to build on a solid theoretical basis being represented by the appropriate underlying Grid accounting model. This Grid accounting model is required to satisfy multiple demands. These comprise technical requirements such as precision and scalability in obtaining accounting records, and, equally important, economic requirements such as a sound support of established cost ac-counting methods from the acac-counting across organizational boundaries in Dynamic Virtual Organizations (DVOs).
There are many accounting approaches for Grid systems available, which lack a sound
eco-nomic accounting basis as they are highly specific to the considered application case so that they are not generically applicable [15]. To overcome these shortcomings, a resource-driven and activi-ty-based accounting model for DVOs—as imple-mented by Grid systems—was developed [15,17]. The generic model which is described in greater detail in Section 2.3 is used to calculate costs incurred for a given Grid service in the context of a DVO. The developed model has proven to be a highly promising approach from a functional point of view [15].
Based on the existing conceptual evaluation of our presented approach in [15], a full-fledged assessment of this model in existing Grid envi-ronments needs to be undertaken. This evalua-tion constitutes the main focus of this work. It is done by applying the generic model to the Grid infrastructure operated by the LRZ, the Leibniz Supercomputing Centre in Garching near Munich, Germany [25]. The evaluation’s main goal con-sists in applying the conceptually evaluated Grid accounting model to an existing operational Grid infrastructure in order to reveal the key set of practical aspects relevant for model application and to determine model improvements and ex-tensions. In particular, the model is assessed by means of three dimensions. In consideration of the model’s overall aim to calculate costs of a Grid service, the evaluation addresses achieved model functionality, available and used means of model parametrization, and serviceability regarding the respective LRZ application context.
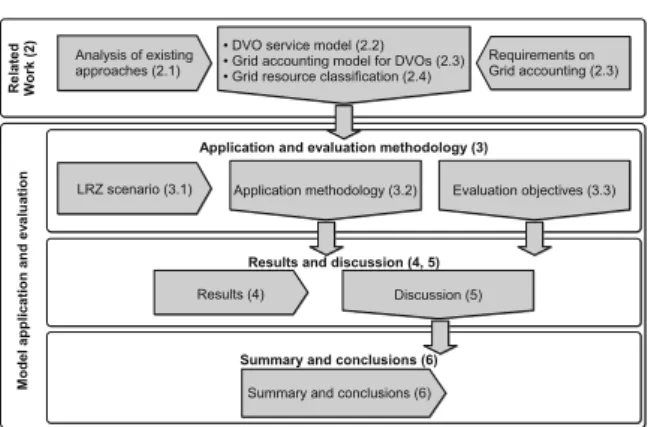
Accordingly, the remainder of this paper is structured as outlined in Fig.1. Section2provides an overview of related work for accounting in DVOs. Driven by the analysis of existing Grid ac-counting approaches (Section2.1) and the derived requirements on Grid accounting (mentioned ex-plicitly in Section2.3), this includes in particular a presentation of the respective key characteristics of previous achievements, namely the developed DVO service model (Section 2.2), a comprehen-sive Grid resource classification (Section2.4), and the developed Grid accounting model for DVOs (Section2.3).
Later sections address this work’s core focus determined as the application and evaluation of the generic Grid accounting model to the LRZ
Fig. 1 Paper structure (sections in brackets)
environment. This builds on a detailed descrip-tion of the used applicadescrip-tion and evaluadescrip-tion methodology in Section 3, covering an in-depth investigation of the considered LRZ Grid in-frastructure and the respective multi-domain Grid accounting scenario (Section 3.1), an all-embracing description on necessary steps to ap-ply the Grid accounting model to the determined scenario and LRZ infrastructure (Section 3.2), and a definition of objectives and requirements for model application assessment. According to those outlined application and evaluation meth-ods, model calculations and the according re-sults are presented in Section4and discussed in Section5. Driven by the gained insights, the work is summarized and the respective conclusions are drawn in Section 6, including proposed adapta-tions of the Grid accounting model.
2 Related Work
In this section, related work addressing the re-search domain of Grid accounting is presented and relevant concepts are discussed. Herefore, Section 2.1 contains an overview of existing Grid accounting approaches which are evaluated against a list of 23 identified criteria, which have been derived on comprehensive requirements analysis as well as various accounting-specific use cases. Moreover, as a sound theoretical basis for successful model application and evaluation, ter-minology in use and those key mechanisms for Grid service accounting in DVOs need to be
outlined. This covers in particular the inspec-tion of core achievements from previous work, namely those developed core models—DVO ser-vice (Section 2.2) and Grid accounting model (Section2.3)—as well as an all-embracing classifi-cation of Grid resources and possible accountable units (Section2.4).
2.1 Overview and Evaluation of Existing Accounting Systems
Based on a comprehensive survey on Grid ac-counting approaches in [11] and [15], the follow-ing provides an overview of existfollow-ing accountfollow-ing systems and tools from European as well as inter-national Grid projects and finally presents an eval-uation of fundamental characteristics as shown in Table 1. In the survey, the following accounting systems were analyzed:
– Accounting processor for Event Logs [7] – Distributed Grid Accounting System (DGAS)
[2]
– Grid Accounting Services Architecture (GASA)/GridBank [4]
– Grid Based Application Service Provision [16] – Grid Service Accounting Extensions [5] – Multi-organisation Grid Accounting System
[26]
– Nimrod/G [3,6]
– SweGrid Accounting System (SGAS) [29] In consideration of technical aspects, Table 1
depicts that, by focusing only on the account-ing of physically existaccount-ing Grid resources, none of the examined approaches addresses a concept for service and resource virtualization. Addition-ally, existing systems do not provide mechanisms for the accounting of composed virtual services and virtual resources as they are usually offered within multi-provider Grid environments. These are both key requirements for service provisioning and the according accounting in DVOs. Addition-ally, to some extent, only static environments with Grid resources of homogeneous nature and few accounting units are supported. Dynamic Grid environments with a high level of heterogeneity regarding services and resources, operating sys-tems, and Grid middleware solutions are in most cases not taken into consideration.
Table 1 Evaluation of existing systems (+ “Yes”, (+) “In parts”, – “No”, n.s “Not Specified”) [15]
Criteria Accounting system
APEL DGAS GASA GRASP GSAX MOGAS Nimrod/G SGAS
Interoperability and portability (+) (+) (+) n.s. (+) (+) + +
Scalability + (+) – n.s. + (+) + +
Integration (+) (+) (+) n.s. (+) + + +
Inter-organizational accounting + + + n.s. + n.s. n.s. +
Flexibility and extensibility + n.s. + n.s. + (+) (+) +
Support of existing standards – – (+) (+) (+) n.s. n.s. +
Support of multi-provider scenarios – – – – – – – –
Visualization of accounting data + – – n.s. n.s. + n.s. –
User transparency n.s. n.s. n.s. n.s. n.s. (+) n.s. (+)
Accounting of heterogeneous (+) + + (+) n.s. (+) n.s. –
resources
Accounting of virtual resources – – – – – – – –
Accounting of virtual services – – – – – – – –
Virtualization concept – – – – – – – –
Support of high dynamics + (+) (+) n.s. n.s. (+) + +
Security n.s. + + n.s. + + n.s. +
Standardized, generic interfaces – – – n.s. (+) n.s. + (+)
Support of various accountable + + + n.s. + n.s. n.s. –
units/metrics
Precision and abundance + + + + + + n.s. +
Support of different + + n.s. n.s. + – n.s. (+)
accounting policies
Reliability and fault tolerance n.s. n.s. (+) n.s. n.s. n.s. n.s. + Administration and management n.s. (+) n.s. n.s. n.s. n.s. n.s. +
Verification n.s. + + n.s. n.s. n.s. + +
Open source + + + – – n.s. + +
APEL Accounting processor for Event Logs, GRASP Grid Based Application Service Provision, GSAX Grid Service Accounting Extensions, MOGAS Multi-organisation Grid Accounting System
Beside the examined Grid accounting systems and tools, [18] presents a high-level description of an infrastructure comprising accounting, bank-ing as well as electronic payment services that are used for service-oriented Grid computing systems. This mainly theoretical approach only incorporates an accounting of elementary Grid services and physically existing Grid resources. Compound virtual Grid services and resources in multi-provider domains of DVOs are not taken into consideration. Additionally, the proposed architecture mainly focuses on payment issues and does not consider any aspects addressing the determination of costs incurred for a provided Grid service by combining technical and economic accounting, thus lacking an adequate economic basis.
In general, the study of existing approaches revealed that currently deployed Grid accounting
systems mainly focus on technical precision and project-specific issues while they are not based on adequate economic cost accounting principles suitable for the accounting across organizational boundaries and DVOs. In addition, present ac-counting systems and tools usually have been de-veloped for specific application areas comprising homogeneous hardware platforms and uniform technical infrastructures thus being not generi-cally applicable on highly dynamic Grid environ-ments [8,11]. Moreover, in many cases, the focus of existing accounting approaches is mainly on technical optimization criteria like measurement procedures and metering points with regard to the acquisition of accounting relevant data. De-spite the fact that existing systems as for exam-ple SGAS, DGAS and GASA consider economic aspects, e.g., payment schemes and bank services, business aspects of accounting regarding methods
of cost calculation and cost accounting are not taken into account by any approach.
Since the above identified missing characteris-tics of existing Grid accounting approaches are of key relevance to a technically and econom-ically sound multi-domain Grid accounting, the need to develop an appropriate Grid accounting model for DVOs became apparent. This led to major achievements in the suitable DVO service (cf. Section2.2) and Grid accounting models (cf. Section2.3) on one hand and in a classification of different Grid resource types on the other hand (cf. Section 2.4). These results of previous work constitute a solid theoretical basis for the Grid accounting model’s application and evaluation. 2.2 DVO Service Model
In previous work [15], a comprehensive service model for DVOs was developed taking into ac-count the concept of resource and service virtual-ization within multi-provider Grid environments. This service model which reflects the provider’s perspective is structured into two separate layers, i.e., a Virtual Organization (VO) layer and a layer of underlying real organizations (RO) providing an adequate basis with respect to appropriate
1 0..* 1 1..* 1 0..* includes 0..* 1..* utilizes 0..* 1..* 1 0..* 0..* 0..* is ma pped 1 0..* 1 0..* includes 1 0..* includes 1 0..* 0..* 0..* utilizes 0..* 1 0..* 1 0..* 1 0..* 0..* 1..* 0..* 0..* 0..* utilizes utilizes 1 0..* 0..* 0..* 1 utilizes 1..* 1..* 0..* 0..* 1 includes includes is ma pped -elements Virtual Resource -elements
Real Service Real Resource
-members Real Organization -members Virtual Organization 0..* 0..*
provides resource(s) / service(s)
1 0..* 1..* -elements Virtual Service 0..*
elements from potentially different ROs / VOs
Fig. 2 Formal representation of the service model [11]
structure descriptions and possible compositions of virtual services and virtual resources provi-sioned within the context of DVOs.
Figure2 illustrates a formal representation of this service model comprising all relevant entities as for instance VOs and ROs along with their elements, i.e., real services (S) and real resources (R) as well as virtual services (VS) and virtual resources (VR). Moreover, the UML notation of the service model reflects possible types of inter-actions between involved elements as for example utilization, composition as well as a mapping be-tween VO and RO layers. A detailed overview of the service model along with a description of its elements and fundamental characteristics, as well as a presentation of concrete examples regarding resource and service provisioning within DVOs can be found in [11,15].
2.3 Grid Accounting Model for DVOs
Based on the service model for DVOs introduced in Section2.2and driven by the analysis of existing Grid accounting approaches (cf. Section 2.1), a generic accounting model was proposed [15,17] that allows for the accounting of complex, com-posed virtual services and virtual resources in multi-provider Grid environments, thus, going a step further than existing approaches.
The presented accounting model which focuses on economic and technical aspects was derived in accordance with a set of determined generic, DVO-specific requirements. Concrete examples are (i) compliance with the service model for DVOs, (ii) providing capabilities for bridging the concepts of cost accounting and technical account-ing, (iii) support of various accountable units adequately reflecting resource consumption and service usage, as well as (iv) a high degree of flexibility, applicability, and extensibility for the use within highly dynamic Grid environments.
The proposed accounting model relies on two accounting concepts that are well-known in the domain of (economic) cost accounting: These are the Traditional Cost Accounting System (TCAS) and Activity-based Costing (ABC) [21,22]. TCAS relates to established, standard methods in eco-nomic cost accounting—also referred to as man-agerial or internal accounting. Hence, details on
principles of TCAS can be found in text books on cost accounting, such as [23]. ABC is a widely accepted costing system that is particularly well suited for the accounting of electronic services [13]. In our Grid accounting model, TCAS and ABC are interconnected by means of so called ser-vice constituent parts, namely Processing, Storage, Transferring, and Output, representing a consis-tent set of building blocks every provisioned Grid service can be composed of. Figure 3 illustrates the fundamental idea of bridging the gap between TCAS and ABC by means of the identified service constituent parts along with their central role in the accounting process.
In addition, these four service constituent parts represent the basic hardware functionality within the context of Grid Computing, out of which any electronic service is assembled by some spe-cific amount. The service constituent parts them-selves are adapted to the specific resource they reflect. This is required, since typically differ-ent costs incur, when a job is run on differdiffer-ent hardware or with specified service guarantees. Thus, in addition to interconnecting TCAS and ABC, these service constituent parts also inter-connect economic and technical accounting. Tech-nical accounting is defined as the “collection of resource consumption data for the purposes of ca-pacity and trend analysis, cost allocation, auditing, and billing. Accounting management requires that
Fig. 3 Accountable units overview [15]
resource consumption be measured, rated, as-signed, and communicated between appropriate parties” [1]. Accordingly, the use of service con-stituent parts as a concept in order to configure activities for ABC links to the respective set of accountable units as needed for metering and ac-counting record preparation.
– Processing calculates costs for computation
and data processing by using computational resources.
– Storage considers incurred costs for data
storage and archiving by means of storage resources.
– Transferring reflects costs for transferring
data within or between ROs or VOs respec-tively by use of network components.
– Output calculates costs for generated output,
e.g., printed documents, graphical representa-tion of simularepresenta-tion results etc.
Moreover, in order to be able to allocate also other costs for service provisioning which are not chargeable to any of the above mentioned ser-vice constituent parts, a further generic serser-vice constituent part Other has been specified. Con-crete examples for this service constituent part are organization-specific cost elements such as, e.g., administrative cost that accrue due to service provisioning, but which cannot be mapped to a particular resource. Finally, the constituent part External is used to take costs into consideration that are associated with the usage of a service or a resource provisioned by an external provider as for example another VO. A detailed description of the identified service constituent parts along with concrete examples with respect to applicable metrics, relevant cost drivers, and associated costs can be found in [15].
These identified service constituent parts are resource-specific and mapped to activities. This means that the final IT product, e.g., in form of a composed virtual service consists of a num-ber of sub processes whereas sub processes are composed by activities, and activities are finally composed by service constituent parts serving as building blocks in the cost analysis process. In the example given in Fig.4, VO1 offers a virtual
Fig. 4 ABC accounting model for DVOs
provided by RO1 and RO2. In addition to the
costs incurred by sourcing those external services, additional costs as for instance for administrative activities are included on the VO level. Focusing on the first external service provided by RO1, the
example reflects the cost-relevant activities which are needed in order to provide this service to VO1.
Similarly, on level of RO1, an external service is
sourced from a third party, followed by RO1’s
main process along with other cost elements that are not specified in greater detail at this stage. Within the administrative domain of RO1,
sev-eral steps that aggregate information are taken, leading in a top-down approach to a fine-granular process cost analysis, until, on the lowest level, the respective service constituent part assignment per real IT resource is conducted.
2.4 Grid Resource Classification
By means of those presented generic and extend-able service constituent parts, our Grid accounting model provides the basis for a highly flexible, resource-based accounting in DVOs. In order to apply the model to a complex and heteroge-neous environment such as the LRZ, however,
an in-depth understanding of those resources of use in Grid systems is needed. Within the con-text of commercial and research-oriented Grid environments, e.g., the D-Grid, a German-wide Grid infrastructure for establishing methods of e-Science in the German scientific community [9], a variety of different types of Grid resources hav-ing a high degree of heterogeneity can be iden-tified. The basic requirement of the accounting system of supporting an accounting of various types of real as well as virtual Grid resources, which determine the basis for electronic service provisioning, implies the development of a tax-onomy of Grid resources and possible sub types of resources.
Therefore, a classification of different Grid re-source types is presented. This classification pro-vides an appropriate basis for the identification of accounting units and metrics adequately re-flecting resource consumption and service usage.
Group of resource
Possible
sub groups Examples
Possible accounting units Computational elements Multi processor systems Single processor systems Hardware elements/ emulators Storage elements Primary storage elements Mass storage elements Databases Relational databases XML databases Network components -Software components/ libraries -Costs for: Resources for data aquisition -Further resources/ resource types -Due to different characteristics of resources very application-specific accounting units Vector computer Parallel computer Cluster computer (e.g., IBM p690 Cluster etc.) High-performance computer (e.g., SGI Altix 4700 etc.) etc.
Desktop PCs (e.g., X86, x86_64, PowerPC etc.) etc.
FFT hardware (e.g., special hardware emulators etc.) Co processor etc. Main memory Caches (e.g., special harddisk caches etc.) etc. RAID systems Tape systems Archive systems etc. mySQL Oracle IBM DB2 etc. eXist Xindice Tamino etc. Router Switch Gateway Communication networks (e.g., LANs, WLANs, WANs) etc.
Software licenses (e.g., medical software etc.) Program libraries Specialized software etc.
Gauging station (e.g., virtual telescope, observatories) Specialized hardware (e.g., electron microscopes, etc.) Sensors
etc. Information systems Visualization components Administration/support QoS parameters (e.g., priorities etc.) etc. CPU seconds CPU hours Wallclock time Number of CPUs Number of nodes Number of computers/ computer systems MIPS etc.
Number of page accesses Main memory (max.) Main memory (avg.) etc.
Used storage (MB/GB/TB) Used storage x time etc. Number of accesses Utilization time Value of extracted information etc. Bandwidth Transferred data (MB/GB/TB) etc. Software licenses Applications Access to libraries etc. Number of accesses Utilization time etc.
Fig. 5 Classification of grid resources and possible ac-counting units
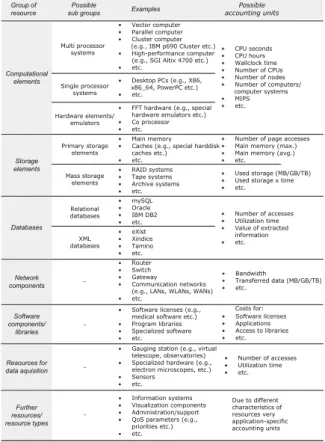
Basically, the following set of Grid resources can be identified: – Computational elements – Storage resources – Network components – Databases/information repositories – Software components and licenses
– Specialized hardware and scientific devices In Fig. 5 a detailed classification of Grid re-sources and possible sub groups along with a list of appropriate accounting units per resource type is outlined, thus providing a useful basis for the specification of accounting units for the identified service constituent parts as described in Section2.3.
3 Application and Evaluation Methodology
In accordance with service and accounting model characteristics, and in consideration of the de-scribed Grid resources, the used methodology for application and evaluation of the presented Grid accounting model needs to be outlined. Section 3.1 determines an LRZ-specific scenario for Grid accounting model application and eval-uation. This involves detailed considerations of LRZ infrastructure and Grid services as well as an overview of financial, cost-related input data. While Section3.2outlines those functional steps required for Grid accounting model application, the set of relevant evaluation objectives and re-quirements is determined in Section3.3.
3.1 LRZ Scenario Definition
The heterogeneous supercomputing infrastruc-ture of the LRZ constitutes a complex applica-tion environment for the Grid accounting model at hand. Section 3.1.1 introduces the LRZ Grid infrastructure components. This is followed by presenting an elaborate accounting scenario in Section 3.1.2. The LRZ Grid infrastructure and the scenario provide the basic frame for sub-sequent model application—in particular with respect to cost calculations—and evaluation tasks.
3.1.1 LRZ Grid Infrastructure
As a service provider for scientific high perfor-mance computing, the LRZ operates computa-tion systems for use by educacomputa-tional institucomputa-tions in Munich, Bavaria as well as on a nationwide level. Beyond operation of system hardware, services offered at the LRZ also comprise backup/archive, Grid Computing as well as training courses on usage of High Performance Computing (HPC) systems, parallel programming and optimiza-tion [24].
The LRZ infrastructure encompasses several computing facilities. These consist, e.g., of the new National Supercomputer “Höchstleistungsrech-ner in Bayern II” (HLRB II) based on SGI’s Altix 4700 platform which is optimized for high application performance and high memory band-width. Within the second phase of installation, the HLRB II has currently a total number of 9,728 CPU cores based on Intel Itanium2 Montecito Dual Core processors with an overall peak per-formance of 62.3 TFlop/s and 39 TByte of system memory as well as 600 TByte of direct attached disks. Current projects performed on the HLRB II reside in the domain of applied mathematics, astrophysics, biosciences, chemistry, and compu-tational fluid dynamics etc. [24].
Moreover, the LRZ consists of several Linux-based cluster systems of varying size, perfor-mance, interconnect, and architecture (32 and 64 bit Intel processors) comprising close to 700 CPU cores in total. In 2008, the LRZ Linux clusters are extended to more than 3,500 CPU cores. The LRZ Linux clusters offer shared and distributed memory, varying available memory sizes, paral-lelization based on message passing (MPI), and shared memory parallelization. The main focus of the Linux cluster systems is the development and testing of HPC applications as well as capacity computing.
The computing facilities offered at the LRZ— in particular the Linux clusters—are character-ized by a high degree of heterogeneity with respect to underlying hardware platforms, num-bers of processors, sizes of shared memory, and batch systems. In addition, three different kinds of Grid middleware solutions (Globus Toolkit [14], UNICORE [30] and gLite [12]) are currently
in productive use resulting in a heterogeneous Grid infrastructure.
3.1.2 Multi-domain Grid Accounting Scenario In the following, a fictitious scenario addressing the utilization and the accounting of a complex virtual service is presented in detail. This scenario can be seen as a concrete instantiation of the service model introduced in Section2.2. It serves as a basis for the evaluation of the proposed ac-counting model. Moreover, the example scenario is enhanced with concrete values and parameter settings reflecting the usage of a compound vir-tual service consisting of several underlying ser-vices and resources which can be seen as building blocks the virtual service is composed of. Based on existing real-world accounting data reflecting service usage and resource consumption within the layer of the underlying real organizations, i.e., the Grid infrastructure at the LRZ, an abstraction with regard to the virtual resources and virtual services provisioned within the layer of the Virtual Organizations is being performed.
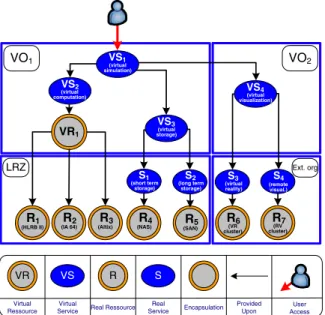
This multi-domain scenario as depicted in Fig. 6 comprises two VOs (VO1 and VO2) and
two underlying ROs consisting of the LRZ which is part of VO1 as well as a fictitious Grid service
VR1 VO1 VO2 LRZ Virtual Ressource VS R S VR Virtual
Service Real Ressource Real Service Encapsulation Provided Upon User Access VS1 (virtual simulation) VS2 (virtual computation) VS3 (virtual storage) R1 (HLRB II) R2 (IA 64) (Altix)R3 S1 (short term storage) S2 (long term storage) R4 (NAS) (SAN)R5 R(VR 6 cluster) R(RV7 cluster) S3 (virtual reality) S4 (remote visual.) Ext. org VS4 (virtual visualization)
Fig. 6 Fictitious accounting scenario
provider being part of VO2thus spanning multiple
administrative domains. For reasons of simplifica-tion, the presented scenario only contains a 1:1 mapping between involved VOs and the underly-ing ROs, i.e., one VO consists of exactly one RO. In real-world Grid environments, the normal case is that several ROs jointly participate in one or multiple VOs, respectively.
Within the considered example scenario, VO1
offers a virtual simulation service (VS1)
per-forming large, three-dimensional simulations of turbulent flows and reactive flows in complex geometries. Accordingly, VS1 comprises several
data- and computation-intensive tasks. In the sce-nario, the simulation service VS1 provisioned by
VO1 consists of several (sub) elements, i.e., real
as well as virtual services and resources which are offered by different organizations (VOs and ROs) jointly contributing the offered functionality of the virtual service VS1.
The virtual simulation service VS1 comprises a
virtual computation service (VS2) which is
pro-vided upon a compound virtual computation re-source (VR1) on which complex calculations are
performed. Moreover, VS1makes use of a virtual
storage service (VS3) being composed of two
un-derlying real storage services (S1 and S2) offered
within the LRZ. VS3is used for the archival
stor-age of acquired simulation results. The real data services S1 and S2 which are responsible for the
resource management coordination as well as the transparent storage of the data are provided upon physically existing storage resources R4 and R5.
Finally, the virtual simulation service comprises a visualization service (VS4) offered by an external
provider (VO2) in order to graphically illustrate
the simulation results which are forwarded from the computation service VS2.
Within the considered scenario, 19% (=512 processors) of the supercomputer HLRB II (R1)
are available for the execution of the user job. In addition, negotiated Quality-of-Service (QoS) parameters with respect to, e.g., execution time of a user job have to be met. Therefore, besides the HLRB II also a part of the 64-Bit cluster IA 64 (R2) of the LRZ infrastructure comprising
a total of 220 processors as well as 25% (=32 processors) of the Linux Cluster based on the SGI Altix 3700 Bx2 (R3) are used as part of the virtual
computation resource VR1. In order to perform
the necessary calculations of the simulation ser-vice the 512 processors of the supercomputer HLRB II are used for 2.5 h with a memory uti-lization of 2 GByte per processor whereas the physically existing resource R2 is utilized for 4 h
along with a utilization of 1 GByte per processor of primary storage. Finally, 25% of the SGI Altix 3700 cluster is utilized for a time period of 6 h together with a temporary consumption of main memory of 1.5 GByte per processor.
Simulation results with an overall size of 7 TByte are archived on storage resources at the LRZ by use of the two real data services S1 and
S2. In this context, frequently used simulation
results with a total size of 2 TByte are stored for 5 days on the network-attached disks of the HLRB II (R4) in form of network attached
stor-age (NAS) for short-term access, whereas 5 TByte of infrequently used simulation data are archived for 360 days by means of a storage area network (SAN) (R5).
Further functionality of the virtual simulation service VS1 offered to the customer includes
graphical representation of simulation results by means of a visualization service. Due to the fact that the user has specific requirements regarding simulation data visualization, a customized visual-ization service (VS4) provisioned by an external
provider (VO2) is used in order to visualize the
simulation results by using the real services S3and
S4which are each based on specialized
visualiza-tion hardware or software (R6 and R7) offered
at an external Grid service provider. In order to perform a rendering of three-dimensional turbu-lent flow graphics, the visualization service VS4is
utilized for the time period of 2 h. The accordingly resulting total costs are not directly obtainable by VO1 since VO1 does not have access to detailed
accounting and charging records of VO2. Instead,
aggregated and consolidated pricing information is forwarded to VO1in form of a bill.
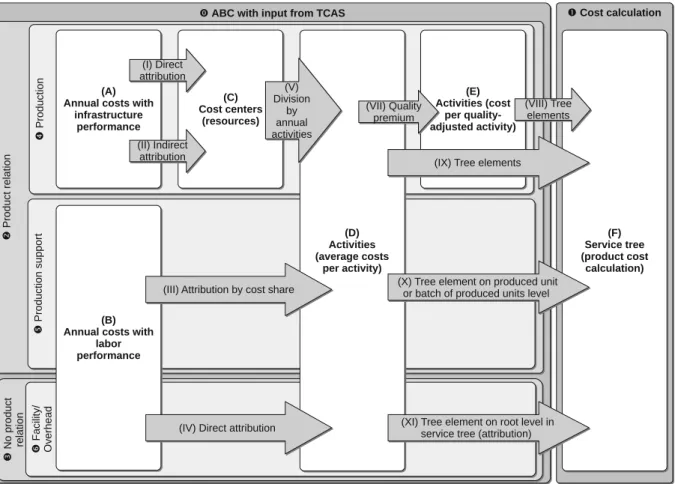
3.2 Accounting Model Application Methodology Applying an extensive and flexible accounting model to a complex environment requires an elab-orate methodology to be in place. Figure 7 pro-vides an overview of the chosen model application
methodology. It is structured into two main, chronologically separated building blocks, namely ABC taking input values from TCAS (0) and IT product cost calculation (1). IT product cost cal-culation relies on those activity costs determined by ABC. Section 3.2.1 and Section 3.2.2 explain procedures required for (0), while Section 3.2.3
details (1).
3.2.1 Annual Cost Input from TCAS
ABC seeks to identify costs per activity. In the applied methodology, activities are grouped by the criterion whether they can be related to an IT product (2) or they lack a product relation (3). Ac-tivities with product relation are further grouped in production activities (4) and activities that support production (5). The first category covers activities as determined by resource-specific in-stantiations of the introduced service constituent parts, namely Processing, Storage, Transferring, Output, External, and Other. The latter includes activities such as IT service and infrastructure management. Activities without product relation typically embrace facility management and ad-ministrative tasks (6).
The accounting model takes annual costs of various types as input. These cost elements con-stitute typical values of TCAS. In the area of production-oriented activities, input values are needed in terms of annual costs with infrastruc-ture performance (A). This is due to the fact that IT production in this context means the pro-visioning and composition of electronic services, such as a storage service. These services, out of which the final IT product is composed, are pro-vided on infrastructure, that is, on IT resources. A given annual cost element with infrastructure performance is either attributed directly to the specific resource it relates to (I) or—in case these costs are not directly attributable to one of the existing IT resources—that cost element needs to be attributed indirectly by means of an allocation base, which is bound to an additional cost-relevant characteristic (II). IT resources, thus, reflect a concept from TCAS, namely the idea of a cost center. These cost centers embrace LRZ-internal computing and storage resources (C) as described in full detail in Section3.1.1.
Fig. 7 Accounting model application methodology overview
In order to allocate indirect costs to resources, attribution keys need to be in place as an alloca-tion base. Table2lists those three attribution keys considered, namely floor space, power consump-tion, and uptime. The Grid accounting model is by no means limited to this specific set of attribution keys. This selection reflects information available at the LRZ, cost-wise relevant to the specific LRZ resources. The initial investment (ine, not differentiating between state and LRZ financing
Table 2 Considered resource attribution keys
Attribution key Unit
Floor space consumed by a m2
resource, including space required for maintenance
Annual resource power consumption kW/year
Annual resource uptime h/year
share) and annual operation costs (ine/year) for air conditioning infrastructure, emergency system, network infrastructure, and buildings constitute those LRZ cost elements with infrastructure per-formance that are not directly attributable to one of the considered computing or storage resources. As internal and external network traffic specific to Grid services is currently not separable from other traffic at the LRZ, all network-related costs need to be handled as indirect costs, even though, in principle, these costs would qualify to be di-rectly attributable to network resources and, in a second step, to the according Transferring service constituent parts.
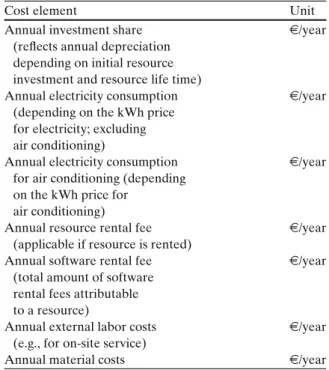
Table 3 lists directly attributable costs with infrastructure performance. These consider the annual cost elements available from LRZ’s TCAS. Annual investment shares are not directly available, but calculated as the division of an IT
Table 3 Directly attributable annual costs with infrastruc-ture performance
Cost element Unit
Annual investment share e/year
(reflects annual depreciation depending on initial resource investment and resource life time)
Annual electricity consumption e/year (depending on the kWh price
for electricity; excluding air conditioning)
Annual electricity consumption e/year for air conditioning (depending
on the kWh price for air conditioning)
Annual resource rental fee e/year (applicable if resource is rented)
Annual software rental fee e/year (total amount of software
rental fees attributable to a resource)
Annual external labor costs e/year (e.g., for on-site service)
Annual material costs e/year
resource’s initial investment by its life time. Sim-ilarly, costs for annual electricity are calculated with the help of additional parameters. They re-sult from multiplying an IT resource’s annual up-time by its applicable kWh price and nominal power consumption.
After direct (I) or indirect (II) attribution of annual costs with infrastructure performance (A), total annual costs per considered IT resource— each representing a cost center—are revealed (C). Total annual costs per resource are defined as the sum of all direct annual cost elements and all indi-rect annual cost elements. The latter is attributed according to the respective annual cost share for air conditioning, emergency system, network in-frastructure, and building costs. For instance, the annual air conditioning cost share for the Opteron cluster resource (cf. Section 3.1.1) is calculated by adding annual air conditioning operation costs to the annual air conditioning depreciation share (i.e., the division of the original investment in air conditioning infrastructure by its life time), and multiplying this sum by the ratio of the Opteron cluster’s nominal power consumption to the
to-tal nominal power consumption of all considered resources.
In contrast to annual costs with infrastructure performance (A), annual costs with labor perfor-mance (B) do not require an intermediate attribu-tion step to cost centers, i.e. resources, since labor performance costs are directly related to activities (D). Annual costs with labor performance (B) and production support (5) embrace human labor ac-tivities which are grouped after process acac-tivities of the IT Infrastructure Library (ITIL) [28] ver-sion 2. These best practices determine the de-facto standard in service management. The respective books on infrastructure and service managements are of particular importance for this work as they are concerned with production support activities. Due to the fact that the LRZ cannot provide any information on employee work assignments for legal reasons, an estimation of which ITIL activity is more costly than another is not feasible at this time. Therefore, it is assumed initially that all ITIL activities need to cover an equal cost share. These relative cost shares (20% for each ITIL activity, since 5 ITIL activity types are considered) are used as keys to attribute (III) annual costs with labor performance (B) and production support (5) to the respective ABC activities (D). Annual costs are available at the LRZ for two labor categories, internal operations and internal support. For both categories, the number of positions at the LRZ is multiplied by the average wage, the results added, then multiplied by the applicable percental cost share, and finally divided by the mathematical product of annual working days and daily work-ing hours. By this calculation (III), average costs per hour are gained for each considered ITIL activity (D).
Annual costs with labor performance (B) with-out product relation (3) include facility manage-ment and administrative overhead activities. For both types, average costs per activity (D) are di-rectly retrievable (IV), i.e., an attribution accord-ing to a key is not necessary. Consequently, the applied calculation method represents a simplified version of the method used for ITIL activities: The number of positions at the LRZ is multiplied by the average wage, and the result is divided by the mathematical product of annual working days and daily working hours. This results in average costs
per hour and activity (D), whereas these activities embrace the mentioned facility management and administrative overhead.
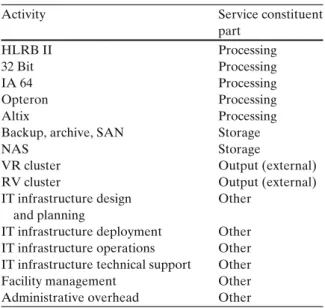
3.2.2 Resource-Specific Activity-based Costing Table 4 gives an overview of those 15 activi-ties (D) resulting from either dividing resource-attributed costs by annual activities (V) or attributing annual costs with labor performance (B) by either cost share (III) or by direct attri-bution (IV). For each activity, the corresponding service constituent part is listed. Production activ-ities (4) are represented by a Processing, Storage, or external Output service constituent part, while production support (5) and facility/overhead ac-tivities (6) are represented by the service con-stituent part Other.
This list of activities constitutes the key func-tional step in applying the Grid accounting model as it comprises those activities that form the basis for ABC. At this step in model application (D), first the full list of activities for building a service tree (F) from is available, and second the aver-age costs per activity are revealed. This means, e.g., for the Processing activity Altix that costs for computing on that resource per CPU second are known. In general, costs per activity and the accordingly applicable metric are determined.
Table 4 Activities and service constituent parts
Activity Service constituent
part HLRB II Processing 32 Bit Processing IA 64 Processing Opteron Processing Altix Processing
Backup, archive, SAN Storage
NAS Storage
VR cluster Output (external)
RV cluster Output (external)
IT infrastructure design Other and planning
IT infrastructure deployment Other IT infrastructure operations Other IT infrastructure technical support Other Facility management Other Administrative overhead Other
All Processing and Output activities use CPU seconds, all Storage activities use resource reser-vation events, and all Other activities use work-ing hours as metric. As Output activities are not provided internally, but are offered by an external provider (see Section 3.1.2 for scenario details), cost calculation and metric selection decisions lie within that other organization’s responsibility. Calculations for these activities, hence, are not performed with the same granularity as it is the case for internal activities. Consequently, the met-ric of CPU seconds is not used for actual cost calculations, but seen as a metric to appear on a bill received by that other organization.
From a business logic viewpoint, metrics are bound to ABC’s activity drivers. Activity drivers are perceived as the event or fact that influences an activity’s intensity with respect to costs in-curred. For Processing activities, this cost trigger-ing event is found, for instance, in the atomic computing activity of a CPU second used on a given resource. Those chosen metrics, however, are neither fully deterministically selected nor are they elements of a statically defined set of avail-able metrics. Accordingly, those metrics chosen here are on the one hand inspired by the overview on accountable units provided in Fig. 5, on the other hand determined by metering capabilities available at the LRZ.
The activities determined as shown in Table4
can either directly (VIII to XI) form elements of the service tree (F) for product cost calculation (1) or, before that, they can be further refined in order to support quality adjustments (E). Quality-adjusted activities are determined for all internal activities, thus according to the applicable sce-nario (cf. Section 3.1.2), for all Processing and Storage activities. The underlying principle for quality adjustments funds on a quality premium scheme. It supposes that non-adjusted activities (D) include a standard configuration. For Stor-age activities, a two-dimensional standard config-uration is assumed. For backup, this includes a resource reservation of 1 TByte capacity for the duration of 360 days, while for NAS, a capacity of 1 GByte for the duration of 30 days is assumed. Similarly, Processing activities see a presumed two-dimensional standard configuration of 1,024 CPUs with 4 GByte of main memory per CPU
available in case of HLRB II, and of 32 CPUs with 1 GByte main memory per CPU for all other LRZ computing resources. Whenever a standard configuration needs to be changed increased costs for (potentially) intensified resource usage are possible to be reflected by a cost premium (VII), which is a percental supplement to the average activity costs (D).
A quality premium is represented by ABC’s resource driver concept. Resource drivers—as op-posed to activity drivers—are events or facts that influence a resource’s usage intensity, such as a resource reservation for extended storage ca-pacity. Multi-dimensional quality premiums are implemented by defining a multi-dimensional unit. For Storage activities, that is GBd (GByte day), while for Processing activities, a unit called CGB (CPU second GByte) is used. Both units are calculated as the mathematical product of each involved single-dimension unit. For instance, quality-adjusted costs for the Storage activity NAS are determined by dividing first the standard, i.e., not quality-adjusted cost for NAS by its standard GBd configuration (368,640 GBd as the mathe-matical product of 1,024 GByte and 360 days). This intermediate result is multiplied by the re-spective quality premium, resulting in quality-adjusted costs measured by a unit ofe/GBd.
While the same quality premium concept ap-plies for calculation of quality-adjusted activity costs of Storage activities and of Processing activ-ities, the respective used multi-dimensional units need to be differentiated clearly: The unit of GBd is used exclusively for Storage activities, and CGB is used exclusively for Processing activities. 3.2.3 IT Product Cost Calculation
According to the scenario-specific service tree de-picted in Fig.6, in the following the methodology introduced in Section3.2concerning product cost calculations is altered by means of concrete val-ues. On the one hand used data directly correlates to some extent to concrete values and parameter settings acquired from the LRZ, on the other hand some of the data is based on assumptions or approximations, respectively.
On top-level, the virtual simulation service VS1
offered within VO1is composed of virtual services
being represented by the service constituent parts Processing (VS2), Storage (VS3), as well as the
service constituent part Output (external), reflect-ing the usage of the virtual service VS4offered at
an external Grid service provider. Additionally, in order to adequately reflect the activities being performed using the virtual simulation service, tasks with regard to the design and planning of the compound virtual service VS1have to be taken
into consideration as well, resulting in a total of 10 working hours estimated which are being mapped on a batch of 20 service requests. This implies that 5% of the resulting costs for these activities have to be calculated per service invocation. Ad-ditionally, costs occurring with respect to facility management (0.5 h per service request assumed) as well as administrative overhead (1 h per service request estimated) being covered by the service constituent part Other also have to be incorpo-rated as relevant activities having a direct rela-tion to the compound virtual simularela-tion service VS1. Finally, expenses originating from activities
with respect to IT service management have to be taken into consideration as well. Due to the high degree of dynamics within the context of DVOs as well as rapidly changing business processes, concerning the compound virtual simulation ser-vice VS1, configuration management and change
management constitute important ITIL activities which result in 15 working hours estimated each, also being mapped on a batch of 20 service re-quests. These subcategories of IT service manage-ment, thus, result in total in 30 working hours per 20 service requests.
The virtual computation service VS2 itself is
performed using the composed virtual computa-tion resource VR1comprising the HLRB II (R1),
the IA 64 cluster (R2) as well as the Altix cluster
(R3). Within the scenario, 512 processors of the
HLRB II are used for 2.5 h (=9,000 CPU seconds) each with an average main memory utilization of 2 GByte per processor, resulting in 1,024 CGB which is lower than the standard configuration of 512 CPUs and 4 GByte of reserved main mem-ory by the factor of 2. Additionally, in order to process the user job, the entire IA 64 cluster (R2)
comprising a total of 220 processors is utilized for 4 h (=14,400 CPU seconds) along with an average memory usage of 1 GByte per CPU resulting in
220 CGB in total. Finally, 25% (=32 processors) of the Altix cluster are utilized for a time period of 6 h (=32,600 CPU seconds) each, together with the utilization of 1.5 GByte of main memory per CPU (=48 CGB) which exceeds the standard con-figuration for computing resources, thus, resulting in quality-adjusted costs per activity. Moreover, concerning the virtual computation resource VR1
costs regarding the IT infrastructure deployment as well as the IT infrastructure operations have to be taken into consideration, resulting in a total of 10 working hours estimated per activity and per month which have to be mapped on a batch of 5 service requests of the virtual computation service VS2. Due to fact that negotiated QoS parameters
with respect to execution time have to be met (cf. Section 3.1.2), also costs reflecting ITIL ac-tivities in relation to Service Level Management resulting in 1 working hour estimated per service request have to be incorporated into the product cost calculation.
Additionally, in the scenario the compound vir-tual storage service VS3 provided by VO1
com-prises two real data services S1 and S2 offered
at the LRZ which in turn are provisioned upon the physical storage resources R4 in form of a
NAS and R5 being a SAN. Within the scenario
depicted in Section3.1.2, the real data service S1is
used in order to store frequently used simulation results with a size of 2 TByte for the time period of 5 days, which results in a total of 10,240 GBd, thus exceeding the standard capacity and duration activity for storage resources. Besides, in order to archive 5 TByte of simulation data on the long-term data storage for 360 days, the real data ser-vice S2making use of a magnetic tape system (R5)
offered at the LRZ is used. The utilization of the real long-term storage service S2 results in a total
of 1,843,200 GBd. In addition, costs reflecting the IT infrastructure technical support of the storage resources have to be considered when calculating the costs of the activities being performed by means of the virtual data service. Hence, overall costs of 5 working hours estimated in relation to technical storage resource support—to be mapped on a batch of 10 service invocations—also have to be calculated per service request. In order to assure long-term archival storage of the simula-tion data using the virtual storage service VS3,
activities with respect to continuity management also have to be considered, resulting in 0.5 work-ing hours estimated per service request.
Finally, as shown in the service tree presented in Section 3.1.2, a virtual visualization service (VS3) is part of an external Grid service provider
(VO2) and is used in order to graphically
repre-sent obtained simulation results by consuming two real visualization services, S3 and S4. According
to the bill which is forwarded by the external Grid service provider to the customer VO1, a VR
cluster (R6) as well as a remote RV cluster (R7)
both represented by the service constituent part Output (external) are each utilized for 1 h (=3,600 CPU seconds).
3.3 Key Evaluation Objectives and Requirements
Based on the fact that the identified activities are resource-specific and have to be adapted to the particular resources they reflect (cf. Section
2.3), the evaluation of the proposed accounting model needs to include a detailed infrastructure and service analysis. This analysis needs to docu-ment what resources are available (formally also reflected by resource-specific activities) and what commercial services need to be run on them (lead-ing to a bill of activities and the fully documented service tree). Based on this information, the eval-uation shall reveal what costs need to be covered per service request.
As input data to the Grid accounting model, information from the traditional financial and the cost accounting—both areas of economic (as op-posed to technical) accounting—is needed. This comprises, for instance, information on invest-ments or maintenance costs incurred during a fis-cal year. These cost elements are first categorized into cost categories and secondly either directly or indirectly allocated to cost centers. Those steps still determine typical activities in a traditional accounting system. The evaluation, thus, needs to answer the questions whether such information was available at the LRZ in the first place and if it was of the right granularity in order to deliver meaningful input for the accounting model.
Overall, the conducted evaluation shall answer how well the existing Grid accounting model is
able to calculate costs to be covered for a specific service request. In particular, and by means of varying assumptions, the evaluation shall depict for a real Grid infrastructure what input data and also what level of detail is required to al-low the model to produce meaningful results with reasonable costs incurred by using the model. Further, potential improvements to the model need to be derived. Driven by these key eval-uation requirements outlined, the set of specific qualitative evaluation criteria is determined as listed subsequently:
– Model functionality: General functionality of
the Grid accounting model and information content provided is assessed. This comprises in particular the achieved level of result ex-pressiveness, addressing both, gained insight as well as limitations encountered.
– Model parametrization: The applied set of
ser-vice constituent parts, considered metrics, and chosen activity/resource drivers is examined in detail. This addresses unit characteristics with associated interdependencies. Effects of changes in calculation input parameter as-sumptions are of particular interest.
– Model application context: The respective
available input data for model application by means of the presented multi-provider scenario is assessed. Sensitivity analyses with respect to product cost impact caused by sce-nario parameter changes are evaluated. The discussion on model functionality is con-ducted in Section 5.1, while Section 5.2 assesses results with respect to model parametrization, and Section5.3is concerned with an evaluation of the model application context.
4 Results
Driven by the outlined application and evalua-tion methodology, the proposed Grid accounting model for DVOs is applied to the determined multi-domain Grid accounting scenario. This is achieved by a full-cost calculation performed with input data from the LRZ.
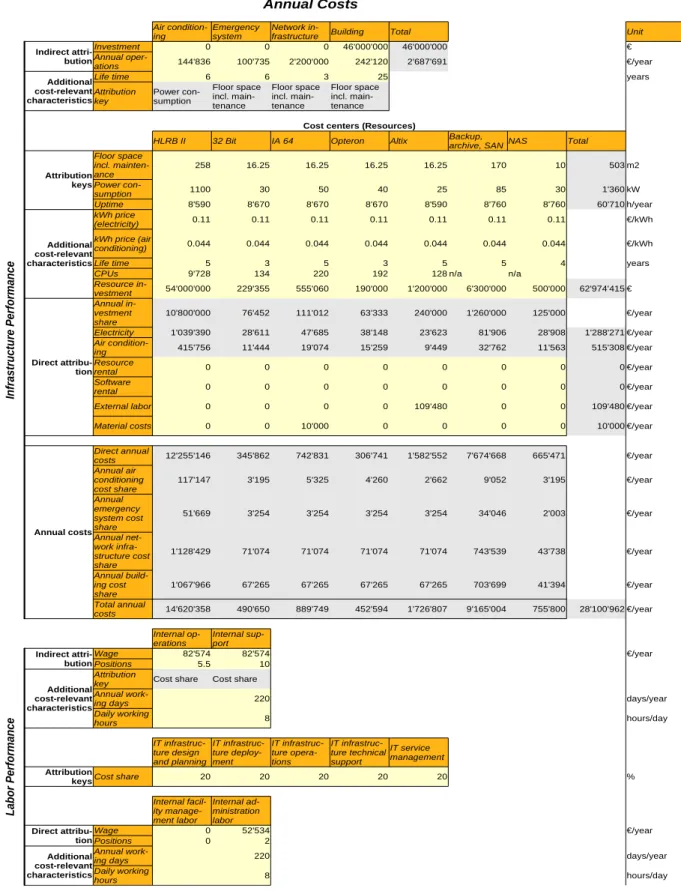
Figure 8 presents annual cost calculations which include indirect costs resulting from the
LRZ air conditioning system, the emergency system, its network infrastructure as well as build-ing costs. It needs to be stressed that initial in-vestments in the first three mentioned categories are subsumed in the initial investment amount of the LRZ building. Thus, a zero investment value for, e.g., the emergency system reflects the fact that these investment costs are not separately obtainable.
While those investment and annual operations infrastructure costs reflect indirect costs (II in Fig.7), Fig.8also depicts direct costs (I in Fig.7) such as material costs where applicable. Direct and indirect annual costs are attributed to the respective set of LRZ IT resources, consisting of computing infrastructure like the HLRB II cluster and of storage infrastructure such as NAS. These LRZ resources serve as cost centers (C in Fig.7) that need to bear annual costs of approximately 28 millione.
Furthermore, Fig.8visualizes annual costs with labor performance (B in Fig. 7). This covers in particular LRZ-specific information on number of positions, wages, working days, and working hours. It needs to be stressed, however, that these numbers are simplified target figures so that, in reality, differing numbers might apply. Addition-ally and similar to those zero investments reported for, e.g., the LRZ air conditioning system, figures for internal facility management labor are zero. This is due to the fact that facility management costs are included in the respective number for annual building operations. Annual facility man-agement labor costs—although being reported as zero here—and annual administration labor costs are directly attributed (IV in Fig. 7) to activities, whereas annual operations and support costs are assigned (III in Fig.7) to activities by means of an (equal) cost share of 20%.
Figure9focuses on activity-related cost calcu-lations (D in Fig. 7) of both considered activity cost types, average costs per activity and—with regard to non-standard activity configurations— quality-adjusted activity costs (E in Fig. 7). The calculation of average activity costs for activities of type Processing bases on the assumption that all LRZ computing resources show a capacity utiliza-tion of 80%. For the time being, the exact capacity utilization value is not measured at the LRZ so
that it needs to be estimated. A value of 80% de-termines a conservative estimation, since annual usage statistics at the LRZ show long queues of waiting jobs. These statistics are considered for all computing resources other than the HLRB II
cluster. This cluster has seen a major increase of nodes in 2007 from 4,096 to 9,728 CPUs—a fact which does not become apparent in the annual usage figures. In addition, annual statistics only ac-count for the aggregated uptime of so-called batch
nodes (a logic composite of currently 512 CPUs). Thus, annual statistics for the HLRB II cluster do not allow to estimate its capacity utilization level reliably. For that reason, the same level of 80% is assumed for HLRB II activities.
Average costs for Storage and Output activi-ties in Fig. 9determine estimated values. In the case of Storage, these values are estimated from previous LRZ experience. Output activities for vi-sualization of results represent external activities which are provided by VO2 (cf. Section 3.1.2).
The according activity costs constitute costs from the viewpoint of VO1 only, whereas from VO2’s
viewpoint, they constitute billed values. Billing information might not only cover VO2’s
produc-tion costs, i.e., it might not follow a strict cost-oriented pricing, but incorporate a pricing scheme which is profit maximizing. In addition, visual-ization services are run on highly specialized, expensive equipment. For these reasons, average Output activities costs are estimated to be higher than, e.g., internal computing activity costs.
Standard duration and capacity for Storage ac-tivities as well as standard CPU and main mem-ory numbers determine estimated values from LRZ experience, adopted to the presented Grid scenario. The according quality premium values cannot be substantiated at this time by specific sta-tistics on resource drivers and, thus, costs caused by providing non-standard resource configura-tions. Therefore, quality premiums are initially set to an assumed (low) percentage of 5%.
Figure 10 visualizes product cost calculations according to the service tree depicted in Fig. 6. These calculations multiply the respective activ-ity costs as outlined in Fig. 9 by the applica-ble accounted or billed units as described in Section 3.1.2 (scenario definition) and Section
3.2.3 (product calculation specifics). This results in monetary values representing costs incurred by each activity and, in sum, in total product costs of 4,656e. The virtual service VS1 in Fig.6relates
in this context to the product for which costs are calculated. Thus, in application of the outlined methodology of an activity-based, resource spe-cific, full cost-oriented Grid accounting model, this calculation determines those costs that need to be covered by each invocation of VS1. It needs
to be stressed that the resulting amount reflects
Fig. 10 Product cost calculation
costs, which are not to be mistaken for product pricing.
5 Discussion
Based on the evaluation objectives outlined in Section3.3, this section assesses the results gained from the Grid accounting model application by means of the presented cost calculation. This im-plies the results discussion regarding model func-tionality (cf. Section 5.1), possibilities of model parametrization (cf. Section5.2), and the accord-ing evaluation of the model application context (cf. Section5.3).
5.1 Model Functionality
Both, the methodology developed and the specific calculation performed reflect a high level of ex-pressiveness. This is particularly substantiated by
a most direct implementation of the set of key Grid accounting model characteristics: The cal-culation incorporates annual costs resulting from the relevant LRZ infrastructure and IT resources, which act as a cost center from an (economic) accounting viewpoint. This principle of resource-specific calculations is continued by the definition of resource-adapted activities. These activities are not only resource-specific, but support another important model characteristic as they are quality-aware. The introduced quality premium approach allows for configuring non-standard offers accord-ing to user demand—while still beaccord-ing able to express increased resource usage or even losses incurred by resources that might not be attribut-able to other users even though they are not used by the initial user. For instance, main memory for a node of the HLRB II cluster may be limited for one user to 2 GByte. The remaining 2 GByte (4 GByte is standard per node), however, will not be available for another user. In that light, the existence of a quality premium seems appropriate. In a similar way, the calculation has proven the Grid accounting model’s theoretical nature of being highly parameterizable and, thus, be-ing flexible, extensible, and generically applica-ble. Flexibility is reflected exemplary by a high degree of freedom to define input parameters, such as attribution keys. Extensibility is visualized by the example of freely configurable standard activities and quality adjustments. General ap-plicability is substantiated exemplary by the fact that costs related to Transferring—as one of those four basic service constituent parts of the origi-nal Grid accounting model—could be handled as an element of TCAS for pragmatic LRZ-specific reasons, even though Transferring activities were foreseen initially to constitute a central element in the ABC part of the calculation.
The developed methodology and the appro-priately determined calculation are found to first integrate successfully the respective viewpoints of technical and economic accounting. Secondly, they show that the Grid accounting model’s ex-pressiveness finds implementation in a practically viable way to determine product costs for multi-domain Grid service scenarios. For the consid-ered scenario, product costs of 4,656 e were calculated, out of which a share of 34% resulted
from Processing costs, a comparably high share of 36% from Storage costs, a 4% share from Output costs, and a 26% share from Other costs. At first glance, costs of 4,656 e per service instantiation might seem to be relatively high. However, the cost/performance ratio has to be considered in relation to the respective field of application (e.g., consider an automotive manufacturer within a fully commercial environment).
Although the calculation demonstrates a suc-cessful Grid accounting model applicability in general, it sees potential for further improve-ments. For instance, it does not consider load bal-ancing aspects which might be of high impact for a supercomputing environment. Similarly, the cal-culation as it stands needs to consider costs caused by unused but not attributable resources in a more fine-granular way. This means that the concept of quality premiums needs to be extended in order to better support competition for resources.
Furthermore, the calculation has revealed that the proposed Grid accounting model is in its appli-cation to a real-world environment like the LRZ not fully transparent for a model user. In-depth knowledge, both about the model itself as well as the underlying infrastructure and service parame-ters is still needed. Thus, model and calculation should be extended to define, e.g., the generally applicable, relevant set of technical accounting metering points.
In order to conclude, the calculation is found to provide valuable results in product cost de-termination by implementing the generic Grid accounting model in its full expressiveness and successfully applying it to a real-world environ-ment. However, model application requires at this time considerable effort in configuring and para-metrizing the calculation.
5.2 Model Parametrization
As the Grid accounting model was applied to a real-world environment for the first time, a num-ber of calculation parameters were required to be estimated. Other parameters, such as those mentioned as Transferring costs, could not be me-tered in a way that would have allowed for data usage as initially intended by the model. Despite such practical concerns, the resulting calculation
is found to constitute an extensive and effective model application case. In the case that assump-tions were taken, these could be either estimated from past LRZ experience or they were clearly termed as assumptions.
In the light that some calculation parameters were estimated or assumed, a sensitivity analysis of key parameter changes helps to assess one parameter’s change impact to the overall prod-uct cost calculation. Figure 11 documents the respective percental change in product costs of (initially) 4,656e if one calculation input parame-ter is changed by 10% of its value, ceparame-teris paribus, meaning that all other parameters are left un-changed. Most caused changes are assessed mar-ginal with an impact on product costs of less than 0.1%. However, there is a considerable impact on product costs in some areas. The top five impact areas are identified as follows: Changes of 10% on Backup, archive, SAN parameters of either aver-age costs per activity, standard duration activity, or standard capacity activity result in a change in product costs in the range of 2.6–2.8%. In other words, these parameter changes are leveraged by about a fourth. The second most important product cost change (in the range of 1.5–1.7%) is observed when selected parameter values for the Altix cluster are altered by 10%. Changes on wage or position values for internal support labor fall into a comparable class of relative impact, namely of 1.6%. The third largest leverage effect show selected parameter changes for the IA 64 cluster, closely followed by effects incurred by parameter changes in the area of internal operations labor. The fifth largest impact on product costs show parameter changes for the NAS infrastructure, such as for average costs per activity (in the range of 0.7–0.8%).
It has to be stressed that these sensitivity analy-ses conducted cannot provide completely unbi-ased insight with respect to product cost impact due to inherent dependencies on the chosen sce-nario. For instance, any change on input para-meters in relation to the 32 Bit cluster will not show any effect on product costs here, since this infrastructure is not considered to be used in the applicable scenario. Nevertheless, these sen-sitivity analyses allow to identify parameter val-ues of particular importance which need careful
Fig. 11 Percental impact on product costs of a 10% calcu-lation input parameter change
inspection—especially in case such a parameter was assumed or estimated as it is the case, e.g., for the average costs per activity for Backup, archive, SAN. Thus, this calculation cannot only be helpful for product cost calculations, but it can serve as an instrument for optimizations.
5.3 Model Application Context
The developed methodology and the resulting cal-culation both document that the Grid accounting model was successfully applied to existing LRZ infrastructure. The chosen scenario, however, in-corporates specifics that do not reflect current LRZ characteristics. Most prominently, the LRZ does not offer at present a virtual service similar to VS1. Neither are virtualized resources made
available as Grid services in a multi-domain en-vironment. For such reasons, the scenario chosen needs to be deemed to be of a partially artificial nature. In the same manner as those previously mentioned practical limitations of partially lack-ing technical accountlack-ing meterlack-ing data, this bears a risk to lower overall calculation significance. Thus, a sensitivity analysis of scenario parameter value changes is of particular interest.
![Table 1 Evaluation of existing systems (+ “Yes”, (+) “In parts”, – “No”, n.s “Not Specified”) [15]](https://thumb-eu.123doks.com/thumbv2/123doknet/14862117.635703/4.820.78.752.103.569/table-evaluation-existing-systems-yes-parts-n-specified.webp)
![Fig. 2 Formal representation of the service model [11]](https://thumb-eu.123doks.com/thumbv2/123doknet/14862117.635703/5.820.68.396.634.973/fig-formal-representation-service-model.webp)
![Fig. 3 Accountable units overview [15]](https://thumb-eu.123doks.com/thumbv2/123doknet/14862117.635703/6.820.68.398.694.956/fig-accountable-units-overview.webp)