What Does it Take to Sell Environmental Policy?
An Empirical Analysis of Referendum Data
DANIEL HALBHEER1, SARAH NIGGLI1 and ARMIN SCHMUTZLER1,2,3,*
1
Socioeconomic Institute, University of Zurich, Blu¨mlisalpstr. 10, CH-8006, Zurich, Switzer-land; 2CEPR, London, UK;3ENCORE, University of Amsterdam, Netherlands; *Author for correspondence (e-mail: arminsch@soi.unizh.ch)
Accepted 27 October 2005
Abstract. We analyze the factors that influence the support for environmental policy pro-posals. Swiss referendum data show that proposals obtain more yes-votes if they do not restrict consumption possibilities directly, if they are endorsed by the largest business asso-ciation, if environmental preferences are strong and economic conditions are favorable at the time of the referendum. Also, there are more pro-environmental votes in cantons with higher population density. On the other hand, yes-votes do not seem to depend on whether a pro-posal involves a tax or not.
Key words: direct democracy, environmental policy, public choice, referendum JEL Classification: P16, Q28
1. Introduction
Even though research on environmental policy instruments is still mostly normative, positive approaches are gaining importance. Since the seminal contribution by Buchanan and Tullock (1975), theoretical arguments have often been used to understand why some policy instruments are applied more often than others. In particular, many authors have attempted to explain why market instruments have been used less frequently than command-and-con-trol regulation.1 In addition, some papers deal with the conditions fostering the introduction of environmental policy in general, and green taxes in particular.2
Even though the positive theory of environmental policy dates back to the 1970s, empirical work is scarce. Only a few papers analyze voting behavior in environmental ballots (Deacon and Shapiro 1975; Fischel 1979; Kahn and Matsusaka 1997; Thalmann 2004).3
Like these authors, we use referendum data to analyze which factors increase the electoral support for environmental policy in a direct democracy.
We consider 45 environmental referenda that took place in Switzerland between 1977 and 2003. About half of these concerned transportation issues; the others dealt with energy policy, landscape conservation and agriculture. We start from the following set of hypotheses.
(H1) The smaller the negative effects of a proposal on individual consumption possibilities, the more yes-votes it will receive.
(H2) Proposals that tax consumers receive less yes-votes than proposals that prohibit certain consumption activities.
(H3) The higher the share of voters with strong pro-environmental preferences at the time when a decision on a proposal was made, the more yes-votes it will receive.
(H4) The better the economic conditions at the time when a decision on a proposal was made, the more yes-votes it will receive.
(H5) The greater the positive effects of a proposal on the environment, the more yes-votes it will receive.
In the working paper (Halbheer et al. 2003), we derive most of these hypotheses from a simple formal model where voters consider the costs and benefits of policies, but as the hypotheses are sufficiently intuitive, we refrain from such a derivation in this paper. (H1), (H3) and (H5) are the most direct reflections of the idea that voters consider costs and benefits of a proposal. (H4) requires an additional normality assumption on environmental goods. (H2) is suggested by the widespread idea that command-and-control regu-lation has more political support than environmental taxes.4
We test (H1)–(H4) by relating the percentage of yes-votes in a particular canton in a particular referendum to a number of explanatory variables chosen with the above hypotheses in mind.
As there are no simple and generally accepted techniques to measure the effects of environmental proposals on consumption, we use dummy variables to test (H1). We distinguish between three types of costs that a voter might associate with an environmental proposal. First, some proposals directly reduce consumer sovereignty by making it impossible to pursue a particular consumption activity. Obvious candidates are driving prohibitions on certain days or proposals to abandon highway projects.5 Second, some proposals involve tax increases. Most obviously, this is true when a proposal contains environmental taxes. In addition, public projects such as measures to improve railway transportation may be perceived as implying tax increases, because they require financing.6Third, a project might influence consumption opportunities by affecting economic conditions more generally. If an envi-ronmental proposal is expected to inhibit economic growth, for instance, by inducing relocation of industries to other countries, it is less likely to be accepted, other things being equal. To identify such proposals, we use the
official voting recommendations of the largest business association: When this organization does not endorse a project, we take this as a negative sign for the overall economic impact. Summing up, our empirical model distin-guishes between three different types of cost variables: Consumer sovereignty dummiescapturing direct restrictions on consumer choice, tax dummies and a general economic impact dummy. This dummy approach also allows us to test (H2), which suggests that, other things equal, taxation should have stronger negative effects on pro-environmental votes than a restriction of consumer sovereignty.
We approach (H3) by including a variable measuring the importance that society puts on environmental problems. This variable can be obtained from a yearly survey in which Swiss citizens are asked which political issues they consider as important. Finally, to test (H4), we use the temporal and regional variation in economic growth and unemployment.
As we have not been able to construct a meaningful variable to measure the impact of a proposal on the environment, we make no attempt to test (H5) directly. However, we can obtain at least some evidence on the relation between environmental effects and yes-votes by exploiting the variation in cantonal population density. A higher population density is likely to corre-spond to greater environmental problems, which suggests that the potential benefits of environmental improvements in such areas are perceived as par-ticularly high. We should thus expect more yes-votes in densely populated areas. However, such a relation might also reflect higher economic costs of environmental measures in rural areas. In particular, the adverse effects of restrictive policies towards private road transportation are likely to be per-ceived as higher by the inhabitants of rural areas than by city residents. Either way, cost-benefit considerations would suggest more pro-environ-mental votes in densely populated areas.
The main results of our empirical analysis are as follows. First, the con-sumer sovereignty variables have strong and highly significant effects on the percentage of yes-votes. This suggests that proposals involving no direct restriction on consumer sovereignty have much better chances of being accepted than measures that restrict choices. Second, projects with positive ‘‘general economic impact’’ receive more yes-votes. Third, in times when environmental problems are considered to be important, environmental proposals meet with high support. In this sense, stated preferences corre-spond to those revealed through voting behavior in the ballots. Fourth, regional differences in voting behavior are closely related to characteristics that would suggest differences in preferences for the environment: Population density has a highly significant positive effect on acceptance chances.
Our approach differs from the above-mentioned empirical literature in several ways. For instance, Kahn and Matsusaka (1997) study 16 ballots in
California. However, unlike our study, they do not deal with the effects of properties of the proposal on its acceptance chances. Instead, they are mainly concerned with the effects of voter characteristics on their behavior. Like our approach, however, they start from the idea that individuals weigh the costs and benefits when they decide on environmental proposals.7
Thalmann (2004) deals with three energy-tax referenda that took place in Switzerland in September 2000.8 Like Kahn and Matsusaka, Thalmann focusses on the relation between voter characteristics and their behavior in the ballots, though he also asks how characteristics of the proposal such as the type of revenue recycling influence voter behavior. In contrast to Thalmann, our study is silent about the effects of voter characteristics on their behavior. However, because of the relatively large number of dif-ferent proposals in our sample, we can say more about the relationship between the characteristics of the proposal and the electoral support it receives.
Our analysis is also related to a study by Vatter et al. (2000) who analyzes voter behavior in 27 Swiss referenda on transportation issues. Most of these referenda are included in our data set. However, our analysis differs in several respects. First, we deleted some transportation proposals without direct environmental repercussions. Second, we added referenda on environmental issues not directly related to transportation (energy policy, landscape pres-ervation and agriculture). Third, most importantly, our approach is moti-vated by economic analysis. We attempt to rely exclusively on variables that relate directly to the contents of the proposal or to environmental preferences and the state of the economy at the time of the referendum. In contrast, Vatter et al. come from a political science perspective. Their explanatory variables and hence their results have very little in common with the ones we use.9
Our approach of employing a linear model to understand which factors increase the percentage of yes-votes of some environmental proposals may seem unusual. The potential difficulty arises from the fact that this model can give a percentage of yes-votes outside the interval [0,100]. However, we will substantiate below that this problem is not severe under the specific cir-cumstances. Other authors who study voting behavior in environmental ballots employ binary-choice models.10 Such binary-choice models are par-ticularly appropriate when individual data are used to understand how voter characteristics influence voter behavior, while we use aggregate data to understand how characteristics of proposals influence the support they receive instead.11
The paper is organized as follows. Section 2 presents the econometric model. Section 3 describes the data. In Section 4, we give some descriptive statistics. In Section 5, we present the regression results. Section 6 concludes.
2. The Econometric Approach
We use the following model to test (H1)–(H4). We assume that the percentage of yes-votes of some environmental proposals depends on a set of control variables and an unobservable error. Further, we assume that the model is linear in parameters and that the error has mean zero and is uncorrelated with each of the control variables. With the above hypothesis in mind, we partition the control variables in cost variables, variables representing environmental preferences and covariates reflecting the economic conditions. We further introduce other variables capturing cantonal heterogeneity and a peculiarity of the Swiss voting system. Though we consider only national referenda, we employ data on votes at the cantonal level for each referendum.
2.1. COST VARIABLES
We introduce consumer sovereignty dummies, tax dummies and a general economic impact dummy to reflect the costs of a proposal.
Consumer Sovereignty Dummies. We distinguish between three types of proposals. First, there are proposals that restrict particular types of con-sumption activities directly (for instance, by prohibiting to drive on certain days or by abandoning particular highway projects). Second, there are ‘‘neutral’’ proposals that do not directly restrict any particular consumption activity (such as a moratorium on nuclear power or a general program to support energy efficiency).12 Third, there are proposals that involve an extension of certain consumption activities (such as public transport).
To distinguish between these three possibilities, we introduce two con-sumer sovereignty dummies. The first dummy, CS0, takes on a value of 1 if the proposal is neutral with respect to consumption possibilities, whereas the second dummy, CS+, takes on a value of 1 if the proposal extends con-sumption possibilities.
Tax Dummies. Again, we distinguish between three classes of proposals. First, there are proposals that we associate with higher taxes. Some of these proposals contain taxes on certain activities carried out by typical voters (highway usage, energy consumption). The remaining proposals in this group involve public projects which have to be financed in some fashion, for instance via tax increases. Second, we classified some proposals as tax-neutral. Obvious examples include driving restrictions on certain days or restrictions on landscape usage. Third, some environmental proposals tend to reduce the need for taxes. If the proposal is: ‘‘ Do not build a motorway from A to B’’, tax payers’ money is saved.13 To distinguish between the three types of proposals, we introduce two dummy variables: TAX0takes on a value of 1 if a proposal is neutral with respect to taxation, TAX+takes on a value of 1 if a proposal is associated with lower taxes.14
General Economic Impact Dummy. To measure the general economic impact of a proposal, we use the recommendation given by economiesuisse, the largest business association in Switzerland.15If the association supports a proposal, we take this as a sign of a positive economic impact.16 Thus, we include a dummy BS, where BS=1 indicates that the project is backed by economiesuisse.17
2.2. ENVIRONMENTAL PREFERENCES AND ECONOMIC PARAMETERS
To account for environmental preferences and for the economic conditions at the time of the referendum we introduce further variables.
Environmental Preferences. To capture possible exogenous variation in environmental preferences, we introduce a variable that describes the per-centage of the population with voting power that considers environmental problems as important. This variable, denoted ENV, relies on a survey that is carried out annually by the research institute GfS.18 For recent years, the results of this survey were obtained from various issues of Sorgenbarometer, a publication by Credit Suisse.19
National Income. The growth rate of real cantonal income in the year before the referendum is included and denoted by GROWTH.20
Unemployment. Similarly, we include the cantonal unemployment rate denoted by UNEMP.21,22
There is potentially a multi-collinearity issue: As the environmental con-cern might depend on economic conditions, one should worry that envi-ronmental preferences might be correlated with income and unemployment. As detailed below, in most variants of our model (Model 2–4), we therefore consider only one or two of the variables introduced here.
2.3. OTHER VARIABLES
We finally introduce two variables to capture regional heterogeneity and a peculiarity of the Swiss system.
Cantonal Population Density. Rather than including a cantonal dummy, we used a more informative variable, namely the cantonal population density denoted PD, to capture regional effects.23 For each canton, we fixed these variables at one level (1997), which is justified as the temporal variation is negligible compared to the regional variation.
The Counterproposal Dummy. Our last variable is included to account for the legal form of the referendum. In four cases, referenda on a proposal and a – typically more moderate – counterproposal take place on the same day. We introduced a counterproposal dummy CP to characterize the latter kind of proposal.
3. Data
3.1. OVERVIEW
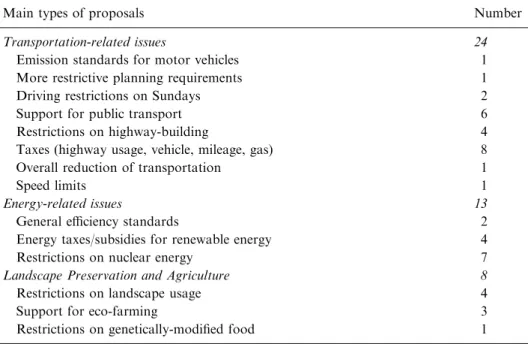
Our analysis uses data on 45 Swiss referenda on environmental issues that took place between 1977 and 2003. The starting point of this period was determined by data availability, and there have been no referenda that touch upon environmental considerations since 2003. Table I gives an overview over the types of proposals in our sample. Twenty four proposals addressed transportation issues, 13 dealt with energy policy, and 8 concerned landscape preservation and agriculture.
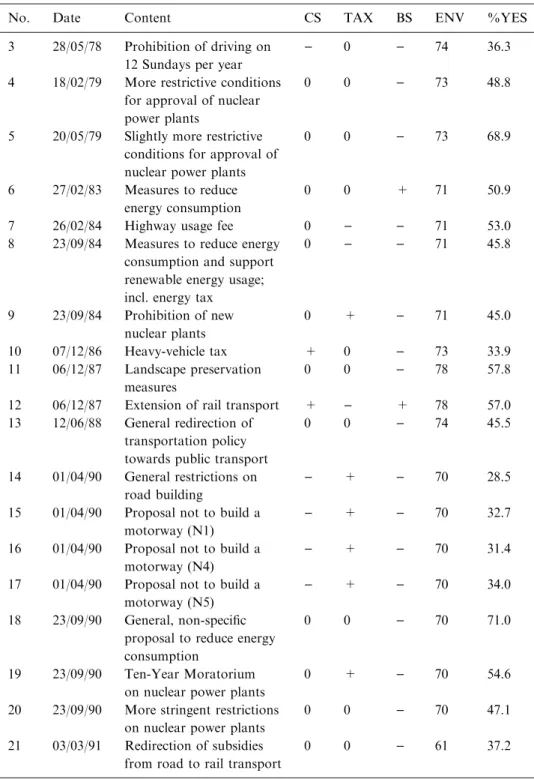
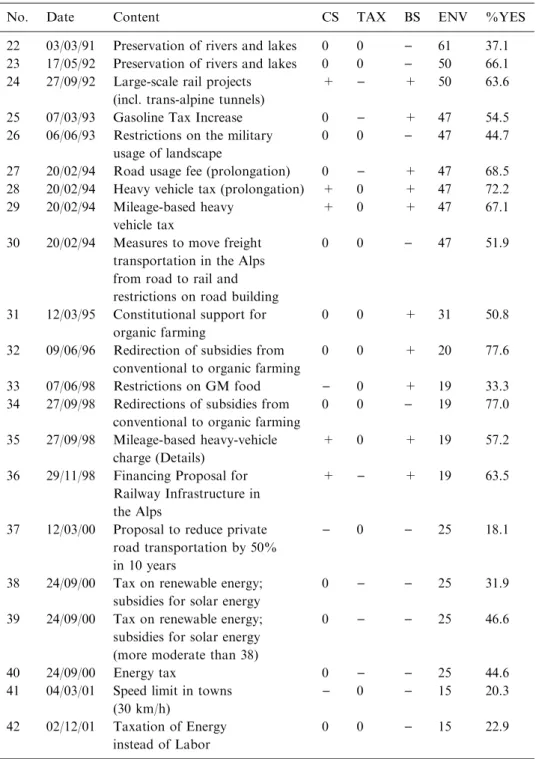
Table A.I in the appendix contains more detailed information about the sample. The column ‘‘%YES’’ gives the percentage of yes-votes for each referendum. This information comes from the official homepage of the Federal Authorities of the Swiss Confederation.
In addition, the table shows the main explanatory variables. Except for BS, the voting recommendations of the business association economiesuisse (and its predecessor, Vorort), we had to codify the variables ourselves.24For the transportation policy proposals, we relied heavily on information com-piled by Vatter et al. (2000). In all other cases, we used various data sources, for example, major Swiss newspapers (Neue Zu¨rcher Zeitung, Tages-Anzei-ger) and the official homepage of the Federal Authorities of the Swiss Confederation. In the next subsection, we shall explain our choices.
Table I. Breakdown of proposals by type
Main types of proposals Number Transportation-related issues 24
Emission standards for motor vehicles 1 More restrictive planning requirements 1 Driving restrictions on Sundays 2 Support for public transport 6 Restrictions on highway-building 4 Taxes (highway usage, vehicle, mileage, gas) 8 Overall reduction of transportation 1
Speed limits 1
Energy-related issues 13
General efficiency standards 2 Energy taxes/subsidies for renewable energy 4 Restrictions on nuclear energy 7 Landscape Preservation and Agriculture 8 Restrictions on landscape usage 4
Support for eco-farming 3
The column ‘‘CS ’’ refers to consumer sovereignty: The sign ‘‘)’’ corre-sponds to proposals with a direct negative impact on a particular activity (CS+=0; CS0=0); ‘‘0’’ corresponds to proposals with no direct impact (CS+=0; CS0=1); ‘‘+’’ corresponds to proposals with a positive impact (CS+=1; CS0=0). The notation in column ‘‘TAX’’ has an analogous interpretation.25In the column ‘‘BS’’ (business support), a ‘‘+’’ corresponds to proposals that were endorsed by economiesuisse and its predecessors (BS=1); a minus corresponds to proposals that were not backed. In the column ‘‘ENV’’, we gave the value of our measure of environmental pref-erences when the vote took place.
3.2. CODIFICATION DECISIONS
We briefly comment on our codification decisions regarding consumer sov-ereignty and taxes. The variable CS was codified ‘‘)’’ for the following examples: (i) driving prohibitions on Sundays, (ii) proposals to abandon specific road projects or reduce road building in general and (iii) for restrictions on genetically modified food. The value ‘‘0’’ was given to the following types of proposals: (i) measures aiming at reduction of energy consumption in general, and nuclear energy in particular, (ii) landscape preservation measures, (iii) general procedural proposals26and (iv) proposals that involved expansions in one activity at the expense of another one.27 Finally, the ‘‘+’’ codification was given to proposals that (i) improve public transport or (ii) tax heavy vehicles. The latter choice is justified by the per-spective of the vast majority of voters who benefit from less freight trans-portation on roads, as this allows them to move more freely on roads. Next, consider the TAX variable. A ‘‘)’’ was given to (i) most tax proposals and (ii) concrete proposals to extend public transportation. The group where the variable TAX takes value ‘‘0’’ contains the following types of proposals: (i) proposals which neither involve taxes nor subsidies (e.g., driving restrictions on certain days, speed limits), (ii) proposals where subsidies are to be real-located between activities (conventional to organic farming, road to rail), (iii) general procedural changes28, and (iv) heavy vehicle taxes.
The last decision was made because such taxes are not paid directly by the typical voters.
4. Descriptive Statistics
4.1. YES-VOTES
Panel (i) of Figure 1 gives the percentage of yes-votes for each of the 45 ballots at the national level, in the order in which the referenda took place. Two features are interesting. First, there is considerable fluctuation in the
data. Second, casual inspection of the figure suggests an inverted U-shape for the yes-votes. In the time period during which the first 35 elections took place (1977–1998), there seems to be an upward trend. After that, there is a considerable decline: None of the last nine proposals reached the 50% level.
4.2. ENVIRONMENTAL PREFERENCES AND ECONOMIC PARAMETERS
Panels (ii)–(iv) of Figure 1 collect information on the development of eco-nomic parameters and environmental preferences. Panel (ii) shows that the percentage of Swiss citizens who were eligible to vote and considered envi-ronmental problems an important topic was between 70 and 80% until the late 1980s. A decade later, this percentage had fallen to about 20%. Panels (iii) and (iv) give the growth rate of real national income and the unem-ployment rate at the national level.29 These figures clearly suggest a close relation between deteriorating economic conditions and the decreasing environmental awareness. Yes-Votes Proposal Number (i) Percent 100 80 60 40 20 0 5 1 10 15 20 25 30 35 40 45 Environmental Preferences Year (ii) 1977 1982 1987 1992 1997 2002
Growth Rate of Real National Income
Year (iii) Percent -2 0 2 4 1976 1981 1986 1991 1996 2001 Unemployment Rate Year (iv) Percent 01 2 3 4 5 6 1976 1981 1986 1991 1996 2001 Percent 100 80 60 40 20 0
Figure 1. Acceptance rates, environmental preferences and the two indicators reflecting economic conditions at the national level.
4.3. COST VARIABLES
Table II concerns the cost variables CS, TAX and BS. It summarizes the frequencies with which each type of codification occurred. For instance, there are 19 proposals with neutral consumption and tax effect (3 of which receive business support, whereas 16 do not). The entries labeled ‘‘tax totals’’ give the number of proposals with a particular tax effect (e.g., there are 7 tax-neutral proposals with business support and 21 tax-tax-neutral proposals that are not backed by the business association). The entries in the column ‘‘con-sumption totals’’ have an analogous interpretation.
Note that there is considerable variation in the combinations of codifi-cations that arise: 11 different combinations arise at least once; only one combination arises more than five times.
5. Econometric Results
5.1. OVERVIEW
This section summarizes the regression results. First, we present four variants of the model described above, which differ only with respect to which inde-pendent variables we included. We then sketch some robustness consider-ations.
All of our four main models include the consumption dummies CS0 and CS+, the tax dummies TAX0and TAX+, the business support variable BS, the population density PD and the counterproposal dummy CP.
However, the four models differ with respect to whether the environmental preference variable is included, as well as with respect to the economic parameters considered. Model 1 contains the environmental preference var-iable ENV as well as the real growth rates GROWTH and the unemployment rates UNEMP at the cantonal level. We included this model in spite of strong concerns that multi-collinearity makes the results hard to interpret. Because these concerns appear justified, the remaining models restrict attention to a
Table II. Breakdown of proposals with business support by consumption and tax effect (entries in brackets categorize proposals without business support)
Cons. effect Tax effect
+ 0 ) Consumption totals + 0 (0) 3 (1) 3 (0) 6 (1) 0 0 (3) 3 (16) 2 (5) 5 (24) ) 0 (4) 1 (4) 0 (0) 1 (8) Tax totals 0 (7) 7 (21) 5 (5) 12 (33)
subset of these parameters. Model 2 considers only the environmental pref-erence variable ENV. In Model 3, we use the economic parameters GROWTH and UNEMP, as one might expect environmental preferences to be closely related to these economic quantities. Model 4 is similar, except that it uses the change in the unemployment rate in the preceding year, DUN-EMP, instead of unemployment rate itself.
5.2. THE MAIN RESULTS
Estimation results are reported in Table III. In all four models, the consumer sovereignty variables CS0and CS+have positive effects, and these effects are significant at the 1% level. The interpretation is straightforward. Voters (in their role as consumers) resent proposals that involve a direct restriction in
Table III. OLS estimation results employing cantonal data. Dependent variable is percentage of yes-votes
Variable Model 1 Model 2 Model 3 Model 4 CONST 8.1057*** 11.3996*** 23.9762*** 23.3137*** (1.6496) (1.4364) (1.4444) (1.4201) CS0 13.2427*** 13.7055*** 16.9702*** 16.5989*** (0.9848) (0.9774) (1.0542) (1.0631) CS+ 12.1454*** 12.7416*** 17.2919*** 16.1651*** (1.4297) (1.4320) (1.5349) (1.5606) TAX0 )1.1027 )0.7555 0.2531 )0.8851 (0.8808) (0.8797) (0.9664) (0.9791) TAX+ )0.8666 )0.4738 3.6228** 2.0743 (1.3379) (1.3348) (1.4415) (1.4865) BS 21.0829*** 22.4538*** 20.5224*** 17.1020*** (1.0751) (1.0250) (1.1845) (1.1477) ENV 0.3173*** 0.2687*** (0.0200) (0.0165) GROWTH )0.0418 0.1239 0.4957*** (0.1279) (0.1405) (0.1425) UNEMP 1.0994*** )1.2427*** (0.2683) (0.2467) DUNEMP 2.6136*** (0.5393) PD 0.0028*** 0.0031*** 0.0034*** 0.0030*** (0.0003) (0.0003) (0.0004) (0.0004) CP 16.8738*** 16.2826*** 11.3915*** 11.0258*** (1.0586) (1.0346) (1.1028) (1.1058) Multiple R2 0.5528 0.5460 0.4561 0.4552 Notes: 1,170 observations in all specifications; * = Significant at the 10% level; ** = Sig-nificant at the 5% level; *** = SigSig-nificant at the 1% level. Standard errors in parenthesis.
their freedom to choose certain consumption activities. On the other hand, there is no substantial difference in the percentage of yes-votes of projects that have no direct effects on consumer sovereignty and projects that expand it.
Also, the ‘‘general economic impact’’ captured by the business support variable BS is as expected: Proposals with business support received signifi-cantly more yes-votes (in all four models, this effect is significant at the 1% level). An interpretation along the lines sketched in the introduction would work as follows. If a project has the support of the business association, this is not necessarily only so because it caters to special interests: There may well be at least a positive correlation between business interests and general consumer interests. Put differently, if an environmental proposal has adverse economic effects, so that the business association recommends voting against it, some consumers may follow this recommendation for fear of negative effects on their own consumption, job situation, etc.
There is, however, another interpretation: The business association rep-resents the opinions of a particular group of voters (in particular, managers, owners and, to some extent, workers in firms). In this sense, saying that a project has business support amounts to very much the same as saying that there is a non-negligible subset of voters that is likely to vote for a measure. Other things equal, proposals that are supported by some groups of society should receive more yes-votes. Nevertheless, this interpretation is not as convincing as it may seem. If it were true, it should also hold with respect to other important groups in society. We checked this by investigating the Social Democratic Party (SP) that usually obtains between 20 and 30% of the votes in parliamentary elections. It turns out that the SP supported virtually all environmental proposals: Therefore, the SP recommendation bears essentially no informational value about a proposal’s chances of success. Thus, our alternative explanation of the impact of the business recommen-dation may not be all that misleading.
The population density also confirms the expectations in all models. A higher population density leads to a greater percentage of yes-votes (again, these effects are significant at the 1% level in all four models). For instance, the effect of increasing the population density by 100 inhabitants per square kilometer on yes-votes is estimated to lie between 0.28% (Model 1) and 0.34% (Model 4). To repeat, this is consistent with a cost-benefit perspective: In cantons where population density is high, the benefits of most environmental proposals are relatively high and the costs are likely to be relatively low.
The tax variables TAX0 and TAX+ are usually insignificant. In cases where the proposal itself is a tax this presumably reflects the fact that the tax levels are typically not very high. In cases where the proposal is framed as support for some public project, consumers may simply not be fully aware of the relation between the project and possible tax increases.
The counterproposal dummy CP has a highly significant positive effect. This is entirely plausible, because counterproposals are typically more moderate than the original proposals.
Finally, we consider the variables relating to environmental preferences and economic boundary conditions. In Model 1, the effect of ENV has the expected positive sign and is significant. Surprisingly, GROWTH has a negative effect on the percentage of yes-votes, but this effect is not significant. The effect of UNEMP is positive and highly significant. We believe that these counterintuitive effects reflect the fact that there are too many explanatory variables in the model. Therefore, we now consider the remaining models.
Model 2, which contains only ENV, gives the expected result: The effect of increasing environmental awareness is positive and highly significant. Spe-cifically, a 10% increase in environmental awareness raises the percentage of yes-votes by 2.7%.
Model 3, which contains GROWTH and UNEMP instead of ENV also yields plausible results: The unemployment rate has a significant negative effect on yes-votes. The effect of a higher growth rates is positive, but not significant.
Model 4 is like Model 3, except that DUNEMP was chosen instead of UNEMP. Here, the effect of higher growth is positive and highly significant. Surprisingly, DUNEMP has a positive and highly significant effects on yes-votes. Figure 1 suggests why this might be so. First, except for a very short period around 1990, when unemployment increased dramatically, the unemployment rate was roughly constant. Second, the critical period also happened to be a time during which many referenda took place, which also received many yes-votes. Taking this together, it seems that the counterin-tuitive effect of increasing unemployment simply reflect sluggish adjustment of actual voting behavior to the changes in economic conditions.30
It is also worth taking a brief look at the constant term. In particular, we chose our independent variables in Model 2 so that values of zero for these variables correspond to the worst case for the acceptance chances of the referendum. The value of 11.4 for the constant term can thus be interpreted as the percentage of voters in regions where the population density is close to zero who vote for environmental proposals even when their contents and the economic parameters at the time of the referendum make a yes-vote partic-ularly unattractive.
5.3. ROBUSTNESS
We now discuss several critical issues that one might raise about our analysis. In each case, we briefly report some related regression results suggesting that our original analysis is not misleading.
5.3.1. Linearity
We related the percentage of yes-votes in a canton in a particular referendum to a set of control variables using a model that is linear in its parameters. Obviously, the predicted percentage of yes-votes obtained in this fashion could, in principle, lie outside the interval [0,100] if the independent variables take extreme values. A closer look at our regressions already suggests that this problem is not severe under the specific circumstances. Consider Model 2, for example. As discussed earlier, the minimum value for each independent variable is 0, which is also the worst case for acceptance chances. The con-stant, which was estimated as 11.4, is thus a lower bound for the percentage of yes-votes. On the other hand, take very favorable conditions for accep-tance: Consider a counterproposal that has business support and does not restrict consumer sovereignty, at a time where environmental preferences are at the maximum (78%), in a densely-populated canton (Canton of Zurich). Even in this case, our estimation predicts an acceptance rate in the region of 86%, which is well within the allowable range.
Even so, one might prefer using an alternative approach, for instance, by writing the percentage of yes-votes as observed logits (that is, the natural logarithm of the observed odds ratio) and regressing them on the same set of explanatory variables. Re-estimating our model in this fashion led to similar results. In particular, the sign of each coefficient was unaltered and the sig-nificant variables in each model were the same.
5.3.2. Heterogeneity of proposals
Another potential problem concerns the heterogeneity of proposals in the sample. In particular, the wide variety of topics addressed in the referenda which is only partly reflected in our explanatory variables might lead to worries about the potential influence of omitted variables. We dealt with this issue by carrying out our regressions only for the transportation proposals, which should reduce the heterogeneity problems. In a qualitative sense, the results, which are not reported here, are similar: The signs of the coefficients essentially remain the same, and even the quantitative differences in the values of the coefficients are not extremely large.
5.3.3. Cantonal data
We carried out a nation-wide regression with cantonal observations as data points. Alternatively, we could have considered regressions where all obser-vations refer to the same geographical unit, for instance, the nation or one of the 26 cantons. Including results from different cantons in one regression is useful, because it allows us to investigate the effects of cantonal differences in
the explanatory variables on the outcome of the referendum. On the other hand, the independence assumption on error terms becomes problematic as geographical units cannot be assumed to be independent draws from a large population. Even though we control for differences in population density, it is still possible that specific cantonal effects influence the outcomes of dif-ferent referenda in similar ways.
Therefore, we also carried out one regression with only national variables. By and large, the results are similar.31
6. Conclusions
This paper has identified determinants of success for environmental policy, using referendum data for Swiss cantons. Two cost variables have pro-nounced negative effects: Restrictions on consumer sovereignty and a nega-tive ‘‘general economic impact’’. The fact that a proposal contains a tax has no significant effects on voter behavior. Among the parameters describing the situation at the time of the referendum, the environmental preference parameter has the expected effect. An alternative setting without the envi-ronmental preference variable, but with unemployment and growth suggests that the unemployment effect on yes-votes is negative, whereas the growth effect is positive.
There are several caveats to our analysis. First, some potentially important variables have not been included. Most notably, there is no direct measure of the environmental impact of a proposal. However, the effects of population density at least suggest that yes-votes and positive environmental effects of proposals on the population are closely related. Second, the use of dummy variables in cases where cardinal variables would be desirable also means that influence factors that are relevant from an economic point of view are not analyzed in full detail. However, the fact that we obtain some explanatory value despite our crude independent variables is promising. Third, our analysis treats the policy proposals as exogenous variables. To some extent, however, they should depend on other variables of our model: For instance, when environmental concern is low, proposals are unlikely to be very ambitious. This effect suggests that our analysis is likely to underestimate the effects of environmental preferences.32 Fourth, the use of the recommenda-tion of the business associarecommenda-tion for the ‘‘ general economic impact’’ is worth mentioning: Though we believe that our interpretation of the variable is not entirely off the mark, we realize that this point is debatable.
Given the limitations of our approach, we hesitate to draw far-reaching conclusions. One important aspect seems to transpire, however. The widely held belief that market instruments find acceptance less easily than com-mand-and-control regulation must be taken with a grain of salt. At least when consumers decide about proposals to restrict emissions from
consumption, they are reluctant to accept a command-and-control regulation. Taxes seem to meet with less resistance.33 Strictly speaking, this observation is not in contradiction with standard political economy arguments that taxes face greater resistance than standards. First, we should emphasize that proposals with taxes include not only environmental taxes, but also subsi-dized public projects that are expected to lead to tax payments. Second, standard arguments usually refer to pollution by firms, whereas many of the investigated proposals deal with consumption emissions (mostly by motor-ists). Our analysis suggests that the political economy of consumption emissions may differ substantially from the political economy of production emissions. An alternative interpretation is also plausible: Casual observations suggest that, whereas some of the proposed command-and-control measures were massive interventions, the proposed taxes tended to be fairly low. Had voters been confronted with the typical textbook exercise of comparing a command-and-control measure with a tax with equivalent emission effects, they might have preferred command-and-control measures.
Finally, we would like to emphasize that our paper does not provide a normative analysis. In particular, the fact that certain types of command-and-control regulation seem to meet with more resistance than other instruments does not in itself mean that they should not be applied. In cases where alternative policy options are limited, it may well be a wise move to put such instruments on the political agenda, even at the risk of failure. Never-theless, our results remind us that it may be worth thinking very hard about the way in which environmental goals are targeted, not only for efficiency reasons: To sell environmental policy, it is important not to destroy the goodwill of the buyers.
Acknowledgements
We are grateful to Zava Aydemir, Dennis Ga¨rtner, Markus Ko¨nig, Hansjo¨rg Lehmann, Severin Pflu¨ger, Andreas Polk, Harald Telser and Peter Zweifel for helpful comments and suggestions. All remaining errors are ours.
Notes
1. Examples include Dewees (1983), Hahn (1990), Hahn and Noll (1990), Frey and Schneider (1997), Kirchga¨ssner and Schneider (2003). Dijkstra (1999) and Keohane et al. (2000) survey the literature.
2. See for instance Hahn (1990), Fredriksson (1997) and Polk and Schmutzler (2005). 3. Some authors have used questionnaires or casual empiricism to find out the preferences of
different groups with respect to abstract policy instruments. Examples include Dijkstra (1999), Svendsen (1999), Verhoef (1996), Wallart and Bu¨rgenmeier (1996).
4. Note, however, that this idea is usually derived in the context of environmental pollution by firms rather than consumers. Also, in theory the distinction between command-and-control regulation and taxes is not entirely clear-cut as very high taxes on particular consumption activities could have the same economic effects as outright prohibitions. However, in our sample, there is no example of a tax that comes close to this description. 5. In this dimension, some environmental proposals also have a positive direct effect. Specifically, proposals to increase public transport introduce new consumption options. 6. By the same token, if a proposal calls for a reduction of public spending on projects with
negative environmental effects such as motorways, it should be associated with lower taxes.
7. The study uses heterogeneity of the population across 57 counties to estimate the effects of income and of the opportunity costs of environmental proposals on voting behavior. 8. These referenda are also in our data set.
9. They concern the amount of support by various population groups, the legal status of the proposal, etc.
10. For instance, the above-mentioned studies on environmental ballots by Kahn and Matsusaka (1997) and Thalmann (2004) use logit models. The same is true for papers dealing with referenda on non-environmental issues (e.g., Schulze and Ursprung 2000). 11. Alternatively, we could have modeled the outcome of the vote as a random variable that
takes value 1 if the proposal is accepted and 0 if the proposal is rejected to examine the factors that affect the acceptance probability. However, this would involve ignoring valuable information on the fraction of voters who accept a proposal.
12. Obviously, such proposals can have indirect effects (e.g., by making energy more expensive). These effects will be captured by the general economic impact dummy below. 13. Obviously, we are talking about the direct effects here. Possible detrimental effects on economic activity that may reduce tax revenue in the long run are captured by the general economic impact dummy instead.
14. The logic of the notation TAX+corresponds to the earlier notation CS+: In both cases, a value of 1 reflects a positive effect on consumers.
15. economiesuisse is the result of a merger of Vorort and wf and has the support of more than 30,000 businesses of all sizes, employing a total of 1.5 million people in Switzerland in 2005. For the early referenda, we use the recommendation of Vorort.
16. We shall discuss this interpretation below.
17. One might expect the impact of the endorsement by the business association to be particularly strong when it represents a large portion of employees, so an interaction term of this share and the dummy BS would be interesting. Because consistent data were lacking, we could not follow this approach.
18. The research center GfS (Gesellschaft fu¨r Sozialforschung) is specialized in applied policy research.
19. We are grateful to Marc Bu¨hlmann (Institute of Political Science, University of Bern) who made available the data for the early referenda.
20. To construct this series, we employ data published by the Swiss Federal Statistical Office and the Swiss National Bank (see http://www.bfs.admin.ch and http://www.snb.ch, respectively). Detailed information about the construction of this variable is available from the authors upon request.
21. Unemployment rates were obtained from the Confederation’s State Secretariat for Economic Affairs. See http://www.seco.admin.ch.
22. A referee has suggested to use the change of the unemployment rate in the preceding period, DUNEMP, instead, as one might expect voting behavior to react to the changes rather than to the level. We will investigate this possibility below.
23. Population density is measured by the number of inhabitants per square kilometre. The data can be found on the official homepage of the Federal Authorities of the Swiss Confederation. See http://www.admin.ch.
24. We obtained the recommendations directly from those organizations. 25. See the Appendix for more detailed information.
26. For instance, this applies to a proposal to subject decisions on highway projects to a referendum: Even though this might lead to restrictions on road building, we deemed this effect too vague to be considered here.
27. The typical example would be the expansion of rail transport with simultaneous reduction in road transport.
28. Arguably, for instance, a proposal to subject highly subsidized nuclear power stations to more complex planning projects might be expected to reduce subsidies, and hence taxes in the long-run. We deemed this effect to be too vague, however.
29. The cantonal data exhibit similar patterns.
30. The alternative explanation that the counterintuitive sign may be caused by high correlation between GROWTH and DUNEMP is not consistent with the evidence, as the sign does not change when GROWTH is deleted from the regression.
31. There is one important difference, however. In Model 3, the sign of the unemployment coefficient switches, with higher unemployment corresponding to more yes-votes. This counterintuitive effect becomes understandable by comparison with the cantonal regression. There, the variation in the unemployment rate is regional as well as temporal. In the national model, however, the variation is only temporal. Thus, the high concentration of referenda with large numbers of yes-votes is in the early years of high unemployment is likely to have a stronger effect on the outcome than in the regressions with cantonal data.
32. Also, treating proposals as endogenous leads to a mild reinterpretation of the significant positive constant in our regression: It suggests that proposals are chosen so that a substantial baseline support exists.
33. Arguably, direct democracy might play a rule in generating these results. Elected politicians might be willing to impose restrictions on consumer sovereignty even when consumers would not accept such a proposal.
References
Buchanan, J. M. and G. Tullock (1975), ‘Polluters Profits and Political Response: Direct Controls versus Taxes’, American Economic Review 65(1), 139–147.
Frey, B. S. and F. Schneider (1997), ‘Warum wird die Umwelto¨konomie kaum angewendet?’, Zeitschrift fu¨r Umweltpolitik und Umweltrecht 126(2), 153–170.
Deacon, R. and P. Shapiro (1975), ‘Private Preference for Collective Goods Revealed through Voting on Referenda’, American Economic Review 65(5), 943–955.
Dewees, D. N. (1983), ‘Instrument Choice in Environmental Policy’, Economic Inquiry 21(1), 53–71.
Dijkstra, B. R. (1999), Survey Among Dutch Groups, in B. R. Dijkstra, ed., The Political Economy of Environmental Policy: A Public Choice Approach to Market Instruments Cheltenham UK: Edward Elgar.
Fischel, W. A. (1979), ‘Determinants of Voting on Environmental Quality: A Study of a New Hampshire Pulp Mill Referendum’, Journal of Environmental Economics and Management 6(2), 107–118.
Frederiksson, P. G. (1997), ‘The Political Economy of Pollution Taxes in a Small Open Economy’, Journal of Environmental Economics and Management 33(1), 44–58.
Hahn, R. W. (1990), ‘The Political Economy of Environmental Regulation: Towards a Unifying Framework’, Public Choice 65(1), 21–47.
Hahn, R. W. and R. G. Noll (1990), ‘Environmental Markets in the Year 2000’, Journal of Risk and Uncertainty 3(4), 351–367.
Halbheer, D., S. Niggli and A. Schmutzler (2003), ÔWhat does it take to sell Environmental Policy? An Empirical Analysis for SwitzerlandÕ, University of Zurich, SOI Working Paper No. 0304.
Kirchga¨ssner, G. and F. Schneider (2003), ‘On the Political Economy of Environmental Policy’, Public Choice 115(3–4), 369–396.
Kahn, M. E. and J. G. Matsusaka (1997), ‘Demand for Environmental Goods: Evidence from Voting Patterns on California Initiatives’, Journal of Law and Economics 40(1), 137–173. Keohane, N., R. Revesz and R. Stavins (2000), Economics of the Environment: Selected
Readings, New York: Norton.
Polk, A. and A. Schmutzler (2005), ‘Lobbying against Environmental Regulation vs. Lobbying for Loopholes’, European Journal of Political Economy 21(4), 915–931. Schulze, G. and H. W. Ursprung (2000), ‘La donna e mobile – or is she? Voter Preferences and
Public Support for the Performing Arts’, Public Choice 102(1–2), 131–149.
Svendsen, G. T. (1999), ‘U.S. Interest Groups Prefer Emission Trading: A new Perspective’, Public Choice 101(1–2), 109–128.
Thalmann, P. (2004), ‘The Public Acceptance of Green Taxes: 2 Million Voters Express Their Opinion’, Public Choice 119(1–2), 179–217.
Vatter, A., F. Sager, M. Bu¨hlmann and M. Maibach (2000), ‘Akzeptanz der schweizerischen Verkehrspolitik bei Volksabstimmungen und im Vollzug’, Verkehr und Umwelt, NFP 41, Bericht D12, Bern.
Verhoef, E. (1996), ‘Efficiency and Equity in Externalities’, in E. Verhoef, ed., The Economics of Regulating Road Transport. Edward Elgar, Cheltenham, UK.
Wallart, N. and B. Bu¨rgenmeier (1996), ‘L’acceptabilite´ des taxes incitatives en Suisse’, Swiss Journal of Economics and Statistics 132(1), 3–30.
Appendix LIST OF PROPOSALS
Table A.I. Detailed information about the content of each proposal, codification decisions, environmental preferences at the time of the vote and the percentage of yes-votes
No. Date Content CS TAX BS ENV %YES 1 25/09/77 Pollution standards for
motor vehicles
0 0 ) 74 39.0 2 26/03/78 Possibility for optional
referendum on highway projects
Table A.I.Continued
No. Date Content CS TAX BS ENV %YES 3 28/05/78 Prohibition of driving on
12 Sundays per year
) 0 ) 74 36.3 4 18/02/79 More restrictive conditions
for approval of nuclear power plants
0 0 ) 73 48.8
5 20/05/79 Slightly more restrictive conditions for approval of nuclear power plants
0 0 ) 73 68.9
6 27/02/83 Measures to reduce energy consumption
0 0 + 71 50.9 7 26/02/84 Highway usage fee 0 ) ) 71 53.0 8 23/09/84 Measures to reduce energy
consumption and support renewable energy usage; incl. energy tax
0 ) ) 71 45.8 9 23/09/84 Prohibition of new nuclear plants 0 + ) 71 45.0 10 07/12/86 Heavy-vehicle tax + 0 ) 73 33.9 11 06/12/87 Landscape preservation measures 0 0 ) 78 57.8 12 06/12/87 Extension of rail transport + ) + 78 57.0 13 12/06/88 General redirection of
transportation policy towards public transport
0 0 ) 74 45.5
14 01/04/90 General restrictions on road building
) + ) 70 28.5 15 01/04/90 Proposal not to build a
motorway (N1)
) + ) 70 32.7 16 01/04/90 Proposal not to build a
motorway (N4)
) + ) 70 31.4 17 01/04/90 Proposal not to build a
motorway (N5)
) + ) 70 34.0 18 23/09/90 General, non-specific
proposal to reduce energy consumption
0 0 ) 70 71.0
19 23/09/90 Ten-Year Moratorium on nuclear power plants
0 + ) 70 54.6 20 23/09/90 More stringent restrictions
on nuclear power plants
0 0 ) 70 47.1 21 03/03/91 Redirection of subsidies
from road to rail transport
Table A.I.Continued
No. Date Content CS TAX BS ENV %YES 22 03/03/91 Preservation of rivers and lakes 0 0 ) 61 37.1 23 17/05/92 Preservation of rivers and lakes 0 0 ) 50 66.1 24 27/09/92 Large-scale rail projects
(incl. trans-alpine tunnels)
+ ) + 50 63.6 25 07/03/93 Gasoline Tax Increase 0 ) + 47 54.5 26 06/06/93 Restrictions on the military
usage of landscape
0 0 ) 47 44.7 27 20/02/94 Road usage fee (prolongation) 0 ) + 47 68.5 28 20/02/94 Heavy vehicle tax (prolongation) + 0 + 47 72.2 29 20/02/94 Mileage-based heavy
vehicle tax
+ 0 + 47 67.1 30 20/02/94 Measures to move freight
transportation in the Alps from road to rail and restrictions on road building
0 0 ) 47 51.9
31 12/03/95 Constitutional support for organic farming
0 0 + 31 50.8 32 09/06/96 Redirection of subsidies from
conventional to organic farming
0 0 + 20 77.6 33 07/06/98 Restrictions on GM food ) 0 + 19 33.3 34 27/09/98 Redirections of subsidies from
conventional to organic farming
0 0 ) 19 77.0 35 27/09/98 Mileage-based heavy-vehicle
charge (Details)
+ 0 + 19 57.2 36 29/11/98 Financing Proposal for
Railway Infrastructure in the Alps
+ ) + 19 63.5
37 12/03/00 Proposal to reduce private road transportation by 50% in 10 years
) 0 ) 25 18.1
38 24/09/00 Tax on renewable energy; subsidies for solar energy
0 ) ) 25 31.9 39 24/09/00 Tax on renewable energy;
subsidies for solar energy (more moderate than 38)
0 ) ) 25 46.6
40 24/09/00 Energy tax 0 ) ) 25 44.6 41 04/03/01 Speed limit in towns
(30 km/h)
) 0 ) 15 20.3 42 02/12/01 Taxation of Energy
instead of Labor
Table A.I.Continued
No. Date Content CS TAX BS ENV %YES 43 18/05/03 Prohibition of driving on
4 per year
) 0 ) 14 37.6 44 18/05/03 Proposal to abandon nuclear
energy gradually
0 0 ) 14 33.7 45 18/05/03 Prolongation of the moratorium
on nuclear power plants
0 + ) 14 41.6
Explanation:
(i) The column ‘‘CS’’ refers to consumer sovereignty: The sign ‘‘)’’ corresponds to proposals with a direct negative impact on a particular activity (CS+=0; CS0=0); ‘‘0’’ corresponds
to proposals with no direct impact (CS+=0; CS0=1); ‘‘+’’ corresponds to proposals with a positive impact (CS+=1; CS0=0).
(ii) The column ‘‘TAX’’ refers to tax effects: The sign ‘‘)’’ corresponds to proposals that increase the tax burden (TAX0=0; TAX+=0); ‘‘0’’ corresponds to proposals with no direct impact on taxes (TAX0=1; TAX+=0); ‘‘+’’ corresponds to proposals that lower
the tax burden (TAX0=0; TAX+=1).
(iii) The column ‘‘BS’’ refers to the recommendation of the business association: A ‘‘+’’ corresponds to proposals that were endorsed by economiesuisse and its predecessors (IS=‘‘1’’); a minus corresponds to proposals that were not backed.
(iv) The column ‘‘ENV’’ gives the percentage of voters who consider environmental problems an important topic.