HAL Id: hal-02272754
https://hal.archives-ouvertes.fr/hal-02272754
Submitted on 28 Aug 2019
HAL is a multi-disciplinary open access
archive for the deposit and dissemination of sci-entific research documents, whether they are pub-lished or not. The documents may come from teaching and research institutions in France or abroad, or from public or private research centers.
L’archive ouverte pluridisciplinaire HAL, est destinée au dépôt et à la diffusion de documents scientifiques de niveau recherche, publiés ou non, émanant des établissements d’enseignement et de recherche français ou étrangers, des laboratoires publics ou privés.
Site-specific initiation of DNA replication within the
non-transcribed spacer of Physarum rDNA
Marianne Bénard, Claire Lagnel, Gérard Pierron
To cite this version:
Marianne Bénard, Claire Lagnel, Gérard Pierron. Site-specific initiation of DNA replication within the non-transcribed spacer of Physarum rDNA. Nucleic Acids Research, Oxford University Press, 1995, 23 (9), pp.1447 - 1453. �hal-02272754�
Site-specific initiation
of DNA
replication
within the
non-transcribed
spacer
of
PhysarumrDNA
Marianne Benard*,
Claire Lagnel+ and Gerard Pierron
Organisation Fonctionnelle du Noyau, UPR 9044 CNRS, 94801 Villejuif, France
Received February17,1995;Accepted March23, 1995
ABSTRACT
Physarum polycephalum rRNA genes are found on
extrachromosomal 60 kb linear palindromic DNA molecules. Previous work using electron microscope
visualization suggested that these molecules are
duplicated from one of four potential replication origins located in the 24 kb central non-transcribed
spacer [Vogt and Braun (1977) Eur. J. Biochem., 80, 557-566]. Considering the controversyonthenatureof the replication origins in eukaryotic cells, where both site-specific or delocalized initiations have been de-scribed,westudy here Physarum rDNA replication by
two dimensional agarose gel electrophoresis and
compare the results to those obtained by electron
microscopy. Without the need of cell treatment or
enrichment in replication intermediates, we detect
hybridization signals corresponding to replicating rDNAfragments throughout the cell cycle, confirming that thesynthesis of rDNA molecules isnotunder the control of S-phase. The patterns of replication
inter-mediatesalong rDNA minichromosomes are
consist-ent with theexistence offour site-specific replication origins, whose localization in the central
non-tran-scribed spacer is in agreement with the electron
microscope mapping. It is also shown that, on a few
molecules, at least two origins are active simulta-neously.
INTRODUCTION
Although various methods have been introducedtoinvestigate
themechanisms ofchromosomal DNAreplication, thenatureof eukaryotic replication originsisnotyetelucidated. In theyeast
Saccharomyces cerevisiae, autonomously replicating sequences
(ARS)wereproposedtocorrespondtoorigins.Toanalyzetheir chromosomal activity,two-dimensional (2D) gelmethodswere
developed (2,3) and it was then demonstrated that most ARS functionasreplication origins (4-6). Although the initiation of
replicationoccursatspecific sitesinS.cerevisiae, theexistence of such defined sites remains controversial in otherorganisms, as
illustrated by the amplified dihydrofolate reductase (DHFR) locus in Chinese Hamster Ovary (CHO) cells. An origin of
bi-directional replicationwasmapped 17kbdownstreamof the
gene by detecting the transition between lagging and leading
strand synthesis or by measuring the length ofnascent DNA
strands(7,8). However,2Dgel analysis ofthis locus indicates that its replication is initiated from multiple sites locatedover a55 kb
region encompassing the origin mentioned above (9). Other studies involving these different methods (reviewed in 10) reinforce this conflict between two concepts for replication initiation: specific origins ofbidirectional replicationorcomplex
broad regions involving multiple sites, with perhaps complete absenceof specificity.
These studies have beencarriedouton avariety of loci andin
different organisms. In this context, rRNAgenes representan
interesting locus since theyarehighly conserved andarepresent
inhighcopy numbers, allowing 2D gel analysis of replication
initiation in complexgenomes. Electron microscope (EM) data
suggested thatinitiation takesplaceatfixed sites within rDNA
nontranscribedspacer(NTS), asdeduced from observations of
replicating DNA molecules from Physarum, Tetrahymena, Xenopus larvae and; sea urchin embryos (1,11-13), or from
chromatin spreads ofDrosophila embryos and yeast (14,15). Site-specific initiation of rDNA replicationwasconfirmedby 2D
gel analysis inyeast: rRNAgene repeats arereplicatedfroma
subsetoftheARSelements (-1 in5) locatedupstreamof each transcription unit(4,16,17). Incontrast, results suggestingthat
initiation occurs without sequence specificity in rDNA of
Xenopus laevisearly embryos, andatmultiple sites throughout the 31 kb NTS of rRNA gene clusters in human cells were
recently published (18,19). Yet, the tandemrepeatorganization of
the rRNAgenescomplicates interpretationof 2Dgel results;in
particular originusageisill-defined. Inyeast,it isnotknown if the samesubset ofreplication originsis activated atevery cell
cycle (4) and in animal cells, it is notclear whether multiple origins are used insome of therepeats,orifa singleinitiation eventoccursfor eachrepeat atdifferent initiation sites(19).
PhysarumpolycephalumrRNAgenesarelocatedon
extrachro-mosomal molecules, as is the case for Tetrahymena and
Dictyostelium (20-22). Thesemolecules, presentin about 150
copiesperhaploid genome (23),constitute 60 kb linear
palin-dromes (Fig. lA; 24,25). The highly organized but simple
structure ofPhysarum minichromosomes implies thateach of
these molecules acts as a replicon. It also made possible an
alignment of replicating Physarum rDNA molecules and a
precise mappingofreplicationinitiationsites(1).Itwasdeduced
thatreplicationforksproceed bidirectionallyfrom fourpotential
*Towhom
correspondence
should beaddressed1448 Nucleic Acids Research, 1995, Vol. 23, No. 9 A
la.*
26S 19S 5.8S 0 10 I . . . . I . . . O 10 B0.5 V/cm for 24-60 h at room temperature. A 1% agarosegel run in a cold room at 3V/ cm for 15-20 h was used for thesecond
dimension.
o
ot
20 30 kb
t
18 22 26 30 34 38 kb
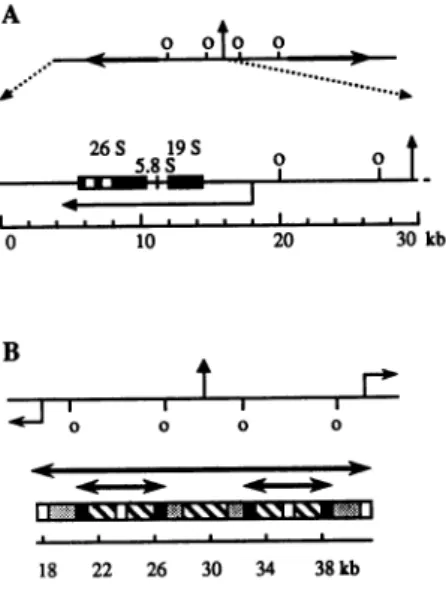
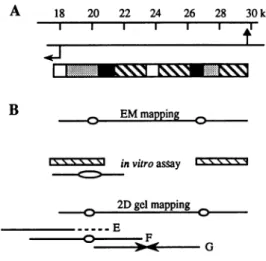
Figure1. rDNAorganizationinPhysarum.(A)A 60 kb rDNApalindromeis represented: the vertical arrow indicates the symmetry axis whereas the horizontal arrowsdepict thetwodivergenttranscription unitsseparated bya large central NTS(24); positionsofthereplicationorigins(o) areaccordingto reference 1. A 30 kb half molecule isenlarged; the 13.4 kbprimary transcript isrepresentedas ahorizontal arrow, the black boxes indicate thepositionof the 19S,5.8S and 26S RNAunits,the lattercontainingtwointrons(white boxes) (25).(B)The structure of the central NTS isdepicted (adaptedfrom26). A seriesof motifs is reiterated four times: bold horizontalarrowsunder the map underline thesymmetriesinside thepalindrome. Blocks of short direct repeats (stippled boxes)andinverted repeats (hatched boxes)areshown; the few sequenceswhichare notcomposedof repeats appearasblack boxes whenthey areidentical and whiteonesotherwise.
replication
origins located in the centralNTS, only onebeingactiveon agiven molecule.
Interestingly,
further studies indicatedthat these fourregions constitute nearly identical sequences in invertedorientation(Fig.
IB;
26). However,EMobservations of four differentoriginsmayinfactcorrespond
to aninitiation from multiple sites within abroadregion.Totestthispossibility,weundertooka2Dgelstudy of rDNA,asit allows theanalysis ofa
muchhigher number of molecules thanisfeasablebyEM.We
conclude that Physarum rRNA genes are replicated from site-specific origins, in agreement withresults obtainedbyEM
visualization.
MATERIALS
ANDMETHODS
Strains and cultures
Experimentswerecarriedout onstrainTU291,whichis derived
from the Wisconsin Inaturalisolate (27). Synchronous macro-plasmodia were grown as previously described (28). Defined stagesof the cellcyclewerededucedfromthe time of mitosis, as
seenunderaphasecontrastmicroscopeof ethanol-fixed smears. DNApreparation,endonucleasedigestion and 2D gel
electrophoresis
TotalgenomicDNA was prepared as describedelsewhere (28).
Fifteen
ig
oftotal DNA was digested with 150 U of restriction enzymes (Boehringer,Mannheim) for 2 h at370C.Neutral-neutral2Dgel electrophoresiswas carried out
essen-tially as previously described (2). The first dimension was
performedona0.4%agarosegel,submittedtoeither1 V/cm or
Southern hybridization
Followingelectrophoresis,DNAwastransferedonto nitrocellu-lose membraneby using a VacuGene apparatus (Pharmacia).
Hybridization was carried out in a 65°C Hybaid oven
(Schleicher andSchuell)for 20 h withasolutioncontaining10% sulfatedextran,200,ug/mlsalmonDNA,3 xSSC,0.5%SDSand
5x Denhardt's buffer.Filterswerewashedtohighstringency (0.1
x SSC, 0.1% SDS for twice 15 min as final washes) and
autoradiographed.
For quantitation of the signals, a MolecularDynamics 400A
Phosphorlmagerand theImageQuantsoftware were used. The conditions ofmeasuring were aspreviously described(18).
Hybridization probes
DNAprobeswerederivedfromfourpBR322 plasmidsprovidedby
RichardBraun(Bern, Switzerland). After endonucleasedigestion, thefragment of interest wasisolated onagarosegel, purifiedand
[32P]dC'Tplabeledby random primed reaction
(NEN).
Plasmids insertsandderived probesaredepicted in Fig. 2B: (i)
pPHR 116plasmid contains a5.4 kbBamHI-HindIII fragment located 3 kb from the end of the molecules. We derived two
probes from thisplasmid, probe 1whichconsists in the complete insert, and probe la corresponding to a 3.0 kb BamHI-EcoRI fragment. (ii)FrompPHR102 plasmidwederivedprobe 2,a5 kb
HindIlI fragment including
3'part
of the26S, the 5.8S and5'part
ofthe 19Sgenes.(iii) pPHR103insert isa2.3 kbSall fragment corresponding to the 5' external transcribed spacer. We used either the downstream 0.9 kbSalI-PstI ortheupstream 1.4 kb
PstI-SalIfragments, referredtoprobes 3aand3b, respectively. (iv) pPHR117 insert which isrepeatedtwice per halfmoleculeis
a 0.6 kb MboI fragment located
respectively
2.6 and 7.8 kb upstream of the transcription initiation site, in the replication origin regions. Probe4contains thecompleteinsert.RESULTS
In this communication, we analyzed rDNA replication in Physarum bythe neutral-neutral 2Dgel technique of Brewer and Fangman (2).Therationale of thismethodisbased ondifferential electrophoreticproperties of replicatingDNAfragments accord-ingtotheirmassand also theirshape.AsdepictedinFigure 2A, restricted linear fragments migrate along a diagonal while
replicating fragmentsareretardeddepending on the extent of their
replicationand the number of replicationforks they contain.
First, we asked whether this technique could be applied to rRNAgenes usingtotal Physarum DNA extracted by standard
procedures. Indeed,except inyeast, 2D gel studies on initiation of rDNA replication were carried out with DNA preparations enriched in replicatingmolecules (18,19). In Physarum, there exists -300copiesof rRNA genes, in a genome size of 6 x
108
bpperdiploidnucleus. The natural synchrony of the cell cycle (seebelow)cannotimprovetheanalysis,as rDNAsynthesis is not under the controlof Sphase (29,30), so that at a given moment of the cell cycle only a few rDNA molecules are actively
replicated.Infact,asshowninFigure 2C, the 2D gel analysis of
atotal DNApreparationallows detection ofeasily recognizable
9
?tq
0Research, 1995,
23,No. 9 Firstdimension .-.... ,2x',%', ~~~~~x -:bubblearc -: Y arc ----:double Yarc pPHR 102 pPHR117 pPHR 116 pPHR103 la 2 3b 1 3a r..::D,D-. 4 4 3 0l -t CFigure 2. Experimental conditions. (A) During neutral-neutral 2D gel electrophoresisofBrewerandFangman (2), the linearDNAfragments migrate alongadiagonalandareseparated fromthereplicationintermediates. The
bubblearc(plain)isgenerated bytworeplicationforksinitiating fromanorigin locatedclosetothefragmentcenter,the Yarc(bold) indicates that the fragment ispassively replicated byoneforkoriginating outside thefragment, andthe double Yarc(dashed)results fromtwoforksconverging inside the fragment. (B) Theextentand thelocation of the probes (stippledboxes)aredepicted with respect tothe rDNAunit, with the pPHRplasmids from which theyarederived (see Materials andMethods). (C) Detection of replicationintermediateswas
assayedatrDNAloci.A 2Dgelanalysiswascarriedoutontotal DNAextracted fromaG2phaseplasmodium and digested with HindmI. The intragenic probe 2 wasusedforhybridization. After autoradiography, atypical Y signal is observed.
replicationintermediates:inadditiontoamainlxspot
correspon-ding to linear non-replicating fragments, a distinct Y arc is
observed. These clearsignals demonstratethata2Dgelstudyof
Physarum rDNA replication is feasible withoutanyenrichment
ofDNAsamplesnorcelltreatment.
ThePhysarum plasmodiumisagiantcellcontainingupto108
nuclei, all cyclingsynchronously.Thisallowsapreciseanalysis
ofthe cellcycleeventswithoutartificialsynchronization. It has
beenshownthatchromosomalDNAisreplicatedduringthe 3 h
S-phasethatimmediatelyfollows mitosis(thereisnoGIphase).
Onthe otherhand,rDNAminichromosomeduplicationisloosely regulated:itbeginsinmid-S-phaseand continues into the 5-7h
G2-phase, where>50% of the moleculesarereplicated;there is
norDNAsynthesisduringthe first hour of Sphase(29,30).To
studythedistribution of thereplicationforksatstagesatwhich
rDNAsynthesisisarrested andwhen itresumes,wecarriedout
2Dgelelectrophoresis usingDNAsamplesharvestedatdifferent
points ofthe cellcycle (Fig. 3). Weobserved Ypatterns atall
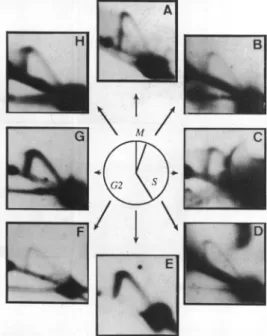
Figure3. 2Dgelanalysis of rDNA replication throughout the cell cycle. For all panels,DNAwasdigestedwithHindIl andhybridizedwithintragenicprobe
2.DNAsampleswereextractedfrom plasmodiaatdifferentstagesof the cell cycle,asrepresented in thecenterof thefigure (M=30 minmitosis; S=3 h
S-phase;G2=5-7 hG2-phase).Theletters mentionedontheautoradiograms referto thecell cycle stage (0 time is the end of mitosis): (A) -30 min (prophase), (B)+30min, (C)+I h,(D)+2h,(E)+4h, (F)+5h, (G)+6h, (H)+7 h.AsimpleYarcisdetectedthroughout the cellcycle.
stages,irrespective of the level of rDNA synthesis. Their different intensities seemto be dueto variations in thequality ofDNA preparations rather than a cell-cycle dependentmodulation, as
theywerenotreproducibly observed in duplicate experiments.
These results indicate that replication forks are continuously presentontherDNAfragment, presumably transiently fixedon
rDNA molecules in mitosis and early S phase. Thissuggestthat the arrestofrDNA synthesis in early S phase is aresult ofan
elongation blockade. The smoothness of Yarc patternsfurther
suggests that resumption of rDNA duplication occurs from
previous fork positionsonrDNAmolecules.
In order to map replication origins at rDNA loci, we then
scanned the minichromosomes by 2D gels. The previous EM study of Vogt and Braun (1) suggested that there are four
replication origins in the central NTS (Fig. 1). Therefore, we
expectedYpatternsin the coding regions andbubblepatternsin the central NTS (Fig. 2A). Our results,summarizedinFigure4,
show unambiguous and specific patterns which are consistent
withthisprediction.
In the transcription units, we analyzed four overlapping
fragments B, C, D and E (see legend foradetaileddescription of
restrictiondigests, fragmentsizes andprobes)andin allcaseswe
obtainedasimple Yarc(Fig. 4),demonstratingthat thegenesare
passively replicated. Wenoticed the absence of double Y patterns, which would result fromreplicationforks moving in opposite directions. A similar result was obtained when analyzing the replicationoffragment A, which overlays the main part ofthe
terminal NTS, shortened in its telomeric part (Fig. 4). Only a
simpleYarcis detected(thehybridization signalsseen ontheleft correspondtoapartialdigest).Noreplicationfork barriercould
beseen,whereasapolarbarrier has been identified 3' to therRNA A ._o0 _ 0 El mmr_0 0 B I 14
1450 Nucleic Acids Research, 1995, Vol. 23, No.9 A B C~ D G C =7777377=7 F = B = E - -A
-f.B-E
H
f
G E P =AAAZ f Bt
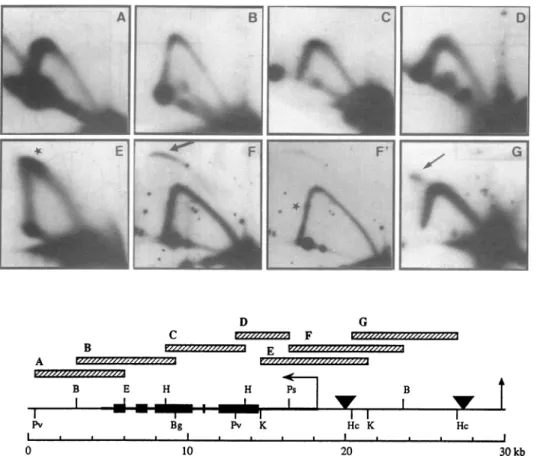
Pv Bg Pv K HcK Hc I . . * * I I I I I I I a I I 0 10 20 3COkbFigure 4. Mapping ofreplicationoriginswithin rDNAminichromosomesby2Dgelelectrophoresis.Thefragments analyzedarerepresentedashatchedboxes,with lettersreferingtothecorresponding panel; panelF' isalower exposureof thehybridization presentedonpanelF.Sizes,restriction endonucleases andprobesused wereasfollows:(A)5.5 kb PvuH-EcoRI(probe la),(B)6.1 kbBamHI-Bgll (probe1),(C)5.0 kb HindI(probe2),(D)3.4 kbPvuH-PstI(probe3a),(E)6.8 kb KpnI(probe4),(F)7.0 kbPstI-BamHl(probe3b)and(G)6.4 kbHincH(probe 4).The map indicatesthe location of the ribosomal genes(boldlinewith blackboxes), thetranscription polarity (horizontal arrow),and the restriction sites thatwereutilized(Ba=BamHI; Bg=Bgll;E=EcoRI;Hc=HincII;Hn=HindIl;K=KpnI;
Ps=PstI;Pv=PvuIl).The verticalarrowdepictsthecenterof the moleculeat30 kb(seescale).Theorigins (triangles)are asdeducedfrompanel F,theonlyone for whichabubblearcis observed(thick arrow),andfrompanelGfor whichadouble Ypatternisdetected(thin arrow).Star inpanelsE and F'underlinesthe slowing-downofreplicationforknearthetranscriptioninitiation site.
genes in many organisms
(16,17,19,31,32), arresting
the forks movingoppositetothetranscription direction.Evenafteralongerexposure, we did not detect any bubble arc
indicating
that initiationeventsoccurinfragmentA.Therefore,wecanexcludethe presenceofareplication
origin 3'
tothe rRNAgenes, except in the terminal third of the fragment (33). We also analyzed complete telomericfragments (datanotshown) andweobtaineddiffuse
patterns,
probably
duetotheheterogeneity
inlength ofthe terminal NTS (34). Nevertheless, the simple patterns that we detected in the codingregions are compatible withreplication forksmoving fromthetranscription
units towardstheextremities of theminichromosome,
as proposed from EM results. This progression is smooth as shown on Figure 4. The only placewhere we obtainedsome evidence for a stallingofreplication forks isattheboundaryof the central NTS and the codingregion
(fragments E and F). In fragment E, an accumulation of replicationintermediatescan beseenat theinflection point of the Y arc (star), that co-maps with the transcription initiation site region. This wasfurther
confirmed
by detection of a faint spot(star)withinthe Yarcobserved infragmentF (see low exposure,
panel
F').
Thesepatterns,which are reproducible and not detected elsewhere (seeother 2D gels), demonstrate the presence of a slow-down of thereplicationfork5'
of the rRNA genes.In the central NTS, analysis of fragment F shows a fully
developed bubblearc(thick arrow) togetherwithastrong Y arc.
Thiscomposite signalcaneithermeanthatinitiationtakes place
in a broadregionorthat itoccurs at a site-specific replication originwhich is notalwaysused. In ordertodistinguishbetween these twopossibilities, we analyzed theflanking fragmentsE and G where we nolonger observed a bubble arc. This proves that there is asite-specificinitiation of DNAsynthesisinthemiddle offragmentF.
Similarly,another bubble arc isexpectedcloser to the center of the molecule.Yet,because of thecomplexpalindromicstructure of the NTS and the lack of specific probes and appropriate restriction sites,wecouldnotobservedirectlytheactivity ofthis
secondsetoforigins. Therefore,weanalyzedfragment G, located
in the central NTSbetweenthe twoEM-mapped origins.We did detect a faint double Ysignal(thinarrow) inadditiontothemajor Y arc. This double Y pattern does not appear as a diffuse
triangular regionthat isformedwhenreplication forks collideat random in afragment. This is reinforced by the absence of a terminationsignalin theoverlapping fragmentF. Inaddition, the
high positionof the spike (as compared to the Y arc) reveals that itismosflycomposed of replicationintermediatessymmetrically
branchedrather than asymmetrically branched; this indicates that thetworeplicationforks meetroughly in the middle offragment G. Thus, this double Y pattern indicates indirectly that the
potential originscloser to the symmetry axis arefunctionaland
that,in rarecases, two adjacentreplication origins are simulta-neously active on a given molecule.
I
'. D
-,f "';
"A
NucleicAcidsResearch, 1995, Vol.
23,
No.9 1451Another indirect evidence of the activity of these origins is
drawnfromthecomparisonof bubblearcand Y arc intensities in fragment F, asexplained in Figure 5A. If the two origins, a and
a',
locatednearthetranscriptioninitiation start sites, weresolelyactive, the replication of fragment F and its palindromic
counterpart shouldgivearatioofonebubblearc totwoYarcs.
On the other hand, if four origins were active, the fragments
would be more often passively replicated, so that the total
expected ratioshould be one bubblearc tosix Y arcs. In orderto determine originusage, wehavequantifiedtherelativeamounts ofthe different hybridization signals by Phosphorlmager tech-nique on the filtershown inFigure SB. The lx spot represents 97% of the signals, which illustrates the low number of
replicating rDNA molecules at a given stage of the cell cycle; this valueis very similar to the 96% of linear rDNA molecules that were seenon EM(1). Therelative amount of replicating signals
isonebubble arc to nine Y arcs, which compares better with the model in whichfourreplication origins are active. The lower than
expectedbubble arc to Y arc ratio can beinterpretedeitheras a
preferentiallossof bubble-shaped replication intermediates or as
alowerusageof originscloser to the genes than the distal ones (seeDiscussion).
In Figure 6, we summarize results obtained on mapping of
PhysarumrDNAreplication originsinthreedifferentstudies. In the EM study (1), the alignments ofbubble-containing rDNA
molecules indicatedthat there are twoorigins per half molecule,
localizedin the central NTS. Next, theorigins located near the promoterregion,whenplaced in aplasmid, were shown to initiate
replicationin vitro(35). Finally, our 2D gel analysisconfirmed these earlier results. Thebubblearcseeninfragment F shows that there is anorigin in its center while the Y arcs obtained with
fragmentsEand Gdelimittheborderof the origin site, according
tothe rule that anorigin situatedin theterminal third ofafragment
will not be detected(33).Thesecondreplicationorigin has been
positioned symetricallytothefirstone wemapped withrespect
tothe middleof the fragment G, forwhich adoubleYarc was detected. As depicted in Figure 6, results obtained with these
differentmethods are ingoodagreement.
DISCUSSION
OuranalysisofPhysarumrDNAsynthesis bythe 2Dgelmethod
ofBrewerandFangman showedthatreplication intermediatesare
foundatall stages of the cellcycle (Fig. 3).This is consistent with
previousstudiesbasedonincorporation ofexogenous precursors,
showingthat rDNAduplication isnotunder the control ofSphase (29,30). However, the finding ofYarcsduringthe firsthour of
Sphaseis apparently inconflict with theseformerdata, which
clearly demonstratedthat there isnorDNA
synthesis during
this period. Infact, 2D gel detection ofreplication
forks does notexclude that they are temporarily motionless. Taken together,
these data suggest that, for the few molecules
engaged
inreplication at the onset of S phase, elongation is impeded. Interestingly, this block would occur at a cell cycle
period
in which thenucleolus isdisruptedandreconstructed;rDNAis then found in theprenucleolar bodies and istranscriptionally
active(36). Further studies would berequiredto determine theexact
relationshipbetween the nucleolusstructureandthe
progression
of
replication
forksonrDNAmolecules.A a b Analysed G fragments fi) B
t
rigin ring a b bt bt at I I I WM1 Expected V77-773 composite signals f\ 2 4^/%
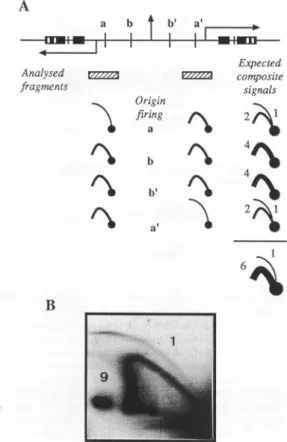
4\ -"11 2 6&Figure 5. Quantitation of relative bubble arc and Yarcintensities.(A)A rDNA palindromeisrepresentedwithfourpotential replicationorigins a, b,b', a'
(other symbolsarethesame asinFigure 1). Below isillustratedthefactthat, depending on the number oforigins which are activated, different ratios between bubblearcandY arcareexpectedinthecompositesignal obtained for the7.0kbPstI-BamHIfragments (shownashatched boxes andcorresponding tofragmentFinFigure4). Whenoneorigin isfiredinside afragment itsmirror counterpartispassively replicated, which generatesacomposite signal(right). Since theorigin-containing fragment isreplicated bytwoforks, it is duplicated twiceasfastasthefragment replicated byasingle fork,sothat the bubblearc hasanintensitytwice weaker than theYarc.If only thetwoorigins aanda'
wereactive, addition of respective composite signals would give a ratio of one bubblearcto twoYarcs.If thetwoexternaloriginswerealso active, the total ratio should be one bubblearctosixYarcs,asindicated on the figure. (B)A PstI-BamHIdigestwassubjected to 2D gel analysis and probed with probe 3b. Following autoradiography, thesignalswerequantifiedby storage phosphori-maging.Backgroundwasmeasured above the bubble arc and then substracted from the signals. The measure of each arc intensity was obtained from integration of thecorrespondingarea:lx spot=96.9%,bubble arc=0.3%and Y arc=2.8%.The ratio ofbubblearcto Y arcisone tonine,which is closer totheoneexpected for four origins.
We nextfocused our analysis on the mapping ofreplication originsonrDNAminichromosomes, andwecomparedourdata with the EM results(1).In the 2Dgel method,westudiedabout
107
replicationintermediates
in each analysis, whereas 37replicating molecules were observedin the EM;
despite
these different scales, the two methods lead to similar conclusions which reinforce each other.Indeed, 2Dgel detectionofabubblearc only in fragmentF (Fig. 4) demonstrates the
activity
ofasite-specific,
promoter-proximal origin. Interestingly,
itcorre-spondstothesite ofinitiation
mapped
by Vogtand Braunontheassumption that the eyes of
only
two moleculesclearly
fell outside of themorecentrallylocatedorigin. Conversely,
wecouldnotprovidedirectevidence for this latter
origin
activity
because1452 NucleicAcids
Research, 1995,
Vol.23,
No. 9 18 20 22 24 26 28 30 kb I I I I I B EMmapping -' -' in vitroassay 2Dgelmapping -E _F )0,< GFigure6.Mappingofreplication originsatrDNAloci.(A)AhalfcentralNTS
isrepresented; symbolsarethesame asinFigure IB,identicalnonrepetitive
DNAsequencesbeingshownasblack boxes.(B) PhysarumrDNAreplication origins mappingisoutlined,asdeducedfromdifferentstudies. Intheupperpart,
the EMresults(1)aredepicted.rDNAmoleculeswereobserved intheEM;37 replicatingmoleculeswerealigned accordingtotheirsymmetryaxisand the
centerofeacheyeofreplication was measured. Two initiations sites were
mappedat33and 45%of themolecules,whichcorrespondsto20and27kb
fromoneend.Belowisshownthemappingdeduced froman invitro assay
study (32): hatched boxesrepresent theearliest in vitro labeled fragments
obtained when rDNA molecules are used as a template, whereas the eye
indicatestheregioninwhichwereconfined the centerofthebubblesobserved
in theEMafterin vitroreplicationofarecombinantplasmid.At thebottom is representedthemappingasdeducedfromour2Dgel analysis (Fig. 4). First, the fully-developedbubblearcobservedonlyinfragmentFimpliesthatthereisa
replication origininthemiddle of thefragment(20 kb);theasymmetric position
ofthisorigininfragmentEprecludesdetection ofapartialbubblearc(dashed
linerepresentsthepartofthefragmentinwhichanorigin activitycouldnotbe detected). Second, the convergence of tworeplicationforksinfragmentG
indicatesthat thereisanotherreplication originlocatedsymetricallytothefirst
onewithrespecttothecenteroffragmentG(27.4 kb).
double Y arc in fragment G in between the two EM-mapped origins (Fig. 4), and we quantified the relative intensities of
hybridization signals infragmentF(Fig. 5). Togetherwiththe
EMresults,thesedataindicatethatthereisanefficientsetof four
replication origins located in the central NTS (Fig. 6). These
results fromtwophysical mappingmethodsarefurthersupported
byanin vitroassay ofrDNAreplicationinitiation(Fig. 6; 35);
moreover,theyarereinforcedbythepalindromicstructureof the
central NTS (26) in which the origin region is reiterated four
times (Fig. 1). The origins are situated in the vicinity of the
junction between series of 31 bp motif repeats and a more
complexsequence of900bp (37);wedidnotfindanyobvious
homology neither with the yeastARS consensus sequencenor
with sequences thatare likelyinvolved inrDNAreplication of
Tetrahymena(38).Ourdataalsoprovesthatinitiationtakes place
at fixedsites(Fig. 4), aspreviously suggested by EManalysis. Thisresultcontrastswiththedelocalizedinitiation describedfor
rDNA in Xenopus embryos and human cells (18,19) and
illustrates thepossibility oftwotypesofeukaryoticreplication
origins: site specific and diffuse. Interestingly, Physarum may
containbothtypes:theLAV1-2locusgenerated complexpatterns whenanalyzed by2Dgels(39),whileadiscretereplicationorigin
iscloselylinked toaprofilingene(28,39); hence, rDNAlociare
thesecondexampleof sitespecificinitiationinPhysarum.
The replication fork propagation within rDNA minichromo-somes occurs at arelativelyconstant rate. Onlyin the 5' region oftheprimary transcripthave we observedaslow-down of the replication forks (stars in Fig. 4), which may be causedby the proximity between a replication origin and the promoter of actively transcribedgenes. Otherwise,the smoothnessofour2D gel patterns implies the absence of aRFB in the 3'end of the
rRNA genes, unlike in yeast where the genes are synthesized mostly unidirectionally as a result of a polar replication fork
barrier
(16,17)
thatwasalsofoundinDrosophila,Pisum sativum and human rDNA (19,31,32); thereplication
fork barrierprevents thereplicationof thecoding regionby the forksmoving against the transcription direction. In yeast, the stalling of the
replicationforks was shown to occurindependently of
transcrip-tion(40); yetthe barriermay be theresultofalong-termselection,
due to tandem organization ofyeast rRNA genes which would allow acollisionbetween the RNA and DNApolymerases
(41).
On the otherhand, Physarumand
Tetrahymena
extrachromoso-mal rDNA structure may not require such a mechanism for replication and transcription coordination. In these organisms,
EM studies have suggested that replication and transcription
proceed in the samedirection through rRNA genes
(1,1
1). Our 2Dgel analysis of replication initiation confirms these
previous
results, although we cannot exclude that there is a replication
origin in the terminal kb of rDNA minichromosomes;however, thispossibility is weakened by the absence of
termination
signals throughoutthecodingregion.These studiesfavourtheconcept of replicationorigins located only in the centralNTS.Finally, the fact that several origins can befiredinPhysarum
rDNA raises the question of origin usage. Measurement of
hybridization signal intensities gave a ratio of onebubble arc to nine Y arcs, which is lower than the one to six ratio expected if thefourreplicationorigins were equally activated (Fig. 5).This
suggests thatorigins located near the transcription initiationsites
are less often used than the more centrally located ones. Previous EM observations indicated that 2/3 of the eyes are mostlikely
originatingfromthecenter-proximalorigins (1). In such a case, the expectedintensities of the Y arcs generated by the
firing
ofeach 'central' origins should be replaced by eight, as they are twice as active as a and
a'
(Fig.5A). The totalratio shouldbeofone bubble arc to 10 Y arcs, which is consistent with our data(Fig.
SB). This different usage is surprising considering that the same sequences are involved. In fact, recent results obtained in yeast illustrated a similar context effect, since two identical ARS elements located at opposite sites in a circular plasmid were not equal: one was activated four times morefrequentlythan the other (42). In Physarum, it was proposed that methylation level might regulate rDNA origin activity (43). In addition, the faint double Y pattern that we obtained in the central NTS (Fig. 4) demonstrates that more than one origin can be simultaneously active on the same molecule; however, this is not a frequent event, which explains why EM technique failed to detect it. The functioning of closely spaced origins was also studied in S.cerevisiae by insertingARSI on chromosomeV 6.5 kb away fromARS501.In this case, the two origins are seldom active on the same DNA molecule, which suggests that the
firing
of one origin often precludes the activity of the other one, leading to the concept of origin interference (44). Our results, which show a low level ofsimultaneous firing of the two origins that are 6.6 kb apart (Fig. 4), suggest an interference between naturally occuring origins. On the other hand, the use of several origins may conferNucleicAcidsResearch, 1995, Vol.23, No. 9 1453
an evolutionary advantage, as suggested by transformation of
Tetrahymenawithaplasmid containingatandemrepeatofrDNA
replication origin region. An accumulation of linear rDNA molecules was observed, with many copies of the origin in
tandem repeats obtained through homologous recombination,
andwasinterpretedas areplicativeadvantageconferredbythis spontaneous amplification (45). Another example of a high
density of chromosomal origins has been recentlydescribedatthe
ura4 locus in S.pombe where three ARS elementscontributeto
initiation in ahierarchical manner (46). Hence, initiation from
several close replication origins, as shown for the first time in
Physarum rDNA (1), could be relativelycommonin eukaryotic genomes and exemplifies the complexity of the replication process.
ACKNOWLEDGMENTS
We thankRichardBraun (Bern, Switzerland) for providing us
withplasmidscontaining rDNA fragments, Olivier Hyrien (Paris, France) forhybridization quantitationonPhosphorlmager,
Jac-queline P6dron for expert technical assistance and Dominick
Pallotta(Qu6bec,Canada) for critical reading of the manuscript. This workwassupported by general funding of the CNRS and by grant 1301 of Asssociation de la Recherche sur le Cancer, Villejuif.
REFERENCES
1 Vogt,V.M.andBraun,R. (1977)Eur J.Biochem.,80, 557-566.
2 Brewer,B.J. andFangman,W.L. (1987) Cell, 51, 463-471. 3 Huberman,J.A.,Spofila,L.D., Nawotka,K.E., El-Assouli,S.M. and
Davis,L.R. (1987)Cell, 51, 473-481.
4 Fangman,W.L. andBrewer,B.J. (1991)Annu. Rev.CellBiol.,7, 375-402. 5 Zhu,J., Newlon,C.S.and Huberman,J.A.(1992) Mol. Cell.Biol., 12,
4733-4741.
6 Collins,I. andNewlon,C.S. (1994)Mol. Cell.Biol.,14, 3524-3534. 7 Burhans,W.C.,Vassilev,L.T., Caddle,M.S., Heintz,N.H.and
DePamphi-lis,M.L. (1990) Cell,62,955-965.
8 Vassilev,L.T.,Burhans,W.C.andDePamphilis,M.L. (1990)Mol. Cell. Biol., 10, 4685-4689.
9 Vaughn,J.P.,Dijkwell,P.A.and Hamlin,J.L.(1990)Cell, 61, 1075-1087. 10 Vassilev,L.T. andDePamphilis,M.L. (1993) Crit. Rev. Biochem.Mol. Biol.,
27,445-472.
11 Cech,T.R. andBrem,S.L.(1981) Nucleic AcidsRes., 9,3531-3543. 12 Bozzoni,I., Baldari,C.T., Amaldi,F. and Buongiomo-Nardelli,D.(1981)
Eur J.Biochem.,118, 585-590.
13 Botchan,P.M. and Dayton,A.I.(1982) Nature,299,453-456. 14 McKnight,S.L.and Miller,O.L. (1977) Cell, 12, 795-804. 15 Saffer,L.D. and Miller,O.L.(1986) Mo. Cell.Biol., 6, 1148-1157. 16 Brewer,B.J. and Fangman,W.L. (1988) Cell, 55, 637-643. 17 Linskens,M.H.K. and Huberman,J.A.(1988) Mol. Cell. Biol., 8,
4927-4935.
18 Hyrien,O. and Mechali,M. (1993) EMBO J.,12,4511-4520.
19 Little,R.D., Platt,T.H.K. and Schildkraut,C.L. (1993) Mol. Cell. Biol., 13, 6600-6613.
20 Vogt,V.M. and Braun,R.(1976) J. Mo. Biol., 106, 567-587. 21 Gall,J.G. (1974) Proc. Natl.Acad. Sci. USA, 71,3078-308 1. 22 Cockbum,A.F., Taylor,W.C. andFirtel,R.A. (1978)Chromosoma, 70,
19-26.
23 Hall,H. and Braun,R.(1977) Eur.J.Biochem.,76, 165-174. 24 Grainger,R.M. and Ogle,R.C. (1978) Chromosoma, 65, 115-126. 25 Campbell,G.R.,Litteau,V.C., Melera,P.W.,Allfrey,V.G. and Johnson,E.M.
(1979) Nucleic Acids Res., 9, 1433-1447.
26 Ferris,P.J. and Vogt,V.M.(1982) J. Mo. Biol., 159, 359-381. 27 Funderud,S., Andreassen,R. andHaugli,F. (1978) Cell, 15, 1519-1526. 28 Benard,M. andPierron,G. (1992) Nucleic Acids Res., 20, 3309-3315. 29 Zellweger,A., Ryser,U. andBraun,R. (1972) J. Mol. Biol., 64, 681-691. 30 Newlon,C.S.,Sonenshein,G.E. and Holt,C.E. (1973) Biochem.,12,
2338-2345.
31 McKnight,S.L., Bustin,M. and Miller,O.L. (1978) Cold Spring Harbor Symp. Quant. Biol.,42, 741-754.
32 Hemandez,P., Martin-Parras,L., Martinez-Robles,M.L. and Schvartz-man,J.B. (1993) EMBO J., 12, 1475-1485.
33 Linskens,M.H.K. and Huberman,J.A. (1990) Nucleic Acids Res., 18, 647-652.
34 Johnson,E.M. (1980) Cell,22,875-886.
35 Daniel,D.C. and Johnson,E.M. (1989) Nucleic Acids Res., 17, 8343-8362. 36 Puvion-Dufilleul,F.andPierron,G.(1992) Exp. Cell Res.,203,354-364. 37 Ferris,P.J.(1985) Gene,39,203-211.
38 Larson,D.D.,Blackbum,E.H.,Yaeger,P.C. and Orias,E.(1986) Cell,47, 229-240.
39 Diller,J.D. and Sauer,H.W.(1993) Chromosoma,102,563-574. 40 Brewer,B.J.,Lockshon,D. and Fangman,W.L.(1992)Cell, 71,267-276. 41 Brewer,B.J.(1988) Cell,53,679-686.
42 Brewer,B.J. and Fangman,W.L. (1994)Proc.Natl. Acad. Sci.USA,91, 3418-3422.
43 Cooney,C.,Eykholt,R.H. and Bradbury,E.M. (1988) J. Mol. Biol.,204, 889-901.
44 Brewer,B.J. and Fangman,W.L. (1993) Science,262, 1728-1731. 45 Yu,G.L. and Blackbum,E.H. (1990) MoL Cell. Biol., 10, 2070-2080. 46 Dubey,D.D., Zhu,J., Carlson,D.L., Sharmna,K.andHubernan,J.A.(1994)