HAL Id: inserm-02457575
https://www.hal.inserm.fr/inserm-02457575v2
Submitted on 19 Feb 2020
HAL is a multi-disciplinary open access
archive for the deposit and dissemination of sci-entific research documents, whether they are pub-lished or not. The documents may come from
L’archive ouverte pluridisciplinaire HAL, est destinée au dépôt et à la diffusion de documents scientifiques de niveau recherche, publiés ou non, émanant des établissements d’enseignement et de
Norms for standard neuropsychological tests from the
French CONSTANCES cohort
Camille Ouvrard, Claudine Berr, Céline Meillon, Céline Ribet, Marcel
Goldberg, Marie Zins, Hélène Amieva
To cite this version:
Camille Ouvrard, Claudine Berr, Céline Meillon, Céline Ribet, Marcel Goldberg, et al.. Norms for standard neuropsychological tests from the French CONSTANCES cohort: Norms for five neuropsy-chological tests. European Journal of Neurology, Wiley, 2019, 26 (5), pp.786-793. �10.1111/ene.13890�. �inserm-02457575v2�
European Journal of Neurology, Wiley, 2019,
Norms for standard neuropsychological tests from the French
CONSTANCES cohort
Camille Ouvrard, PhDa, Claudine Berr, MD PhDb, Céline Meillon, MSca, Céline Ribet, PhDc,
Marcel Goldberg, MD PhDc,d, Marie Zins, MD PhDc,d, Hélène Amieva, PhDa
a Univ. Bordeaux, Inserm, Bordeaux Population Health Research Center, UMR 1219, F-33000
Bordeaux, France
b Univ. Montpellier, Neuropsychiatry Epidemiological and Clinical Research, Inserm U1061,
Montepellier, France
c Population-based Epidemiological Cohorts Unit, UMS 011 Inserm-UVSQ, Villejuif, France d Paris Descartes University, Paris, France
Corresponding author
Camille Ouvrard
University of Bordeaux, INSERM U1219
146 Rue Léo Saignat, 33076 Bordeaux cedex, FRANCE Tel: +33 5 57 57 11 73
Camille.Ouvrard@u-bordeaux.fr Total word count: 3485
Running title: Norms for five neuropsychological tests Keywords: Norms, neuropsychological tests, older adults Online only: Figure S1; Tables S1, S2, S3, S4.
Abstract
Background: Neuropsychological testing plays a key role in various clinical contexts. Even
though a substantial number of adults suffer neurological disorders such as early-onset dementia, stroke, traumatic brain injury or multiple sclerosis, most of normative data do not include persons below 65. The aim of this study was to produce updated norms for the Mini-Mental State Examination, the Free and Cued Selective Reminding Test, the Trail Making Test, verbal fluency tasks and the Digit Symbol Substitution Test for middle-aged and older adults.
Methods: The sample consisted of 51,879 participants aged 45–70 years from the
CONSTANCES study. Norms are presented in percentiles stratified on age, education and gender.
Results: The results illustrated the effect of age in all tests considered. For tests involving speed
processing, the impact of age was observed including in tight age ranges categories (5 years). The results also showed the well-known effect of education and an effect of gender in tests involving verbal memory and speed processing.
Conclusions: The norms provided allow apprehending the variability of the cognitive
performances of middle-aged to older population, with a high precision in age categories. The tests considered are broadly used in neuropsychological practice and should be helpful in a variety of clinical contexts.
Introduction
Neuropsychological assessment plays a key role in a variety of clinical contexts. Indeed, neuropsychological examination is essential in the diagnosis of dementia as well as in most neurological disorders such as stroke, traumatic brain injury or multiple sclerosis. Identification of low performances relies on the use of appropriate normative scores which allow clinicians determining whether a score is in the expected range. Such norms are available for a wide panel of tests for different age ranges. Nevertheless, the middle-aged group is rarely represented. Yet, dementia does not exclusively affect people over the age of 65. Early-onset dementia refers to people diagnosed with dementia under 65. A review relying on 11 studies estimated that between 6.9% to 45.3% of all patients diagnosed with dementia had early-onset dementia [1]. In particular, frontotemporal dementia is diagnosed in 10% of cases before 45 years of age, and in 60% of cases between 45 and 64 [2]. Furthermore, such normative data are very important to document cognitive decline that may be present long before dementia onset [3]. Beyond dementia, other neurological disorders may be experienced by middle aged adults. For instance, persistent cognitive deficits have been reported to affect over 20% of adults one year post-brain injury [4] and from 11% to 30% of adults one year poststroke [5]. Despite this matter of fact, most studies having computed norms for neuropsychological tests did not include persons below 65 [6].
Two other major issues limit the relevance of numerous published norms. First, several studies rely on a relatively small number of participants [7,8], which is a substantial limitation for a study aiming at addressing the inter-individual variability of cognitive performances in general population. The need of accounting for this huge variability is particularly outstanding in elderly population [9] or patients with neurological disorders [10] for whom cognitive performances variability is greater than for any other group population.
Second, for a reliable clinical interpretation, the use of updated norms is essential. Indeed, cognitive abilities improve from one generation to the next [11]. Such improvement is known as the "Flynn effect" and is explained by the general improvement of education and environmental conditions.
The lack of norms designed for the middle-aged population, the lack of up-to-date norms as well as norms gathered from small-sized samples lead clinicians to use inadequate norms and increase the risk of diagnosis misclassification.
The aim of this study was to compute updated and reliable norms for five tests – the Mini-Mental State Examination (MMSE) assessing global cognitive functioning, the Free and Cued Selective Reminding Test (FCSRT) assessing verbal episodic memory, the Trail Making Test (TMT) assessing executive functions, semantic and phonological fluency tasks assessing language and the Digit Symbol Substitution Test (DSST) assessing psychomotor speed – in a population aged 45 to 70, from the large-sized CONSTANCES study.
Methods
Study design
The methodology of the national CONSTANCES cohort has been detailed elsewhere [12]. Since January 2012, 176,000 volunteers aged 18 and over had been randomly selected among French adults covered by the National health insurance. We considered only the participants aged 45 and over who received a standardized neuropsychological testing. CONSTANCES obtained the authorization of the National Data Protection Authority and was approved by the Institutional Review Board of the National Institute for Medical Research. All participants gave informed consent.
Sample
68,285 participants aged 45 and over have been recruited. Participants aged over 70, those who did not provide information on education or did not complete the tests were excluded (see fig.
S1, online only). Five age groups ([45–50[; [50–55[; [55–60[; [60–65[; [65–70]) and three
educational levels: no diploma (<5 years of education); primary, vocational or high school degree (5–13 years of education); college degree (≥14 years of education) were considered.
Neuropsychological testing
The following tests were administered:
1. MMSE [13] assessing general cognitive functioning (maximum score=30).
2. FCSRT [14] assesssing verbal episodic memory. After the learning phase consisting in memorizing 16 words belonging to 16 semantic categories, the volunteer is invited to recall as many words as possible in two minutes. The category for each word that has not been recalled is provided. This procedure is repeated three times. The delayed recall takes place after a 20-minute delay. Four scores were considered: the three free recall trials (maximum score=48); the
three free and cued recalls (maximum score=48); the delayed free recall (maximum score=16); and the delayed free and cued recall (maximum score=16) were considered.
3. TMT [15] assessing executive functions. This test consists of 25 circles displayed on a sheet of paper. In part A – assessing attention and psychomotor speed – the circles are numbered from 1 to 25 and have to be to connected in ascending order by drawing a line. In part B – assessing planning abilities and mental flexibility – the circles contain numbers or letters to be connected in ascending order by alternating numbers and letters. In case of error, correction is provided. The score was the time (in seconds) to complete the task.
4. Fluency tasks assess language skills in particular, lexico-semantic access, and word search strategy. The tasks consisted in naming in one minute as many words as possible belonging to animals (semantic fluency) or starting by letter R (phonological fluency). The score was the number of generated words.
5. DSST [16] assessing psychomotor speed. On the top of the page, a coding matrix contains the digits 1 to 9, each of them paired with a symbol. Underneath, a series of digits with a blank space for sketching the symbol is presented. The participant has to assign as many symbols as possible to the respective digits in 90 seconds. The score was the number of correct symbols.
In addition to cognitive testing, depressive symptomatology was assessed by the Center for Epidemiologic Studies Depression Scale [17].
Statistical analysis
We first decribed sociodemographic and health caracteristics of participants. Age, gender, and education effect was assessed with univariate and multiple linear regression analysis to determine the stratification variables. The 5th, 10th, 25th, 50th, 75th, 90th and 95th percentiles
stratified on age, gender, and education were reported. Statistical analyses were performed with R statistical software.
Results
The mean age of the whole study sample was 57.7 (SD=7.1). Of the 51,879 participants, 52% were women, 3.4% had low education (<5 years), 49.2% had medium educational level (5–13 years) and 47.4% had higher education (≥14 years). The CESD mean score was 10.5 (SD=9) (missing data=4790).
The results from the full multiple linear regression models revealed that age and education were associated with MMSE (full model: F(7, 51783)=924.2; p<.001) and semantic fluency (full model: F(7, 51353)=586.6; p<.001). Gender, age and education were associated with the free recall of the FCSRT (full model: F(7, 50558)=1486; p<.001), the total FCSRT recall (full model: F(7, 50518)=611.7; p<.001), the delayed FCSRT free recall (full model: F(7, 50457)=1058; p<.001), the total FCSRT delayed recall (full model: F(7, 50451)=244.7; p<.001), the TMT-A (full model: F(7, 51589)=800.2; p<.001) and TMT-B (full model: F(7, 51259)=1188; p<.001), phonological fluency (full model: F(7, 51187)=957.7; p<.001) and DSST (full model: F(7, 51478)=2161; p<.001).
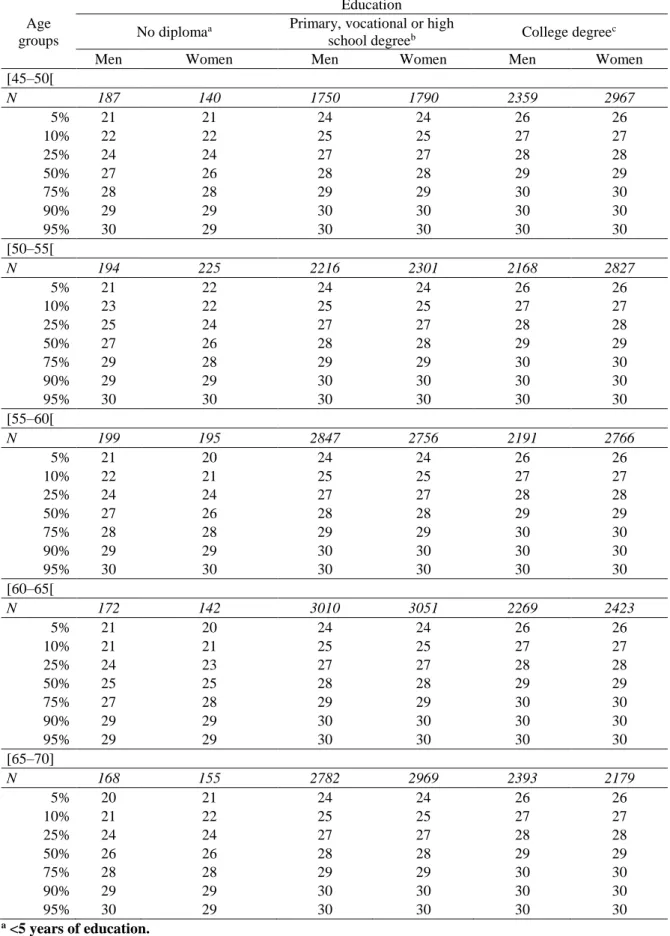
Norms are presented in Tables 1 to 6. The 10th percentile corresponds to the threshold under which 10% of participants get the worst performances. The 75th percentile corresponds to the threshold above which 25% of participants get the best performances except for TMT (the lower score, the better performance).
MMSE was available for 51,791 participants (mean score=28.1, SD=1.9) (Table 1). As may be seen, scores vary little with age and gender and more substantially with education.
Free recall of the FCSRT was available for 50,566 participants (mean score=32.4, SD=5.6) (Table 2). Scores slitghly decrease with age and increase with level of education. Score are slitghly higher in women.
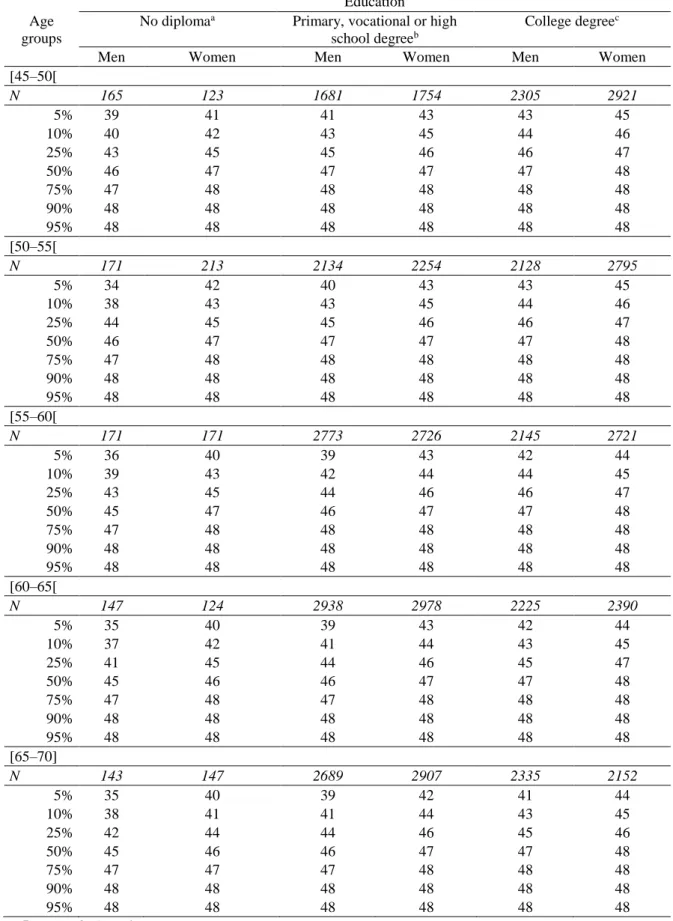
Total FCSRT recall score was available for 50,526 participants (mean score=46.3, SD=2.3) (Table S1, online only). There is a ceiling effect with a median score of 47 or 48 for the majority of groups.
Delayed FCSRT free recall was available for 50,465 participants (mean score=12.7, SD=2.3) (Table S2, online only) and show the same trends as those observed for the free recall.
Total FCSRT delayed recall was available for 50,459 participants (mean score=15.7, SD=1.1) (Table S3, online only). There is a slight effect of education for all categories and an effect of gender for the less-educated category. Both effects are probably minimized by a ceiling effect.
TMT-A was available for 51,597 participants (mean score=34.4, SD=12.3) (Table S4, online only) and TMT-B for 51,267 participants (mean score=69.0, SD=31.7) (Table 3). There is an overall effect of education. Scores substantially decrease with age, in particular for TMT-B. We also observe a gender effect, more pronounced for the TMT-B.
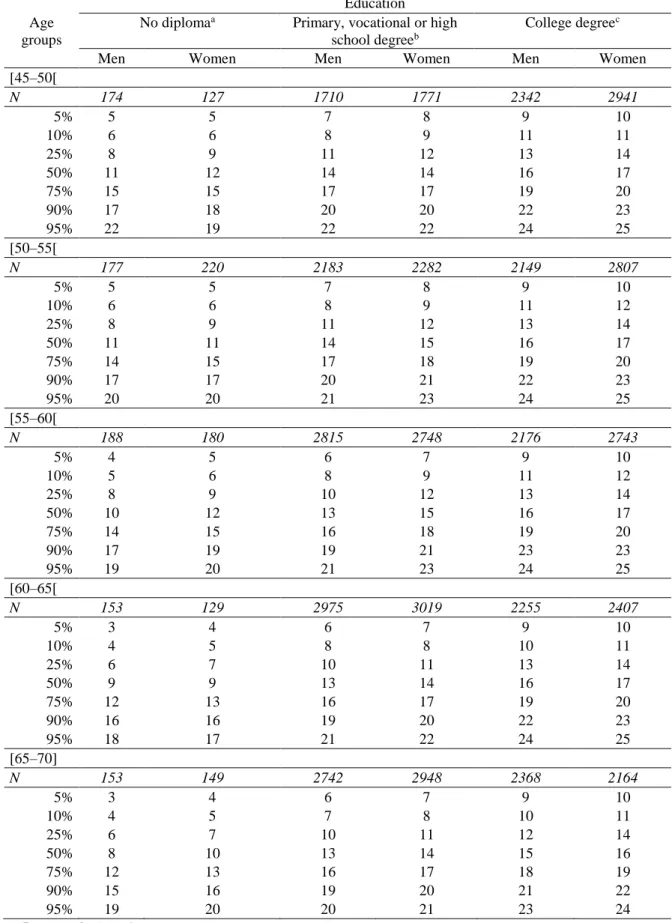
Semantic fluency was available for 51,361 participants (mean score=23.4, SD=6.0) (Table 4). Scores appear to vary little with age and gender, and more substantially with education. Phonological fluency was available for 51,195 participants (mean score=15.1, SD=4.8) (Table 5). We observe the same trends as on semantic fluency, with a stronger effect of gender. DSST was available for 51,486 participants (mean score=65.4, SD=14.8) (Table 6). Scores decrease with age and increase with education and female gender.
Discussion
This study provides updated and reliable norms for five neuropsychological tests broadly used in clinical practice for adults aged 45–70.
First, the results illustrate the effect of age in almost all tests, and more particularly in tests involving speed processing, such as TMT and DSST, illustrating age-related speed processing decline considered as one the cardinal markers of normal cognitive aging [18]. The impact of age can be observed including in tight age ranges categories (5 years) as may be seen for the DSST: median scores are of 52 and 57, respectively for men and women aged [50–55[, and of 48 and 53, respectively for men and women aged [55–60[. Therefore, it seems important to rely on narrow age categories, especially for time-based tests for which we observe scores differences for a 5-year interval.
The results also illustrate the well-known effect of education on neuropsychological performances [19–21]. The link between cognition and education is one of the founding arguments of the concept of cognitive reserve [22] postulating that a high educational level confers to individuals greater compensatory capacities in dealing with age-related cognitive decline. Therefore providing education-stratified normative data is fundamental to properly assess individuals’ performances.
The results also show an effect of gender, in particular for FCRST, phonological fluency and DSST. This finding is consistent with previous studies that have shown that women perform better on tests involving verbal material such as verbal fluency tasks [20] or FCRST [14,23] and in tests involving processing speed [24] such as DSST.
The main goal of this study was to take advantage of the large-sized CONSTANCES cohort to derive norms for the middle-aged population, providing precise age categories of five years,
allowing apprehending the heterogeneity of cognitive performances [1]. Adequate normative data are needed not only for older adults but also for middle-aged people who can experience various neurological disorders including early-onset dementia, multiple sclerosis, stroke or brain injury. Even though numerous normative data for people aged 45 and over have been published, most of them presented a small number of participants in that age category [25,26]. Moreover, some studies lacked of stratification on age and education [25] or relied on very large age categories (i.e., 20 years) [26]. Such studies may have too methodological limitations to properly address the inter-individual variability of cognitive performances in elderly but also middle-aged population. As an example, the present study showed that men aged 45 with a medium level of education (5–13 years of education) had a median free recall FCSRT score of 32 versus 28 for individuals aged 65 with the same education, that is, four words less.
This study has limitations. The norms provided in our study concern only five tests. Nevertheless, these tests cover different cognitive functions and are commonly used in diagnostic process [27–29]. Another limitation is the number of participants enrolled in the lowest category of education (i.e., 143 to 199 participants). However, this limitation can be mitigated in the context of the overall increase in educational attainment which explains the low number of people with less than five years of education.
The main strength of this study obviously relies on the very large sample allowing accessing a wide population variability in terms of age, sex and education.
To conclude, cognitive deficits are frequent in numerous neurological disorders which can affect not only older adults but also middle-aged ones. In order to track changes in cognitive functioning, tailor personalised rehabilitation strategies taking into account individual’s cognitive ressources and weaknesses, neuropsychological testing is an essential tool which has to be interpreted in the light of reliable and updated norms. In this perspective, the normative
scores provided in this study should help physicians and psychologists in their daily clinical practice.
Acknowledgments
CONSTANCES is an “Infrastructure nationale en Biologie et Santé”. It is supported by the “Caisse nationale d’assurance maladie des travailleurs salariés”, a grant from ANR (ANR-11-INBS-0002) and is also partly funded by MSD, AstraZeneca and Lundbeck.
We thank the “Caisse nationale d’assurance maladie des travailleurs salariés”, the “Centres d’examens de santé” of the French Social Security, the “Caisse nationale d’assurance vieillesse”, ClinSearch, Asqualab and Eurocell.
Disclosure of conflict of interest
None.
Study approval
All confidentiality, safety and security procedures were approved by the French legal authorities. The CONSTANCES project has obtained the authorization of the National Data Protection Authority (CNIL no. 910486). It was approved by the National Council for Statistical Information, National Medical Council, Institutional Review Board of the National Institute for Medical Research-INSERM (n° 01-011) and local Committee for Persons Protection.
References
1. Vieira RT, Caixeta L, Machado S, et al. Epidemiology of early-onset dementia: a review of the literature. Clinical Practice and Epidemiology in Mental Health: CP & EMH 2013;
9: 88–95.
2. Bang J, Spina S, Miller BL. Frontotemporal dementia. Lancet (London, England) 2015;
386: 1672–1682.
3. Amieva H, Mokri H, Le Goff M, et al. Compensatory mechanisms in higher-educated subjects with Alzheimer’s disease: a study of 20 years of cognitive decline. Brain: A
Journal of Neurology 2014; 137: 1167–1175.
4. Barker-Collo S, Jones K, Theadom A, et al. Neuropsychological outcome and its correlates in the first year after adult mild traumatic brain injury: A population-based New Zealand study. Brain Injury 2015; 29:1604–1616.
5. Snaphaan L, de Leeuw F-E. Poststroke memory function in nondemented patients: a systematic review on frequency and neuroimaging correlates. Stroke 2007; 38:198–203.
6. Lechevallier-Michel N, Fabrigoule C, Lafont S, Letenneur L, Dartigues J-F. [Normative data for the MMSE, the Benton visual retention test, the Isaacs’s set test, the digit symbol substitution test and the Zazzo’s cancellation task in subjects over the age 70: results from the PAQUID Study]. Revue Neurologique (Paris) 2004; 160: 1059–1070.
7. Malek-Ahmadi M, Powell JJ, Belden CM, et al. Age- and education-adjusted normative data for the Montreal Cognitive Assessment (MoCA) in older adults age 70-99.
Neuropsychology, Development, and Cognition. Section B, Aging, Neuropsychology and Cognition 2015; 22: 755–761.
8. Periáñez JA, Ríos-Lago M, Rodríguez-Sánchez JM, et al. Trail Making Test in traumatic brain injury, schizophrenia, and normal ageing: sample comparisons and normative data.
Archives of clinical neuropsychology 2007; 22:433–447.
9. Wilson RS, Beckett LA, Barnes LL, et al. Individual differences in rates of change in cognitive abilities of older persons. Psychology and Aging 2002; 17:179–193.
10. Lazar RM, Speizer AE, Festa JR, Krakauer JW, Marshall RS. Variability in language recovery after first-time stroke. Journal of neurology, neurosurgery, and psychiatry 2008;
79:530–534.
11. Trahan LH, Stuebing KK, Fletcher JM, Hiscock M. The Flynn effect: a meta-analysis.
Psychological Bulletin 2014; 140: 1332–1360.
12. Zins M, Goldberg M, CONSTANCES team. The French CONSTANCES population-based cohort: design, inclusion and follow-up. European Journal of Epidemiology 2015;
30: 1317–1328.
13. Folstein MF, Folstein SE, McHugh PR. « Mini-mental state ». A practical method for grading the cognitive state of patients for the clinician. Journal of Psychiatric Research 1975; 12: 189–198.
14. Grober E, Buschke H, Crystal H, Bang S, Dresner R. Screening for dementia by memory testing. Neurology 1988; 38: 900–903.
15. Reitan RM. Validity of the Trail Making Test as an Indicator of Organic Brain Damage.
Perceptual and Motor Skills 1958; 8: 271–276.
17. Fuhrer R, Rouillon F. La version française de l’échelle CES-D (Center for Epidemiologic Studies-Depression Scale). Description et traduction de l’échelle d’autoévaluation.
Psychiatrie et Psychobiologie 1989; 4:163–166.
18. Salthouse TA. The processing-speed theory of adult age differences in cognition.
Psychological Review 1996; 103: 403–428.
19. Hall CB, Derby C, LeValley A, Katz MJ, Verghese J, Lipton RB. Education delays accelerated decline on a memory test in persons who develop dementia. Neurology 2007;
69: 1657–1664.
20. Le Carret N, Lafont S, Mayo W, Fabrigoule C. The effect of education on cognitive performances and its implication for the constitution of the cognitive reserve.
Developmental Neuropsychology 2003; 23: 317–337.
21. Stern Y, Gurland B, Tatemichi TK, Tang MX, Wilder D, Mayeux R. Influence of education and occupation on the incidence of Alzheimer’s disease. JAMA 1994; 271: 1004–1010.
22. Stern Y. What is cognitive reserve? Theory and research application of the reserve concept. Journal of the International Neuropsychological Society: JINS 2002; 8: 448– 460.
23. Amieva H, Carcaillon L, Rouze L’Alzit-Schuermans P, Millet X, Dartigues JF, Fabrigoule C. [Cued and uncued memory tests: norms in elderly adults from the 3 Cities epidemiological study]. Revue Neurologique (Paris) 2007; 163: 205–221.
24. Roivainen E. Gender Differences in Processing Speed: A Review of Recent Research.
25. Roos A, Calata D, Jonkers L, et al. Normative data for the Tygerberg Cognitive Battery and Mini-Mental Status Examination in a South African population. Comprehensive
Psychiatry 2010; 51: 207–216.
26. Zimmermann N, Cardoso C de O, Kristensen CH, Fonseca RP. Brazilian norms and effects of age and education on the Hayling and Trail Making Tests. Trends in Psychiatry
and Psychotherapy 2017; 39: 188–195.
27. Grober E, Veroff AE, Lipton RB. Temporal unfolding of declining episodic memory on the Free and Cued Selective Reminding Test in the predementia phase of Alzheimer’s disease: Implications for clinical trials. Alzheimer’s & Dementia (Amsterdam,
Netherlands) 2018; 10: 161–171.
28. Hensel A, Luck T, Luppa M, Glaesmer H, Angermeyer MC, Riedel-Heller SG. Does a reliable decline in Mini Mental State Examination total score predict dementia? Diagnostic accuracy of two reliable change indices. Dementia and Geriatric Cognitive
Disorders 2009; 27: 50–58.
29. Holtzer R, Verghese J, Wang C, Hall CB, Lipton RB. Within-person across-neuropsychological test variability and incident dementia. JAMA 2008; 300: 823–830.
Supporting Information
Additional Supporting Information may be found in the online version of this article:
Figure S1. Flowchart: Study sample for the norms of the different tests (MMSE, FCSRT, TMT,
Verbal fluency, DSST) in the CONSTANCES cohort.
Table S1. Normative data stratified by age, gender and education for the three free and cued
recalls of the FCSRT (number of words retrieved), CONSTANCES cohort (n = 50,526).
Table S2. Normative data stratified by age, gender and education for the delayed free recall of
the FCSRT (number of words retrieved), CONSTANCES cohort (n = 50,465).
Table S3. Normative data stratified by age, gender and education for the delayed free and cued
recall of the FCSRT (number of words retrieved), CONSTANCES cohort (n = 50,459).
Table S4. Normative data stratified by age, gender and education, for the TMT-A (time in
seconds), CONSTANCES cohort (n = 51,597).
Table and figure captions
Figure S1
MMSE, Mini-Mental State Examination; FCSRT, Free and Cued Selective Reminding Test; TMT, Trait Making Test; DSST, Digit Symbol Substitution Test.
Table 1 Normative data stratified by age, gender and education for the MMSE, CONSTANCES
cohort (n = 51,791).
Age groups
Education
No diplomaa Primary, vocational or high
school degreeb College degreec
Men Women Men Women Men Women [45–50[ N 187 140 1750 1790 2359 2967 5% 21 21 24 24 26 26 10% 22 22 25 25 27 27 25% 24 24 27 27 28 28 50% 27 26 28 28 29 29 75% 28 28 29 29 30 30 90% 29 29 30 30 30 30 95% 30 29 30 30 30 30 [50–55[ N 194 225 2216 2301 2168 2827 5% 21 22 24 24 26 26 10% 23 22 25 25 27 27 25% 25 24 27 27 28 28 50% 27 26 28 28 29 29 75% 29 28 29 29 30 30 90% 29 29 30 30 30 30 95% 30 30 30 30 30 30 [55–60[ N 199 195 2847 2756 2191 2766 5% 21 20 24 24 26 26 10% 22 21 25 25 27 27 25% 24 24 27 27 28 28 50% 27 26 28 28 29 29 75% 28 28 29 29 30 30 90% 29 29 30 30 30 30 95% 30 30 30 30 30 30 [60–65[ N 172 142 3010 3051 2269 2423 5% 21 20 24 24 26 26 10% 21 21 25 25 27 27 25% 24 23 27 27 28 28 50% 25 25 28 28 29 29 75% 27 28 29 29 30 30 90% 29 29 30 30 30 30 95% 29 29 30 30 30 30 [65–70] N 168 155 2782 2969 2393 2179 5% 20 21 24 24 26 26 10% 21 22 25 25 27 27 25% 24 24 27 27 28 28 50% 26 26 28 28 29 29 75% 28 28 29 29 30 30 90% 29 29 30 30 30 30 95% 30 29 30 30 30 30 a <5 years of education.
Table 2 Normative data stratified by age, gender and education for the three free recalls of the
FCSRT (number of words retrieved), CONSTANCES cohort (n = 50,566).
Age groups
Education
No diplomaa Primary, vocational or high
school degreeb
College degreec
Men Women Men Women Men Women [45–50[ N 165 123 1681 1754 2306 2922 5% 20 21 23 26 26 29 10% 22 26 25 28 28 31 25% 26 29 28 31 31 33 50% 30 33 32 34 34 37 75% 34 35 35 37 37 39 90% 37 37 38 40 40 42 95% 38 38 39 41 41 43 [50–55[ N 171 212 2137 2254 2130 2795 5% 18 22 22 25 25 28 10% 20 25 24 28 27 30 25% 25 28 28 31 30 33 50% 30 32 31 34 34 36 75% 33 35 34 37 37 39 90% 37 38 37 39 40 41 95% 38 40 39 41 41 42 [55–60[ N 171 172 2775 2726 2147 2722 5% 19 21 21 24 24 27 10% 21 24 23 27 26 29 25% 24 27 27 30 29 32 50% 28 31 30 33 33 35 75% 31 34 34 37 36 38 90% 35 38 37 39 39 40 95% 37 39 38 41 40 42 [60–65[ N 148 124 2941 2984 2228 2391 5% 16 18 20 24 22 26 10% 19 21 22 25 24 28 25% 22 25 26 29 28 31 50% 27 30 29 32 31 35 75% 30 33 33 36 35 38 90% 34 36 36 38 38 40 95% 35 38 37 40 39 42 [65–70] N 143 148 2693 2911 2337 2155 5% 16 20 19 22 21 25 10% 19 22 21 25 23 27 25% 22 25 24 28 27 30 50% 26 29 28 32 31 34 75% 31 32 32 35 34 37 90% 34 36 34 38 37 39 95% 36 38 36 39 39 41 a <5 years of education. b 5–13 years of education. c ≥14 years of education.
Table 3 Normative data stratified by age, gender and education, for the TMT-B (time in
seconds), CONSTANCES cohort (n = 51,267).
Age groups
Education
No diplomaa Primary, vocational or high
school degreeb
College degreec
Men Women Men Women Men Women [45–50[ N 177 134 1726 1780 2331 2943 5% 40 40 35 36 30 31 10% 44 44 39 40 34 35 25% 55 53 49 46 40 41 50% 76 74 61 57 49 49 75% 100 110 79 72 60 61 90% 146 154 102 94 75 74 95% 178 205 121 114 86 84 [50–55[ N 183 217 2184 2291 2153 2819 5% 45 44 39 37 32 34 10% 51 48 43 41 36 37 25% 61 59 52 49 42 44 50% 85 76 64 60 51 53 75% 115 107 82 76 64 65 90% 146 145 107 101 79 79 95% 169 174 132 124 88 91 [55–60[ N 188 179 2810 2751 2180 2747 5% 47 44 40 39 34 34 10% 53 51 45 43 38 38 25% 66 63 54 51 46 45 50% 86 86 68 63 56 55 75% 122 120 86 80 70 67 90% 168 157 114 104 86 83 95% 223 191 136 124 100 95 [60–65[ N 145 128 2977 3034 2258 2411 5% 52 54 44 42 36 37 10% 60 61 48 46 41 41 25% 76 75 59 55 49 49 50% 109 94 73 68 61 60 75% 149 128 96 87 75 74 90% 187 180 125 116 92 91 95% 217 197 152 145 108 104 [65–70] N 150 143 2739 2946 2373 2170 5% 49 50 47 45 39 41 10% 59 60 52 49 44 45 25% 79 73 62 59 52 53 50% 105 98 80 74 65 65 75% 142 135 104 96 80 80 90% 174 180 139 124 97 97 95% 219 209 167 146 114 114 a <5 years of education.
Table 4 Normative data stratified by age, gender and education for the semantic fluency task
(number of words provided in one minute), CONSTANCES cohort (n = 51,361).
Age groups
Education
No diplomaa Primary, vocational or high
school degreeb
College degreec
Men Women Men Women Men Women [45–50[ N 178 131 1722 1780 2345 2946 5% 11 10 14 14 16 16 10% 13 12 16 15 18 18 25% 16 15 18 18 21 21 50% 20 19 22 22 25 25 75% 25 24 26 26 29 29 90% 28 27 30 29 33 33 95% 30 28 32 31 35 35 [50–55[ N 182 222 2190 2287 2153 2811 5% 11 12 14 14 17 16 10% 13 14 15 16 18 18 25% 16 17 19 19 21 21 50% 20 20 23 22 25 25 75% 25 22 27 26 29 29 90% 29 27 30 30 33 33 95% 31 29 32 32 36 36 [55–60[ N 191 186 2826 2751 2180 2748 5% 11 10 14 14 16 16 10% 14 14 16 16 18 18 25% 17 16 19 19 21 21 50% 20 20 22 22 24 25 75% 23 25 26 26 29 29 90% 26 29 30 30 33 33 95% 28 32 32 32 35 36 [60–65[ N 162 137 2981 3027 2260 2412 5% 10 10 14 14 16 16 10% 12 11 15 15 17 18 25% 14 14 18 18 20 21 50% 18 18 22 22 24 25 75% 22 21 26 25 28 29 90% 27 24 30 29 32 32 95% 29 27 32 31 35 35 [65–70] N 160 153 2752 2949 2372 2167 5% 9 10 13 13 15 16 10% 12 12 15 15 17 18 25% 15 15 17 18 20 20 50% 18 18 21 21 24 24 75% 22 21 25 25 28 28 90% 25 25 29 29 32 32 95% 27 27 31 31 34 34 a <5 years of education. b 5–13 years of education. c ≥14 years of education.
Table 5 Normative data stratified by age, gender and education for the phonological fluency
task (number of words provided in one minute), CONSTANCES cohort (n = 51,195).
Age groups
Education
No diplomaa Primary, vocational or high
school degreeb
College degreec
Men Women Men Women Men Women [45–50[ N 174 127 1710 1771 2342 2941 5% 5 5 7 8 9 10 10% 6 6 8 9 11 11 25% 8 9 11 12 13 14 50% 11 12 14 14 16 17 75% 15 15 17 17 19 20 90% 17 18 20 20 22 23 95% 22 19 22 22 24 25 [50–55[ N 177 220 2183 2282 2149 2807 5% 5 5 7 8 9 10 10% 6 6 8 9 11 12 25% 8 9 11 12 13 14 50% 11 11 14 15 16 17 75% 14 15 17 18 19 20 90% 17 17 20 21 22 23 95% 20 20 21 23 24 25 [55–60[ N 188 180 2815 2748 2176 2743 5% 4 5 6 7 9 10 10% 5 6 8 9 11 12 25% 8 9 10 12 13 14 50% 10 12 13 15 16 17 75% 14 15 16 18 19 20 90% 17 19 19 21 23 23 95% 19 20 21 23 24 25 [60–65[ N 153 129 2975 3019 2255 2407 5% 3 4 6 7 9 10 10% 4 5 8 8 10 11 25% 6 7 10 11 13 14 50% 9 9 13 14 16 17 75% 12 13 16 17 19 20 90% 16 16 19 20 22 23 95% 18 17 21 22 24 25 [65–70] N 153 149 2742 2948 2368 2164 5% 3 4 6 7 9 10 10% 4 5 7 8 10 11 25% 6 7 10 11 12 14 50% 8 10 13 14 15 16 75% 12 13 16 17 18 19 90% 15 16 19 20 21 22 95% 19 20 20 21 23 24 a <5 years of education.
Table 6 Normative data stratified by age, gender and education for the DSST (number of
symbols correctly completed), CONSTANCES cohort (n = 51,486).
Age groups
Education
No diplomaa Primary, vocational or high
school degreeb
College degreec
Men Women Men Women Men Women [45–50[ N 185 138 1738 1788 2352 2958 5% 28 32 42 46 54 58 10% 34 38 47 53 58 63 25% 42 47 55 62 66 69 50% 54 57 63 71 74 78 75% 65 71 73 80 82 87 90% 73 79 81 88 90 95 95% 78 85 86 94 96 99 [50–55[ N 190 223 2195 2291 2160 2818 5% 30 32 41 45 52 55 10% 37 38 45 51 57 59 25% 43 46 52 60 63 66 50% 52 57 62 69 72 75 75% 61 65 70 78 80 83 90% 70 73 79 85 87 90 95% 74 81 84 90 92 96 [55–60[ N 194 188 2825 2757 2185 2753 5% 27 27 39 45 49 52 10% 32 34 44 49 53 57 25% 39 45 50 58 60 63 50% 48 53 60 67 68 72 75% 58 63 68 76 77 80 90% 65 69 77 83 84 87 95% 71 77 81 88 89 92 [60–65[ N 168 140 2987 3036 2261 2415 5% 25 24 37 41 46 49 10% 27 29 41 46 50 52 25% 35 38 48 55 57 59 50% 42 48 56 63 65 67 75% 52 57 64 72 73 76 90% 62 66 73 80 81 83 95% 66 71 79 84 86 88 [65–70] N 161 153 2746 2948 2365 2168 5% 19 20 34 38 43 45 10% 26 27 38 42 47 49 25% 35 36 45 50 54 56 50% 43 44 53 59 61 63 75% 51 56 61 67 69 71 90% 61 64 69 75 77 79 95% 66 70 74 80 81 83 a <5 years of education. b 5–13 years of education. c ≥14 years of education.
Table S1 Normative data stratified by age, gender and education for the three free and cued
recalls of the FCSRT (number of words retrieved), CONSTANCES cohort (n = 50,526).
Age groups
Education
No diplomaa Primary, vocational or high
school degreeb
College degreec
Men Women Men Women Men Women [45–50[ N 165 123 1681 1754 2305 2921 5% 39 41 41 43 43 45 10% 40 42 43 45 44 46 25% 43 45 45 46 46 47 50% 46 47 47 47 47 48 75% 47 48 48 48 48 48 90% 48 48 48 48 48 48 95% 48 48 48 48 48 48 [50–55[ N 171 213 2134 2254 2128 2795 5% 34 42 40 43 43 45 10% 38 43 43 45 44 46 25% 44 45 45 46 46 47 50% 46 47 47 47 47 48 75% 47 48 48 48 48 48 90% 48 48 48 48 48 48 95% 48 48 48 48 48 48 [55–60[ N 171 171 2773 2726 2145 2721 5% 36 40 39 43 42 44 10% 39 43 42 44 44 45 25% 43 45 44 46 46 47 50% 45 47 46 47 47 48 75% 47 48 48 48 48 48 90% 48 48 48 48 48 48 95% 48 48 48 48 48 48 [60–65[ N 147 124 2938 2978 2225 2390 5% 35 40 39 43 42 44 10% 37 42 41 44 43 45 25% 41 45 44 46 45 47 50% 45 46 46 47 47 48 75% 47 48 47 48 48 48 90% 48 48 48 48 48 48 95% 48 48 48 48 48 48 [65–70] N 143 147 2689 2907 2335 2152 5% 35 40 39 42 41 44 10% 38 41 41 44 43 45 25% 42 44 44 46 45 46 50% 45 46 46 47 47 48 75% 47 47 47 48 48 48 90% 48 48 48 48 48 48 95% 48 48 48 48 48 48 a <5 years of education.
Table S2 Normative data stratified by age, gender and education for the delayed free recall of
the FCSRT (number of words retrieved), CONSTANCES cohort (n = 50,465).
Age groups
Education
No diplomaa Primary, vocational or high
school degreeb
College degreec
Men Women Men Women Men Women [45–50[ N 165 121 1680 1753 2303 2918 5% 8 8 9 10 10 11 10% 8 10 10 11 11 12 25% 10 11 11 12 12 13 50% 12 13 13 14 14 14 75% 13 14 14 15 15 15 90% 14 15 15 16 15 16 95% 15 16 15 16 16 16 [50–55[ N 170 213 2133 2252 2127 2792 5% 6 9 8 10 9 11 10% 7 9 9 11 11 12 25% 10 11 11 12 12 13 50% 12 12 12 14 13 14 75% 13 14 14 15 15 15 90% 14 15 15 15 15 16 95% 15 15 15 16 16 16 [55–60[ N 171 171 2771 2722 2143 2718 5% 6 8 8 9 9 10 10% 7 9 9 10 10 11 25% 9 11 11 12 12 13 50% 11 13 12 13 13 14 75% 13 14 14 14 14 15 90% 14 15 15 15 15 16 95% 15 15 15 16 16 16 [60–65[ N 147 124 2934 2971 2223 2388 5% 6 8 7 9 8 10 10% 7 8 8 10 9 11 25% 9 10 10 11 11 12 50% 10 12 12 13 13 14 75% 13 14 13 14 14 15 90% 14 15 14 15 15 16 95% 15 15 15 16 15 16 [65–70] N 143 147 2685 2902 2328 2150 5% 6 7 7 8 8 9 10% 6 9 8 9 9 10 25% 8 10 10 11 11 12 50% 11 12 11 13 12 13 75% 13 13 13 14 14 15 90% 14 14 14 15 15 15 95% 15 15 15 15 15 16 a <5 years of education. b 5–13 years of education. c ≥14 years of education.
Table S3 Normative data stratified by age, gender and education for the delayed free and cued
recall of the FCSRT (number of words retrieved), CONSTANCES cohort (n = 50,459).
Age groups
Education
No diplomaa Primary, vocational or high
school degreeb
College degreec
Men Women Men Women Men Women [45–50[ N 165 121 1679 1753 2303 2918 5% 13 14 14 15 15 15 10% 13 15 15 15 15 16 25% 14 16 15 16 16 16 50% 16 16 16 16 16 16 75% 16 16 16 16 16 16 90% 16 16 16 16 16 16 95% 16 16 16 16 16 16 [50–55[ N 170 212 2132 2252 2127 2791 5% 11 14 14 15 15 15 10% 13 15 15 15 15 16 25% 15 16 15 16 16 16 50% 16 16 16 16 16 16 75% 16 16 16 16 16 16 90% 16 16 16 16 16 16 95% 16 16 16 16 16 16 [55–60[ N 171 171 2771 2722 2142 2718 5% 12 14 14 15 14 15 10% 13 14 14 15 15 16 25% 15 16 15 16 16 16 50% 16 16 16 16 16 16 75% 16 16 16 16 16 16 90% 16 16 16 16 16 16 95% 16 16 16 16 16 16 [60–65[ N 147 124 2933 2971 2223 2388 5% 11 13 13 15 14 15 10% 13 14 14 15 15 16 25% 14 15 15 16 16 16 50% 15 16 16 16 16 16 75% 16 16 16 16 16 16 90% 16 16 16 16 16 16 95% 16 16 16 16 16 16 [65–70] N 143 147 2685 2902 2328 2150 5% 12 14 13 14 14 15 10% 13 14 14 15 15 15 25% 15 15 15 16 15 16 50% 16 16 16 16 16 16 75% 16 16 16 16 16 16 90% 16 16 16 16 16 16 95% 16 16 16 16 16 16 a <5 years of education.
Table S4 Normative data stratified by age, gender and education, for the TMT-A (time in
seconds), CONSTANCES cohort (n = 51,597).
Age groups
Education
No diplomaa Primary, vocational or high
school degreeb
College degreec
Men Women Men Women Men Women [45–50[ N 187 138 1742 1789 2353 2963 5% 19 19 18 18 16 17 10% 22 22 20 20 18 19 25% 26 26 24 23 21 22 50% 33 33 29 29 26 27 75% 45 45 37 36 32 33 90% 58 57 45 45 40 40 95% 73 67 53 52 46 45 [50–55[ N 190 223 2204 2296 2162 2829 5% 20 20 19 19 18 18 10% 24 23 21 21 19 20 25% 28 28 26 25 23 24 50% 36 34 31 31 28 29 75% 46 45 39 38 34 36 90% 59 58 49 47 42 43 95% 67 74 55 54 48 49 [55–60[ N 194 189 2834 2759 2187 2758 5% 22 22 20 20 18 19 10% 26 24 22 22 21 21 25% 31 29 27 27 25 25 50% 38 37 33 32 31 31 75% 49 51 41 40 38 38 90% 66 69 51 49 46 45 95% 74 78 58 55 52 52 [60–65[ N 163 139 2995 3041 2262 2417 5% 26 26 22 22 21 21 10% 28 29 25 23 23 23 25% 34 35 29 28 27 27 50% 44 43 36 34 33 33 75% 54 53 45 42 41 41 90% 68 66 55 52 48 49 95% 79 82 62 60 55 56 [65–70] N 164 152 2763 2956 2377 2171 5% 28 23 24 23 23 22 10% 30 27 27 25 25 24 25% 36 35 32 30 29 29 50% 44 43 38 37 36 35 75% 55 56 47 45 44 43 90% 76 68 59 56 54 52 95% 85 84 68 63 61 58 a <5 years of education. b 5–13 years of education. c ≥14 years of education.