Functional Gastrointestinal Disorders and
Incidence of Type 2 Diabetes: Evidence
from the E3N-EPIC Cohort Study
Guy Fagherazzi1,2; Gaëlle Gusto1,2; Beverley Balkau1,2 ; Marie-Christine Boutron-Ruault1,2; Françoise Clavel-Chapelon1,2 ; Fabrice Bonnet1,3
1: Inserm U1018, Center for Research in Epidemiology and Population Health (CESP), Villejuif, France 2: Paris-South University, Villejuif, France
3: CHU Rennes, Rennes 1 University, Rennes, France
Short title: Gastrointestinal Disorders and Type 2 Diabetes Correspondence (and reprint requests) to:
Guy Fagherazzi
Center for Research in Epidemiology and Population Health (CESP), INSERM (Institut National de la Santé et de la Recherche Médicale) U1018, Team 9, Nutrition, Hormones and Women’s Health, Gustave Roussy Institute, 114 rue Edouard Vaillant, 94805 Villejuif Cedex, France
Telephone: +33 1 42 11 61 40 Fax: + 33 1 42 11 40 00
Email: guy.fagherazzi@gustaveroussy.fr
Disclosures: None of the authors had a conflict of interest.
Abstract word count: 214 Main text word count: 2582
Abbreviations:
BMI: body mass index
E3N: Etude Epidémiologique auprès des femmes de la Mutuelle Générale de l’Education Nationale
FGID: functional gastrointestinal disorder T2D: type 2 diabetes
ABSTRACT
OBJECTIVE. Functional gastrointestinal disorders (FGID) such as diarrhea or constipation can reflect intestinal dysfunction, especially with regard to the intestinal microbiota, which in turn has been associated with chronic conditions including obesity and insulin resistance However, little is known on the association between FGID and type 2 diabetes risk.
DESIGN & METHODS. We analyzed the influence of diarrhea, constipation and alternation diarrhea-constipation on T2D risk in 62 683 women from the prospective E3N-EPIC cohort.
RESULTS. We recorded 1 795 T2D cases during follow-up. Compared to women with a normal gastrointestinal transit, women with chronic diarrhea or alternation diarrhea-constipation were at increased risk of T2D (HR=1.29, 95%CI:[1.00-1.65] and 1.32, 95%CI: [1.15-1.52] respectively), whereas women with constipation were at decreased risk (HR=0.67, 95%CI: [0.57-0.78]). There was no
interaction between FGID and BMI for the risk of diabetes. The associations were independent of dietary habits such as coffee, fruit and vegetable consumption, and even of the use of laxatives and psychotropic drugs.
CONCLUSIONS. The study showed for the first time an association between some FGID and T2D risk in a large prospective cohort and supports the hypothesis of a relationship between gastrointestinal functions and diabetes. The presence of gastrointestinal transit disorders could assist in the screening of subjects at higher risk of diabetes, beyond conventional risk factors.
Type 2 diabetes (T2D) is one of the most frequent chronic diseases worldwide and its prevalence keeps increasing.1 The International Diabetes Federation predicts an increase in the worldwide prevalence of T2D from 8.3% to 8.8% in people aged 20 to 79 years between 2013 and 2035, with 382 million people having T2D in 2013 and 592 million in 2035.2 Diabetes has a high social and economic burden and even though primary and secondary preventions of diabetes are constantly improving, there is still a need for a better understanding of this disease. Similarly, functional gastrointestinal disorders (FGID) such as irritable bowel syndrome (IBS) are highly prevalent conditions, 3-5 and frequently accompanied with diarrhea or constipation.5 The worldwide pooled prevalence of chronic idiopathic constipations has been estimated to be 14%. 3 The rate is higher in women and in individuals with low socioeconomic status. It increases with age and is country-dependent, with France ranking among the top countries.3 In 1998, about 26 million French individuals were affected by at least one type of FGID.6 A French study in 1998, based on a
representative sample of the general population aged over 15 years, reported that among those with FGID, 35% had constipation and 28% had diarrhea, and that symptoms lasted 6 months to 5 years for 38% of subjects, and over 5 years for another 52%.5
It is known that individuals with T2D have more frequent occurrences of diarrhea and constipation than the general population.7-9 An estimated 76% of diabetic patients suffer from FGID,10 which are partly attributed to the side effects of T2D treatments such as metformin 11 or insulin,10 or to complications of T2D. Population studies have also shown that obesity is associated with a wide range of chronic gastrointestinal complaints,12-17 which supports the hypothesis that obesity and FGID are physiologically related.4, 10, 11 To date, little is known on the longitudinal association of
gastrointestinal disorders such as diarrhea and constipation and the risk of incident T2D. Hypotheses relating FGID and the microbiota have recently been proposed.18 FGID and the microbiota are thought to share common features such as a genetic predisposal, which could then be involved in the genesis of immune-related disorders and diabetes.19 Further, specific features of the microbiota have been associated with the development of T2D.20, 21
However, to our knowledge, no study has ever evaluated whether FGID such as diarrhea and
constipation could be associated with the risk of developing T2D. Therefore we analyzed the relation between FGID and incident T2D in the large prospective E3N-EPIC cohort study.
RESEARCH DESIGN & METHODS
Study population
The E3N study (Etude Epidémiologique auprès des femmes de la Mutuelle Générale de l’Education Nationale) is a French prospective cohort study of 98 995 female teachers initiated in 199022. E3N is the French component of the European Prospective Investigation into Cancer and Nutrition (EPIC). Participants returned mailed questionnaires to update health-related information and newly
diagnosed diseases every 2 to 3 years and a drug reimbursement claims database has been available since 2004 from their medical insurance records (Mutuelle Générale de l’Education Nationale (MGEN)). Average follow-up per questionnaire cycle has been 83% and overall, the total loss to
follow-up since 1990 is less than 3%. All women signed an informed consent letter to comply with the French National Commission for Computerized Data and Individual Freedom (CNIL).
Of the 98 995 women in the cohort, we excluded those who did not complete the dietary
questionnaire (n = 24 466), those who did not complete any questionnaire after inclusion (n = 926), prevalent cases or non-validated cases of diabetes (n = 3 356), prevalent cases of cardiovascular diseases (stroke and myocardial infarction, n=127), prevalent cancer cases (n=4 169), those with missing baseline information on gastrointestinal transit (n=1 893) and those with extreme values for the ratio between energy intake and required energy (i.e. the lowest and highest percentiles in the cohort) (n = 1 375). A total of 62 683 women were finally included in the analysis, amongst whom 1 795 had a validated diagnosis of T2D during follow-up (1993-2008). Mean follow-up was 8.81 years (STD=2.59) for cases, and 13.58 years (STD=3.94) for non-cases.
Assessment of functional gastrointestinal disorders
Updated information on FGID was requested in the baseline questionnaire (1993) and in the four subsequent follow-up questionnaires (1995, 1997, 2000 and 2002). Study participants answered the question “Which of the following best describes your bowel movements: normal, diarrhea,
constipation, alternation diarrhea-constipation”. Baseline characteristics of the study population according to this variable are provided in Table 1.
Ascertainment of diabetes
Potential diabetes cases were identified first through self-reporting of diabetes in any of the 9 follow-up questionnaires, diabetes diet, antidiabetic drugs, hospitalization for diabetes or through the drugs reimbursement file obtained from the insurance every three months since 01/01/2004. All potential cases were sent a specific questionnaire that included questions on the circumstances of diagnosis (year of diagnosis, symptoms, biological exams, fasting or random glucose concentrations at diagnosis), present diabetes therapy (prescription of a medical diet or physical activity, list of antidiabetic treatments), last measurement of fasting glucose and HbA1c levels. Cases were considered validated when positive for at least two of the following three sources: self-reported diabetes in the follow-up questionnaires and/or positive answer to the specific diabetes
questionnaire (i.e. fasting plasma glucose ≥1.26 g/l or random glucose ≥ 2.00 g/l at diagnosis and/or current fasting plasma glucose ≥1.26 g/l and/or current HbA1c ≥ 7% and/or reporting of antidiabetic drug use) and/or antidiabetic drugs reimbursed by the health insurance in the 1/1/2004-1/1/2012 period. Cases identified through the drug reimbursement file but who were reimbursed for
antidiabetic drugs only once in the period and had declared to be non-diabetic were considered as non-cases.
For the present analysis, prevalent and non-validated diabetes cases were excluded from the analyses, leaving 1 795 validated incident cases during follow-up.
Statistical analysis
Association between gastrointestinal transit and type 2 diabetes risk
Descriptive data were presented as mean (STD) and N (%). Cox multivariable regression models with age as the time scale were used to estimate hazard ratios (HR) and 95% confidence intervals (95% CI) and are tabulated in Table 2. Time at entry was the age at the beginning of follow-up, exit time was the age when participants were diagnosed with diabetes, died, were lost to follow-up, or were censored at the end of the follow-up period, whichever occurred first. The main exposure variable was FGID (normal/diarrhea/constipation/alternation diarrhea-constipation), which was modeled as a time-dependent variable, considering the “normal” category as the reference. Both age-adjusted (M0) and multivariable models (M1) were computed. Multivariable models were adjusted for established T2D risk factors: smoking status (nonsmoker/ ex-smoker/ current smoker, time-dependent), physical activity (continuous in Met-h/week, dependent), treated hypertension (yes, no,
time-dependent), treated hypercholesterolemia (yes, no, baseline), family history of diabetes (yes/no, baseline).
A similar analysis has been performed with overweight as the outcome instead of T2D to quantify the potential mediation by adiposity between FGID and T2D.
Sensitivity analyses
We fitted additional models (M2) adjusted for dietary factors, considered as continuous variables: intake of ethanol (g/day), omega 3 fatty acids (g/day), carbohydrates (g/day), and energy from fat and protein (kcal/day), and consumption of coffee (mL/day), fruits and vegetables(g/day), and processed meat (g/day). Finally, as adiposity is a key factor in T2D etiology, we tested models (M3) additionally adjusted for BMI (continuous, kg/m²). We also tested a potential interaction between FGID and BMI, which was shown to be not statistically significant (Pinter=0.45).
To investigate potential reverse causation, we also evaluated the associations between FGID and T2D by excluding cases in the first five years of follow-up. We also computed Cox models starting in 1995 instead of 1993, where information on the use of laxatives and psychotropic drugs was available. All statistical analyses used SAS 9.3 (SAS Institute Inc., Cary, NC, PHREG procedure for Cox models). All statistical tests were two-sided and considered as significant if the P-value<0.05.
RESULTS
Baseline characteristics
Compared to women with a normal gastrointestinal transit, those with chronic diarrhea were more frequently current smokers (15.6 vs. 13.3%), had a higher intake of carbohydrates (240.4 vs. 236.1 g/day), drank more alcohol (13.9 vs. 11.4 g/day), had a higher energy intake from fat and protein (1 214.4 vs. 1 191.0 kcal/day), drank less coffee (277.0 mL/day vs. 290.7 mL/day), ate less fruits and vegetables (462.7 vs. 488.9 g/day) and had a higher processed meat consumption (26.5 vs. 24.4 g/day) (Table 1).
Women with chronic constipation had a lower BMI than women with a normal gastrointestinal transit (22.4 vs. 22.9 kg/m²). They were more frequently treated for hypercholesterolemia (7.2 vs. 6.8%), had less physical activity (46.6 vs. 50.1 Met-hr/week), had a lower intake of carbohydrates (228.7 vs. 236.1 g/day,) and had lower energy intake from fat and protein (1 174.0 vs. 1 191.0 kcal/day).
Finally, women who had alternation diarrhea-constipation were characterized by a higher coffee consumption than those with normal gastrointestinal transit (295.0 vs. 290.7 mL/day).
Functional gastrointestinal disorders and type 2 diabetes risk
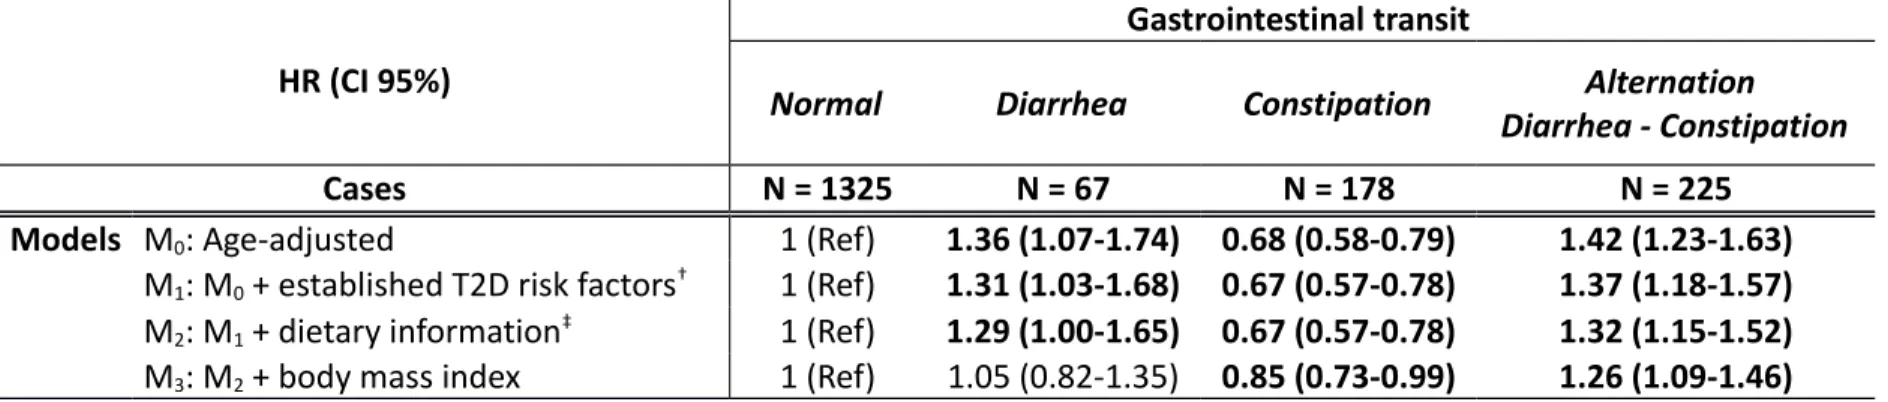
In age-adjusted models (M0, Table 2), there was a positive association between chronic diarrhea and T2D risk, when compared to women with normal gastrointestinal transit (HR=1.36, 95%CI: [1.07-1.74]). In contrast, women with chronic constipation were at a decreased risk of T2D (0.68 [0.58-0.79]). Women with alternation diarrhea-constipation were at an increased risk of T2D (1.42
[1.23-1.63]).
Further adjustment for T2D risk factors (M1models) did not materially change the magnitude of the associations (HR [95%CI]: 1.31 [1.03-1.68], 0.67 [0.57-0.78] and 1.37 [1.18-1.57] for women with chronic diarrhea, constipation and alternation of diarrhea and constipation respectively, as compared to women with normal gastrointestinal transit). Similarly, adjustment for dietary data (models M2) did not modify the associations (respectively 1.29 [1.00-1.65], 0.67 [0.57-0.78] and 1.32 [1.15-1.52] for women with diarrhea, constipation, and alternation diarrhea-constipation, as compared to women with normal gastrointestinal transit) suggesting alternative mechanisms.
Mediation by body mass index
The associations between constipation and alternation of diarrhea and constipation, and risk of T2D were slightly reduced after adjustment for BMI (HR=0.85 [0.73-0.99]) and 1.26 [1.09-1.45]
respectively), while there was no longer any association with chronic diarrhea (1.04 [0.81-1.32]) (M3models).
In addition, we have seen similar patterns of risk regarding the associations between diarrhea, constipation, and alternation diarrhea-constipation and the risk of incident overweight (data not shown). When compared to women with normal gastrointestinal transit, women with constipation were associated with a decreased risk of overweight (HR=0.84 [0.80-0.89]), women with diarrhea were at increased risk (HR=1.13 [1.01-1.26]) and without influence among women with alternation diarrhea-constipation (HR=1.01 [0.95-1.08]).
Other sensitivity analyses
To test the hypothesis of potential reverse causation, we evaluated the associations between FGID and T2D by excluding cases in the first five years of follow-up and results were similar. Similarly, we also computed Cox models starting in 1995 instead of 1993, where information on the use of laxatives and psychotropic drugs was available. Adjustment for these potential confounders did not alter the associations observed.
CONCLUSIONS
In the large prospective E3N-EPIC cohort study, we showed for the first time an association between FGID and T2D risk. Women with chronic diarrhea were found to be at increased risk of T2D when compared to those with normal gastrointestinal transit, whereas those with chronic constipation had a marked decrease in T2D risk. These associations were found to be independent of established T2D risk f, of dietary habits such as coffee or fruit and vegetable consumption, and even of the use of laxatives and psychotropic drugs. The association with diarrhea was found to be mediated partly by adiposity since, after controlling for BMI, only chronic constipation and alternation
diarrhea-constipation were still associated with a respectively decreased and increased T2D risk. Moreover, we have found consistent patterns of risk for diarrhea and constipation when looking at overweight as the outcome instead of T2D. These results are in favor of both a direct mechanism between FGID and T2D and an indirect one through adiposity.
Potential mechanisms
To our knowledge, this is the first study to investigate the association between FGID and T2D risk. Mechanisms in relation to the gut microbiota and inflammation could explain, at least partly, our results. An altered gut microbiota has been linked to obesity and T2D.23, 24 Individuals with chronic FGID are suggested to have a different microbial ecology compared to those with normal
The intestinal microbial community can affect the rate of deposition and utilization of fat, insulin resistance and diabetes, as well as an inflammation state.19,25 It is known that the gut microbiota participates in the overall body metabolism by affecting energy balance, glucose metabolism and low-grade inflammation associated with obesity and related metabolic disorders such as T2D.26 It has been shown that transfer of intestinal microbiota can modulate insulin sensitivity in individuals with metabolic syndrome.27 Translocation of gut microbiota, particularly endotoxins or lipopolysaccharides on the surface of gram-negative bacteria to the systemic circulation, has been proposed to induce inflammation and insulin resistance.24 In mouse, commensal gut bacteria translocate to mesenteric adipose tissue, initiating low-grade inflammation before the onset of insulin resistance and type 2 diabetes.28
However, the present epidemiological study was not designed to properly address the impact of gut microbiota on both FGID and the risk of diabetes. Further complimentary studies are warranted to test this hypothesis.
Limitations and advantages
This study has some limitations. Although we adjusted for many type 2 diabetes risk factors, some residual confounding cannot be completely ruled out. Our study population included only women. Even if some previous studies have reported a higher prevalence of FGID in women, 3 there is no biological ground to suggest indicate that the association with T2D is restricted to women. This study has also numerous strengths. The large number of cases enabled us to have a high statistical power to detect associations. The dietary questionnaire of the E3N-EPIC cohort study provided detailed information on the women’s diet, thus enabling us to adjust for potential
confounders. Moreover, we analyzed validated incident type 2 diabetes cases only, based on a well-defined validation algorithm, which reduced the risk of missing cases or of false-positive cases. Some residual misclassifications with respect to diabetes status may exist, but it is likely to be
Lastly, the prospective design and the long follow-up in the E3N-EPIC cohort allowed us to perform sensitivity analyses while maintaining sufficient statistical power, making a reverse causation hypothesis unlikely.
Conclusion
The study showed for the first time an association between some FGID and T2D risk in a large prospective cohort study, which supports the hypothesis of a relationship between gastrointestinal functions and the development of diabetes. The presence of gastrointestinal transit disorders could assist in the screening of subjects at higher risk of diabetes, independently of classical risk factors. These findings need to be confirmed in other populations and these results may prompt future research, in particular the assessment of the influence of microbiota on the risk of diabetes in individuals with FGID.
ACKNOWLEDGMENTS
The authors are indebted to all participants for providing data. They are also grateful to all members of the E3N-EPIC study group. The authors’ contributions were as follows: GF, BB and FB designed the research; GF and GG conducted the research; GG analyzed data; GF, GG, FB, ML and BB interpreted the data; GF and GG drafted the article, BB, ML, FB, MCBR and FCC revised it critically; FCC
contributed substantially to acquisition of the data and had primary responsibility for the final content of the manuscript; all authors read and approved the final manuscript. The authors declare that there are no conflicts of interest.
Reference List
1. Whiting DR, Guariguata L, Weil C, Shaw J. IDF diabetes atlas: global estimates of the prevalence of diabetes for 2011 and 2030. Diabetes Res Clin Pract 2011;94:311-321. 2. International Diabetes Federation. IDF Diabetes Atlas. Brussels, Belgium: 2013.
3. Suares NC, Ford AC. Prevalence of, and risk factors for, chronic idiopathic constipation in the community: systematic review and meta-analysis. Am J Gastroenterol 2011;106:1582-1591. 4. Ho W, Spiegel BM. The relationship between obesity and functional gastrointestinal
disorders: causation, association, or neither? Gastroenterol Hepatol (N Y ) 2008;4:572-578. 5. Bommelaer G, Dorval E, Denis P, Czernichow P, Frexinos J, Pelc A, Slama A, El HA. Prevalence
of irritable bowel syndrome in the French population according to the Rome I criteria. Gastroenterol Clin Biol 2002;26:1118-1123.
6. Frexinos J, Denis P, Allemand H, Allouche S, Los F, Bonnelye G. [Descriptive study of digestive functional symptoms in the French general population]. Gastroenterol Clin Biol 1998;22:785-791.
7. Valdovinos MA, Camilleri M, Zimmerman BR. Chronic diarrhea in diabetes mellitus:
mechanisms and an approach to diagnosis and treatment. Mayo Clin Proc 1993;68:691-702. 8. von der Ohe MR. Diarrhoea in patients with diabetes mellitus. Eur J Gastroenterol Hepatol
1995;7:730-736.
9. Haines ST. Treating constipation in the patient with diabetes. Diabetes Educ 1995;21:223-232. 10. Reddy PM, Dkhar SA, Subramanian R. Effect of insulin on small intestinal transit in normal
mice is independent of blood glucose level. BMC Pharmacol 2006;6:4.
11. Foss MT, Clement KD. Metformin as a cause of late-onset chronic diarrhea. Pharmacotherapy 2001;21:1422-1424.
12. van Oijen MG, Josemanders DF, Laheij RJ, van Rossum LG, Tan AC, Jansen JB. Gastrointestinal disorders and symptoms: does body mass index matter? Neth J Med 2006;64:45-49.
13. Delgado-Aros S, Locke GR, III, Camilleri M, Talley NJ, Fett S, Zinsmeister AR, Melton LJ, III. Obesity is associated with increased risk of gastrointestinal symptoms: a population-based study. Am J Gastroenterol 2004;99:1801-1806.
14. Talley NJ, Quan C, Jones MP, Horowitz M. Association of upper and lower gastrointestinal tract symptoms with body mass index in an Australian cohort. Neurogastroenterol Motil 2004;16:413-419.
15. Talley NJ, Howell S, Poulton R. Obesity and chronic gastrointestinal tract symptoms in young adults: a birth cohort study. Am J Gastroenterol 2004;99:1807-1814.
16. Svedberg P, Johansson S, Wallander MA, Hamelin B, Pedersen NL. Extra-intestinal
manifestations associated with irritable bowel syndrome: a twin study. Aliment Pharmacol Ther 2002;16:975-983.
17. Aro P, Ronkainen J, Talley NJ, Storskrubb T, Bolling-Sternevald E, Agreus L. Body mass index and chronic unexplained gastrointestinal symptoms: an adult endoscopic population based study. Gut 2005;54:1377-1383.
18. Major G, Spiller R. Irritable bowel syndrome, inflammatory bowel disease and the microbiome. Curr Opin Endocrinol Diabetes Obes 2014;21:15-21.
19. Jeffery IB, O'Toole PW. Diet-microbiota interactions and their implications for healthy living. Nutrients 2013;5:234-252.
20. Amar J, Serino M, Lange C, Chabo C, Iacovoni J, Mondot S, Lepage P, Klopp C, Mariette J, Bouchez O, Perez L, Courtney M, Marre M, Klopp P, Lantieri O, Dore J, Charles M, Balkau B, Burcelin R. Involvement of tissue bacteria in the onset of diabetes in humans: evidence for a concept. Diabetologia 2011;54:3055-3061.
21. Tremaroli V, Backhed F. Functional interactions between the gut microbiota and host metabolism. Nature 2012;489:242-249.
22. Fagherazzi G, Vilier A, Bonnet F, Lajous M, Balkau B, Boutron-Rualt MC, Clavel-Chapelon F. Dietary acid load and risk of type 2 diabetes: the E3N-EPIC cohort study. Diabetologia 2014;57:313-320.
23. Larsen N, Vogensen FK, van den Berg FW, Nielsen DS, Andreasen AS, Pedersen BK, Al-Soud WA, Sorensen SJ, Hansen LH, Jakobsen M. Gut microbiota in human adults with type 2 diabetes differs from non-diabetic adults. PLoS One 2010;5:e9085.
24. Cani PD, Amar J, Iglesias MA, Poggi M, Knauf C, Bastelica D, Neyrinck AM, Fava F, Tuohy KM, Chabo C, Waget A, Delmee E, Cousin B, Sulpice T, Chamontin B, Ferrieres J, Tanti JF, Gibson GR, Casteilla L, Delzenne NM, Alessi MC, Burcelin R. Metabolic endotoxemia initiates obesity and insulin resistance. Diabetes 2007;56:1761-1772.
25. Esser N, Legrand-Poels S, Piette J, Scheen AJ, Paquot N. Inflammation as a link between obesity, metabolic syndrome and type 2 diabetes. Diabetes Res Clin Pract 2014.
26. Cani PD, Osto M, Geurts L, Everard A. Involvement of gut microbiota in the development of low-grade inflammation and type 2 diabetes associated with obesity. Gut Microbes
2012;3:279-288.
27. Vrieze A, Van NE, Holleman F, Salojarvi J, Kootte RS, Bartelsman JF, Dallinga-Thie GM,
Ackermans MT, Serlie MJ, Oozeer R, Derrien M, Druesne A, Van Hylckama Vlieg JE, Bloks VW, Groen AK, Heilig HG, Zoetendal EG, Stroes ES, de Vos WM, Hoekstra JB, Nieuwdorp M. Transfer of intestinal microbiota from lean donors increases insulin sensitivity in individuals with metabolic syndrome. Gastroenterology 2012;143:913-916.
28. Amar J, Chabo C, Waget A, Klopp P, Vachoux C, Bermudez-Humaran LG, Smirnova N, Berge M, Sulpice T, Lahtinen S, Ouwehand A, Langella P, Rautonen N, Sansonetti PJ, Burcelin R.
Intestinal mucosal adherence and translocation of commensal bacteria at the early onset of type 2 diabetes: molecular mechanisms and probiotic treatment. EMBO Mol Med